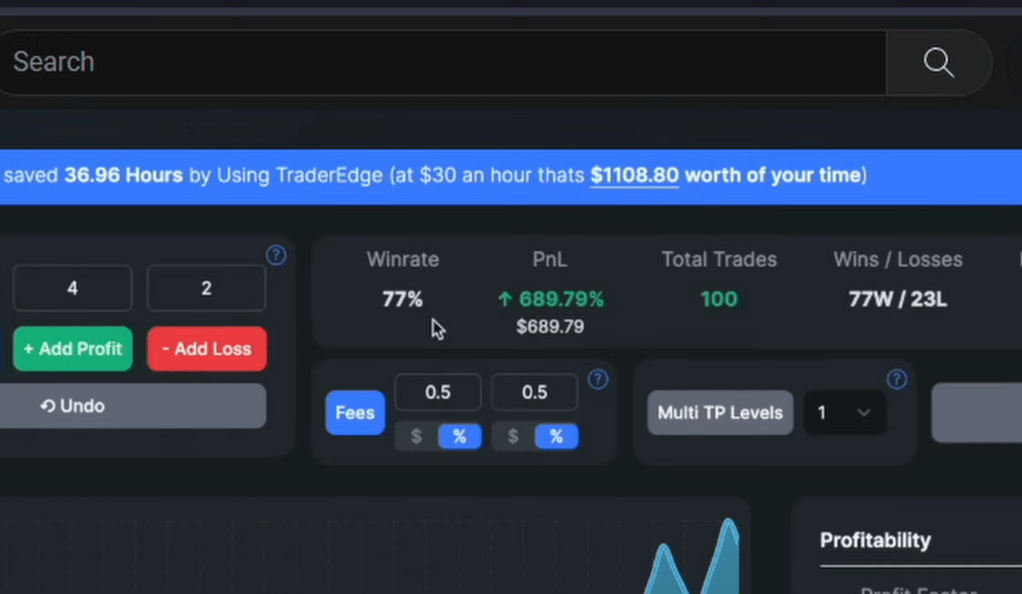
In the world of trading, strategies are the backbone of any successful venture. One such strategy that has been making waves recently is a backtested Tradingview Indicator Strategy. This strategy, which boasts a claimed win rate of 77% and a staggering 689% profit, has been tested on the 5-minute chart with the New Zealand Dollar USD pair.
The world of trading is a complex and often unpredictable one. Traders are constantly on the lookout for strategies that can give them an edge in the market. The Tradingview Indicator Strategy is one such approach that has been gaining attention due to its impressive performance metrics. With a claimed win rate of 77% and a profit of 689%, it’s no wonder that traders are taking notice. This strategy was tested on the 5-minute chart with the New Zealand Dollar USD pair, a popular choice among forex traders. The short time frame of the 5-minute chart allows for quick trades, while the NZD/USD pair is known for its volatility, providing plenty of trading opportunities
The Core Indicators
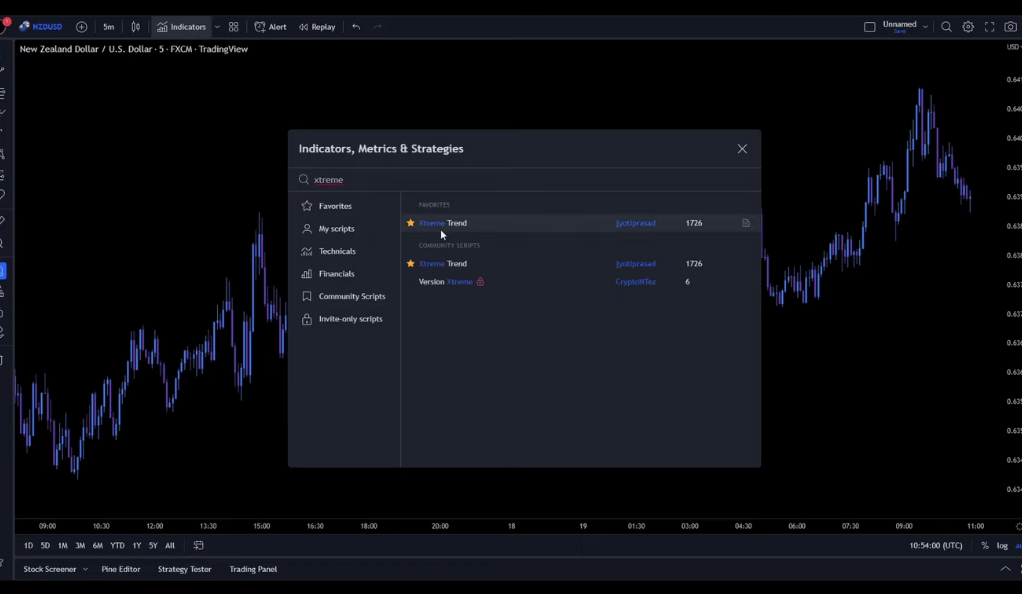
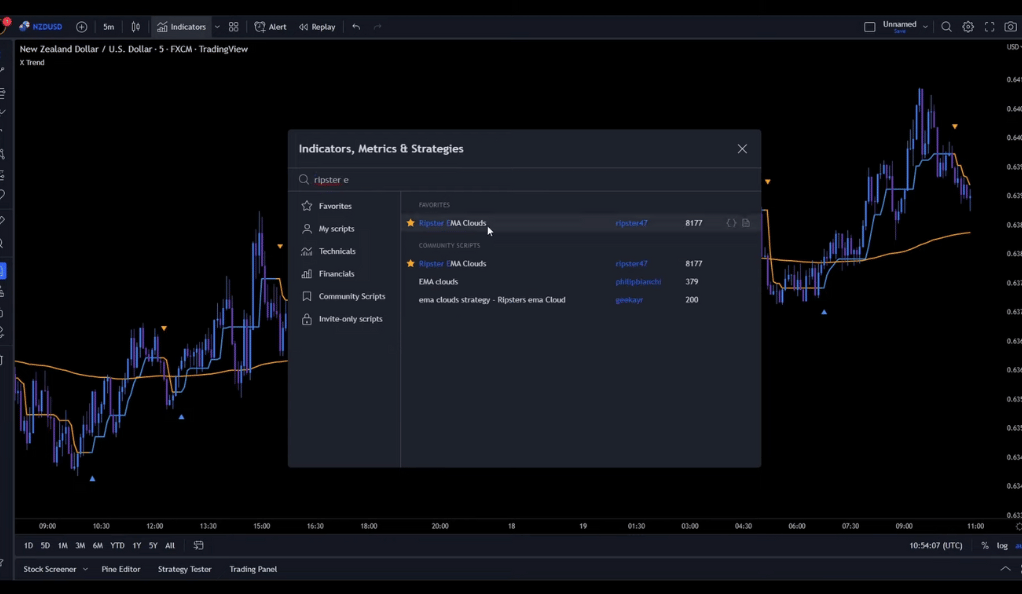
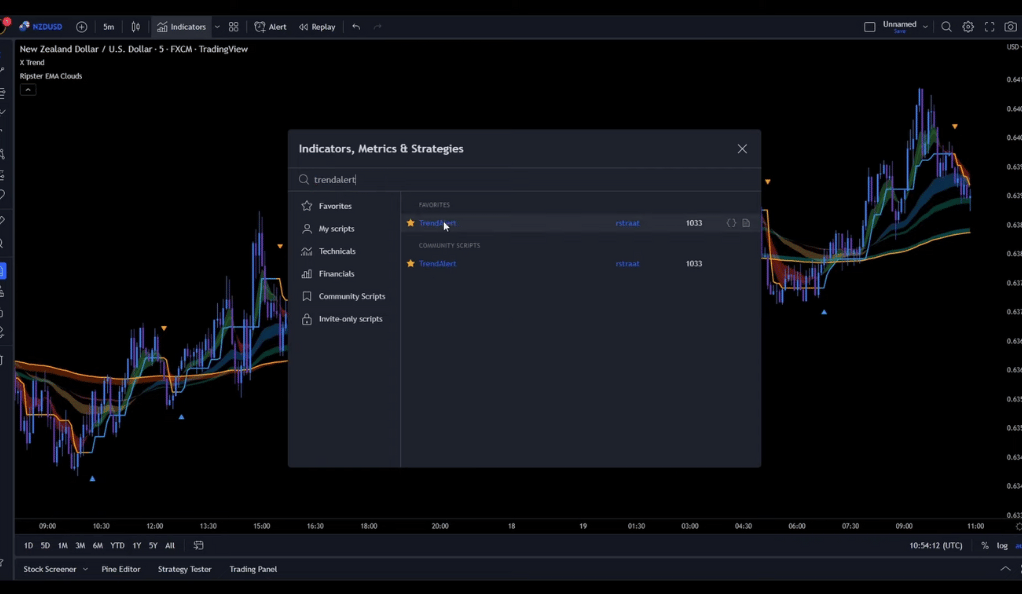
The strategy relies heavily on three key Tradingview Indicators: XTreme Trend by jyotiprasad, Ripster EMA Clouds by ripster47, and Trend Alert by rstraat. These indicators, when used in tandem, provide a comprehensive view of market trends and potential trading opportunities.
XTreme Trend
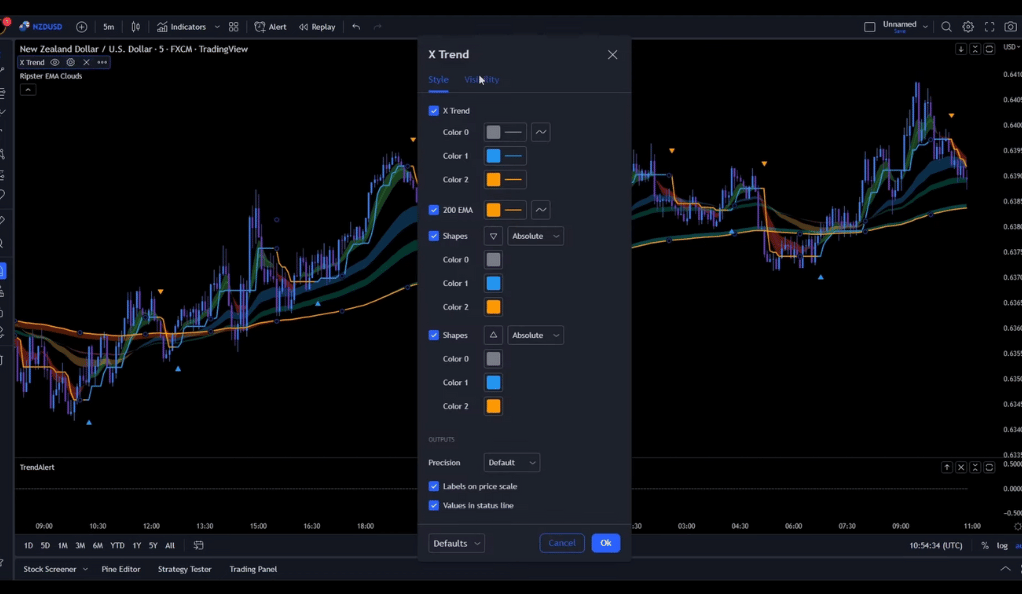
The first indicator, XTreme Trend, is a powerful tool that helps traders identify potential market trends. It’s like a compass guiding traders through the often turbulent waters of the trading market. The XTreme Trend indicator is designed to help traders identify the direction of the market trend. It does this by analyzing the price action and using a complex algorithm to determine whether the market is trending upwards or downwards. This information is crucial for traders as it helps them decide whether to enter a long or short position.
Ripster EMA Clouds
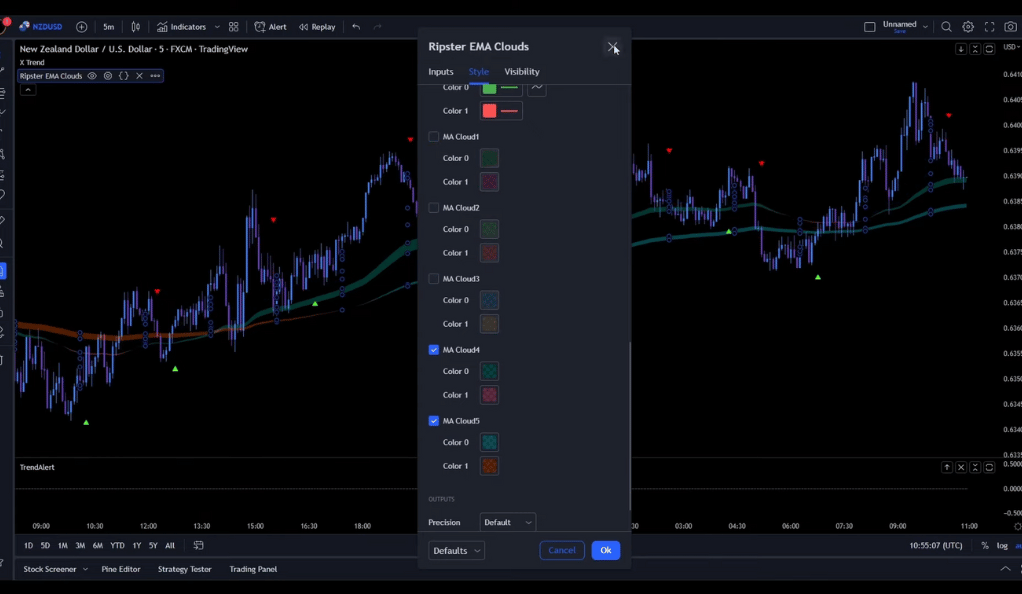
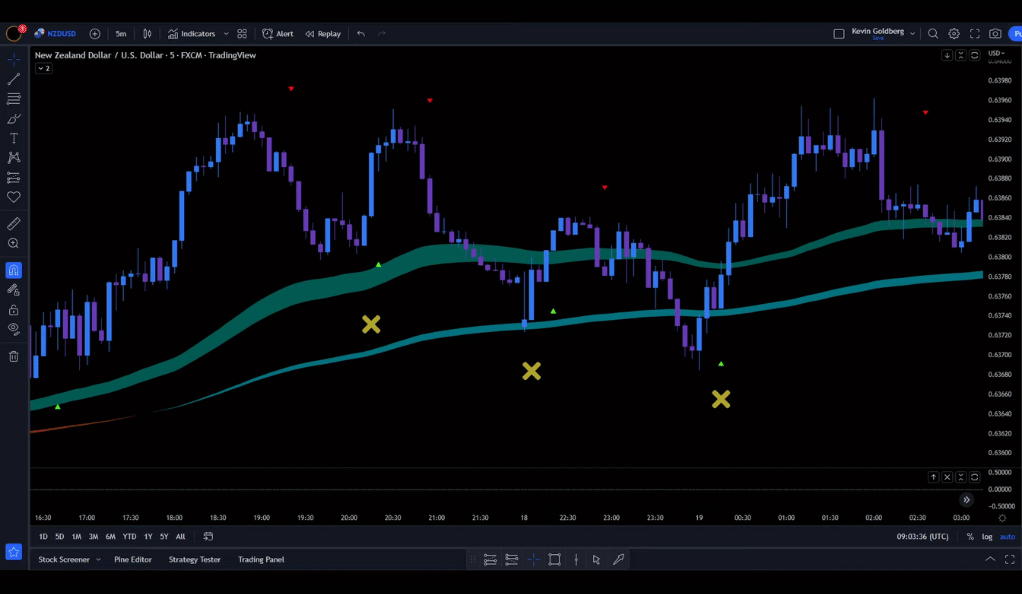
The second indicator, Ripster EMA Clouds, acts as a weather forecast for the market. It helps traders understand the market’s mood, whether it’s bullish (green and blue clouds) or bearish (orange and purple clouds). The Ripster EMA Clouds indicator is a visual tool that helps traders understand the market’s mood. It uses a color-coded system to indicate whether the market is in a bullish or bearish state. When the clouds are green and blue, it indicates a bullish market, suggesting that it might be a good time to enter a long position. On the other hand, when the clouds are orange and purple, it indicates a bearish market, suggesting that it might be a good time to enter a short position.
Trend Alert
The third and final indicator, Trend Alert, serves as a vigilant lookout. It alerts traders to potential trading opportunities through color-coded signals. The Trend Alert indicator is like a vigilant lookout, always on the watch for potential trading opportunities. It uses color-coded signals to alert traders when a potential trading opportunity arises. When the indicator turns green, it signals a potential opportunity to enter a long position. Conversely, when the indicator turns red, it signals a potential opportunity to enter a short position.
Customizing the Indicators
To maximize the effectiveness of these indicators, they are customized in specific ways. This includes unchecking certain options and changing the colors of elements. This level of customization allows traders to tailor the indicators to their specific trading style and preferences. Customizing the indicators is a crucial step in this strategy. By unchecking certain options and changing the colors of elements, traders can tailor the indicators to their specific trading style and preferences. For example, in the XTreme Trend indicator, traders might choose to uncheck the X Trend and 200 EMA options, and change the colors of the triangles to suit their visual preferences. Similarly, in the Ripster EMA Clouds indicator, traders might choose to uncheck the MA Cloud 1, 2, and 3 options to simplify the display.
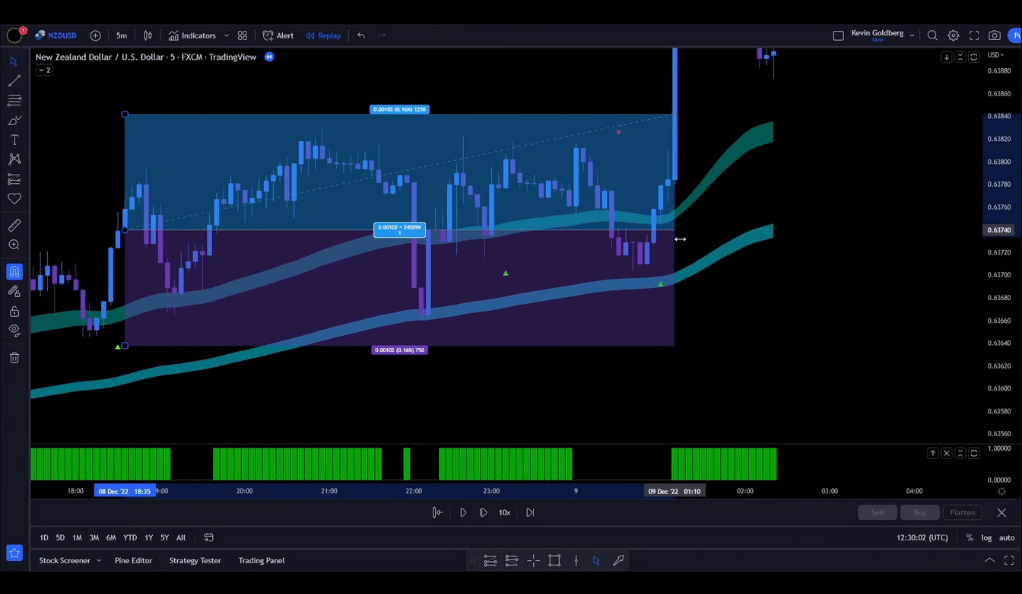
Trading Rules for Long Positions
Entering a long position requires a keen eye and adherence to a set of specific rules:
- Price Action: The price action must be moving above the EMA-Clouds.
- Cloud Color: The clouds must be colored in green and blue.
- Pullback: A valid pullback into the green cloud is needed, during which the clouds cannot change color.
- Post-Pullback: After the pullback, a green triangle must appear, and the price action must close above the clouds.
- Trend Alert: The trend alert must be green colored.
Once these conditions are met, a long trade is entered, with the stop loss placed slightly below the recent swing low. Two profit targets are set: the first at a risk to reward ratio of 1:1, and the second at a ratio of 1:2.
Entering a long position in this strategy requires a keen eye and strict adherence to a set of specific rules. The price action must be moving above the EMA-Clouds, indicating a bullish market. The clouds must be colored in green and blue, further confirming the bullish sentiment. A valid pullback into the green cloud is needed, during which the clouds cannot change color. This pullback is a crucial part of the strategy as it allows traders to enter the market at a more favorable price. After the pullback, a green triangle must appear, and the price action must close above the clouds. This is the signal that it’s time to enter a long position. Finally, the trend alert must be green colored, confirming the bullish signal.
Once all these conditions are met, a long trade is entered. The stop loss is placed slightly below the recent swing low, providing a safety net in case the market moves against the trade. Two profit targets are set: the first at a risk to reward ratio of 1:1, and the second at a ratio of 1:2. This dual target system allows traders to secure some profit early on while still leaving room for more gains if the market continues to move in their favor.
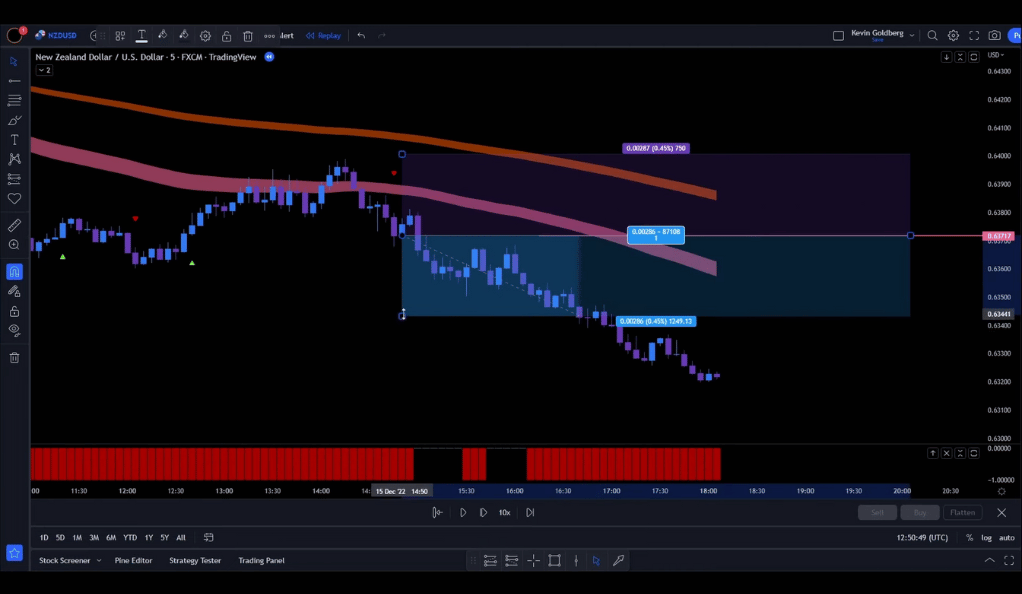
Trading Rules for Short Positions
The rules for entering a short position mirror those for long positions, but with a few key differences. The price action must be moving below the EMA-Clouds, and the clouds must be colored in orange and purple. The rest of the rules follow the same pattern but in reverse.
Entering a short position in this strategy also requires adherence to a set of specific rules, which are essentially the mirror image of the rules for entering a long position. The price action must be moving below the EMA-Clouds, indicating a bearish market. The clouds must be colored in orange and purple, further confirming the bearish sentiment. A valid pullback into the purple cloud is needed, during which the clouds cannot change color. This pullback, like in the case of a long position, allows traders to enter the market at a more favorable price. After the pullback, a red triangle must appear, and the price action must close below the clouds. This is the signal that it’s time to enter a short position. Finally, the trend alert must be red colored, confirming the bearish signal.
Once all these conditions are met, a short trade is entered. The stop loss is placed slightly above the recent swing high, providing a safety net in case the market moves against the trade. Two profit targets are set: the first at a risk to reward ratio of 1:1, and the second at a ratio of 1:2. This dual target system, like in the case of a long position, allows traders to secure some profit early on while still leaving room for more gains if the market continues to move in their favor.
Identifying Invalid Signals
Not all signals are valid, and part of the strategy involves identifying and disregarding these invalid signals. For example, a long signal without a green histogram from the trend alert indicator is invalid, as is a short signal where the clouds are not purple and orange colored.
Identifying invalid signals is a crucial part of this strategy. Not all signals are valid, and being able to distinguish between valid and invalid signals can save traders from making unprofitable trades. For example, a long signal without a green histogram from the trend alert indicator is considered invalid. This is because the green histogram is a key part of the confirmation process for entering a long position. Without it, the signal is incomplete. Similarly, a short signal where the clouds are not purple and orange colored is also considered invalid. The color of the clouds is a key indicator of market sentiment, and if the clouds are not the correct color, it suggests that the market may not be in a bearish state, making a short position risky.
Backtesting the Strategy
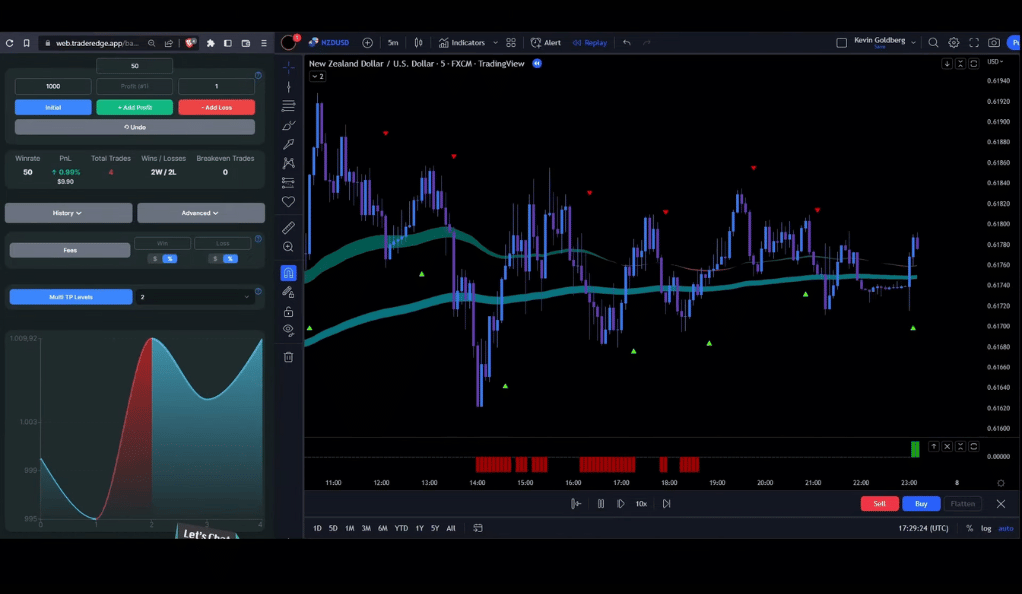
The strategy was backtested with an initial balance of 1000 USD and a risk of 1% per trade. Half of the position size was closed at a risk to reward ratio of 1:1, and the other half at a ratio of 1:2. The results? A win rate of 60% and a profit of 50%. The account grew from 1000 USD to 1500 USD after 100 trades.
Backtesting is a critical part of developing any trading strategy. It involves testing the strategy on historical market data to see how it would have performed in the past. This strategy was backtested with an initial balance of 1000 USD and a risk of 1% per trade. This risk level is considered conservative, allowing for a significant number of losing trades before the account balance is depleted. Half of the position size was closed at a risk to reward ratio of 1:1, securing some profit while still leaving room for more gains. The other half was closed at a ratio of 1:2, allowing for potentially larger gains if the market continued to move in the trader’s favor.
The results of the backtesting were impressive. The strategy achieved a win rate of 60% and a profit of 50%. This means that out of 100 trades, 60 were profitable. The account balance grew from 1000 USD to 1500 USD, a 50% increase. These results suggest that the strategy has potential, but as always, past performance is not indicative of future results.
Conclusion
The backtesting results show that this Tradingview Indicator Strategy is worth testing. With a win rate of 60% and a profit of 50%, it’s clear that this strategy has potential. However, as with any trading strategy, it’s important to remember that past performance is not indicative of future results. Always trade responsibly and within your means.
Ainu Token aims to offer impartial and trustworthy information on cryptocurrency, finance, trading, and shares. However, we don't provide financial advice and recommend users to conduct their own studies and thorough checks.
Comments (No)