In the world of trading, having the right set of indicators can often be the key determinant of success or failure. Among the plethora of tools available, the Bollinger Bands indicator stands out as a powerful and versatile tool. What sets this indicator apart is its ability to not only identify the direction of a trend but also account for pullbacks, minimizing the occurrence of false signals. This comprehensive guide aims to delve into the workings of the Bollinger Bands indicator and provide insights on how to leverage its potential to your advantage.
The Bollinger Bands indicator, developed by John Bollinger, consists of three lines on a price chart: a middle line representing the simple moving average (SMA) and upper and lower lines indicating standard deviations. The width between the bands reflects market volatility. Price approaching the upper band suggests overbought conditions, while the lower band indicates oversold conditions. Traders look for price action at these levels as potential signals for future price movements.
To use the Bollinger Bands effectively, understand its applications. When price touches or crosses the upper band, it may indicate a reversal or selling opportunity. Conversely, touching or crossing the lower band suggests a potential reversal or buying opportunity. Traders can also observe band width over time to gauge market volatility. Combining Bollinger Bands with other technical analysis tools enhances trading strategies. Exercise caution, use risk management strategies, and gain experience to maximize the benefits of mastering this indicator.
Understanding the Bollinger Bands Indicator
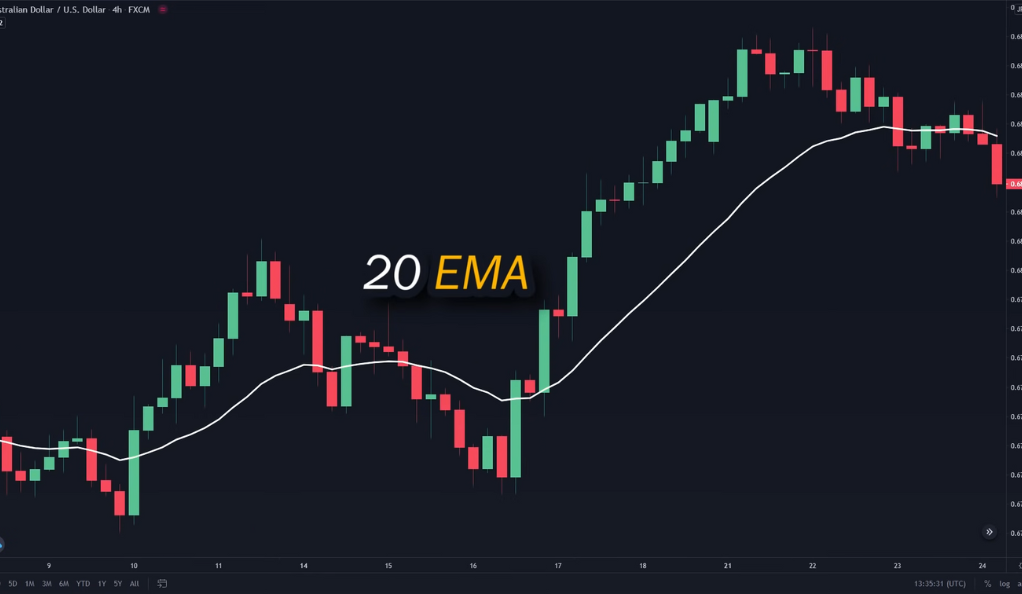
The Bollinger Bands indicator is composed of three main elements. Firstly, there is a 20-period simple moving average (SMA) positioned in the middle. This moving average provides a reference point for the overall direction of the market. Secondly, there are two bands plotted above and below the SMA, which represent a certain number of standard deviations from the moving average. These bands serve as indicators of market volatility, expanding or contracting based on the price movements.
The Bollinger Bands indicator consists of a middle line, formed by a 20-period SMA, and upper and lower bands determined by standard deviations. The middle line reflects the average price and helps identify trends and potential reversals. The bands adjust to volatility, expanding during high volatility and contracting during low volatility. By monitoring price interactions with the bands, traders can spot overbought or oversold conditions and assess market volatility. Effective utilization of the Bollinger Bands requires technical analysis skills and experience to interpret signals accurately for informed trading decisions.
The Middle Line
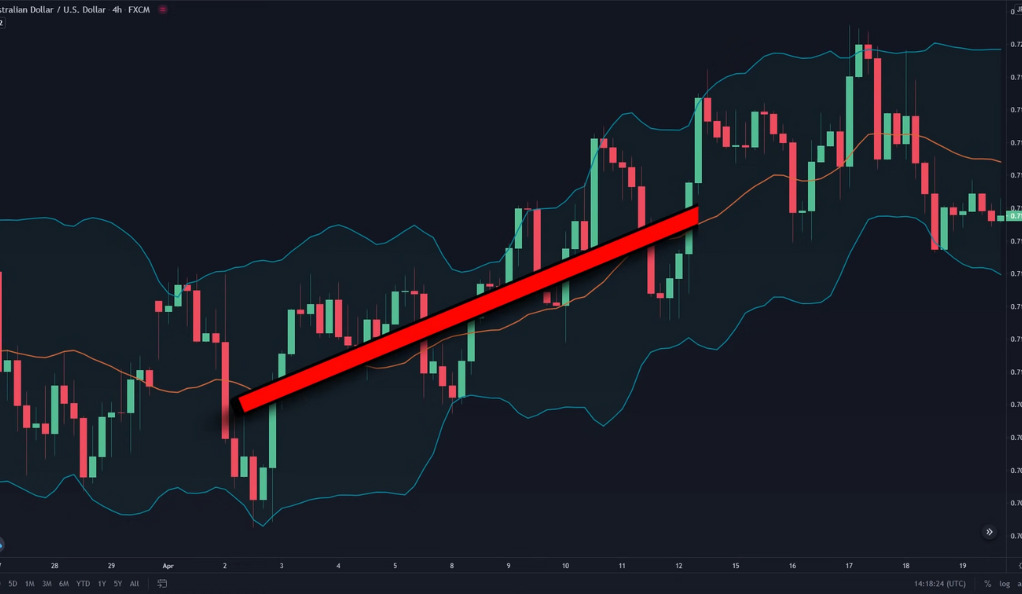
The middle line of the Bollinger Bands indicator plays a vital role in understanding market trends. It serves as a reference point for traders to gauge the overall direction of the market. When the middle line is sloping upwards, it indicates an uptrend, suggesting that prices are generally rising. This can be interpreted as a bullish signal, and traders may consider looking for buying opportunities or holding existing long positions. On the other hand, when the middle line is sloping downwards, it indicates a downtrend, implying that prices are generally declining. This can be seen as a bearish signal, and traders may consider looking for selling opportunities or holding existing short positions.
By observing the direction and slope of the middle line, traders can gain valuable insights into the prevailing market trend. However, it is important to note that the middle line alone may not provide a complete picture of the market. It is advisable to combine the analysis of the middle line with other technical indicators, price patterns, and market conditions for a more comprehensive understanding. This approach can enhance decision-making and increase the chances of making profitable trades.
The Standard Deviation Bands
The standard deviation bands of the Bollinger Bands indicator are instrumental in assessing market volatility. These bands provide valuable information about the degree of price fluctuations in the market. When the bands are contracting or positioned close together, it indicates a period of low volatility. During such times, the price movements are relatively restrained and predictable. Traders may interpret this as a signal of potential consolidation or a lull in market activity. It is important to exercise caution during low volatility periods as they can be followed by increased volatility and significant price movements.
The standard deviation bands of the Bollinger Bands indicate market volatility. When the bands expand and move apart, it signifies high volatility, with unpredictable and pronounced price movements. Traders interpret this as a potential trend acceleration or significant market event. During such periods, implementing risk management strategies and adjusting trading approaches becomes crucial. By monitoring the standard deviation bands’ behavior and width, traders can assess market volatility, aiding decisions like position adjustments, setting stop-loss levels, and identifying breakout opportunities. Combining analysis with other indicators enhances trading strategies and improves outcomes.
Common Mistake: Misusing the Bollinger Bands
One common mistake made by traders is misusing the Bollinger Bands as a sole overbought and oversold indicator. This approach involves selling when the price touches or crosses the upper bands and buying when the price touches or crosses the lower bands. However, relying solely on this strategy can be flawed and may lead to trading against the prevailing trend, which is generally not advisable.
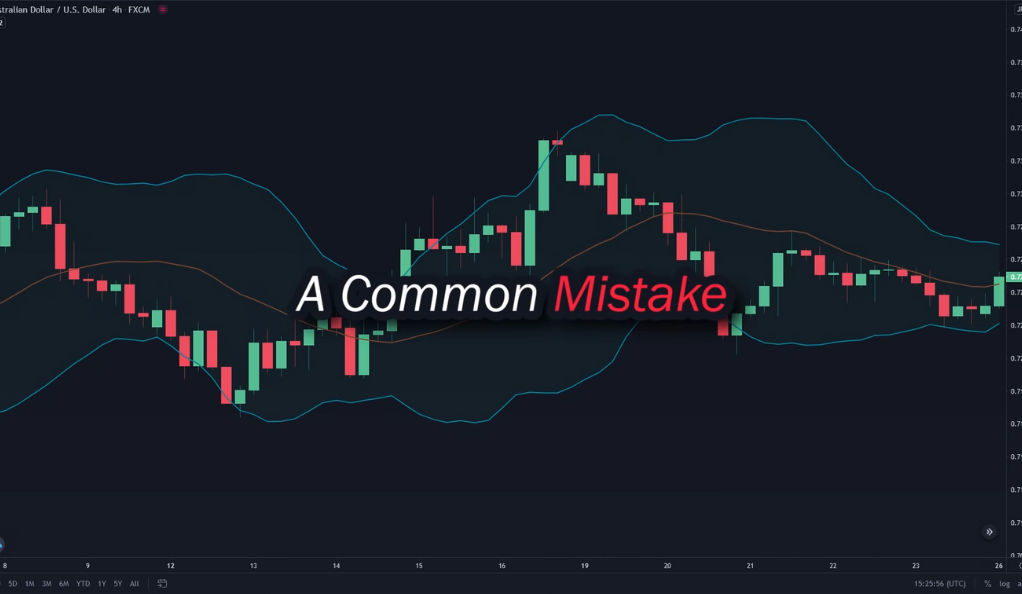
The Bollinger Bands are designed to provide insights into market volatility and trend direction, rather than serving as strict overbought and oversold indicators. While the price touching the upper or lower bands can indicate potential reversal zones, it does not guarantee an immediate trend reversal. Markets can remain overbought or oversold for extended periods during strong trends. Therefore, blindly selling at the upper bands or buying at the lower bands without considering the overall trend can result in missed opportunities or entering trades that are counter to the prevailing market direction. It is crucial to complement the analysis of Bollinger Bands with other technical indicators, chart patterns, and confirmation signals to make more informed trading decisions and avoid falling into this common mistake.
The Bollinger Band Squeeze Strategy: Predicting Price Breakouts
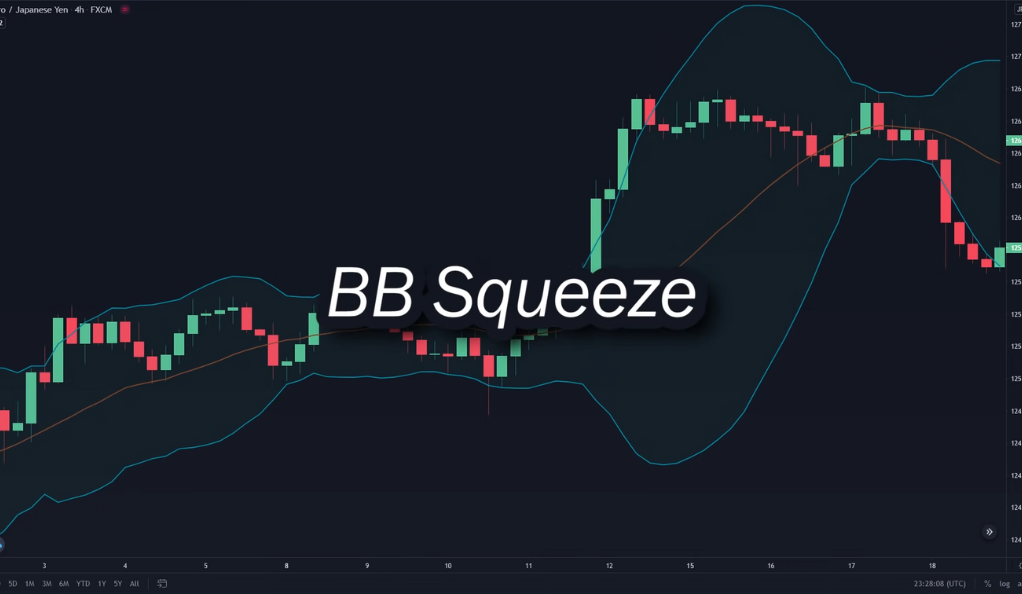
The Bollinger Band Squeeze strategy is a popular approach that aims to predict price breakouts by utilizing volatility. This strategy is most effective when applied to markets that are experiencing a period of consolidation or range-bound movement. In such conditions, the middle line representing the simple moving average (SMA) tends to be relatively flat, indicating a lack of clear trend, while the upper and lower bands are positioned close to each other, reflecting reduced market volatility.
The Bollinger Band Squeeze strategy involves identifying a flat middle SMA line and tightly squeezed bands, indicating low volatility and a potential breakout. When the bands begin to expand, signaling increased volatility, traders anticipate a price breakout in the direction of the expansion. By combining this setup with other technical analysis tools and confirmation signals, traders can potentially profit from the anticipated breakout. Caution should be exercised, waiting for confirmation before entering trades, and employing risk management techniques such as setting stop-loss orders.
Identifying the Breakout
When seeking to identify a price breakout, it is essential to observe the behavior of the standard deviation lines. As these lines begin to expand, it signals an increase in market volatility, which often precedes a potential breakout. This expansion indicates that price movements are becoming more pronounced and significant. Traders interpret this as a signal that the market is likely to make a decisive move in the near future.
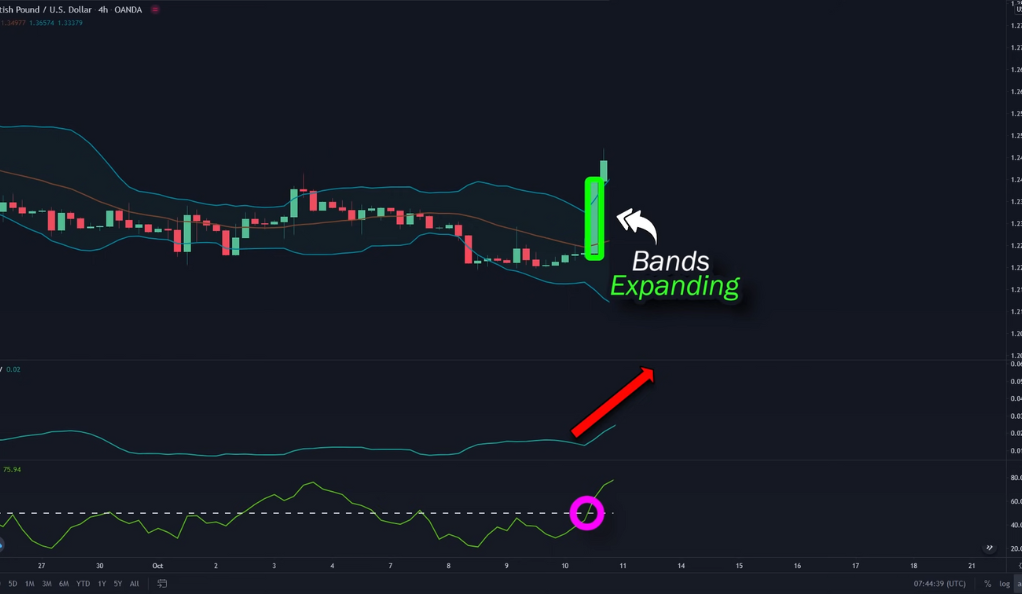
To predict the direction of the breakout, traders rely on analyzing price action. By closely observing how the price behaves within the Bollinger Bands and the overall chart patterns, traders can gain insights into the potential direction the breakout may take. This involves looking for key price levels, trendlines, chart formations, or candlestick patterns that might indicate bullish or bearish sentiment. The combination of expanding standard deviation lines and price action analysis helps traders make informed predictions about the potential breakout direction, enabling them to position themselves accordingly and potentially profit from the subsequent price movements.
The Role of the Money Flow Index (MFI)
The Money Flow Index (MFI) serves as a valuable tool in confirming the direction of a breakout. Traders can utilize the MFI to gain additional insights into the strength of buying or selling pressure during a potential breakout. The MFI consists of a green line that represents the flow of money into the market. When this green line crosses above the middle line, it signals a bullish indication, suggesting that buying pressure is increasing. On the other hand, if the green line crosses below the middle line, it signifies a bearish signal, indicating that selling pressure is gaining strength.
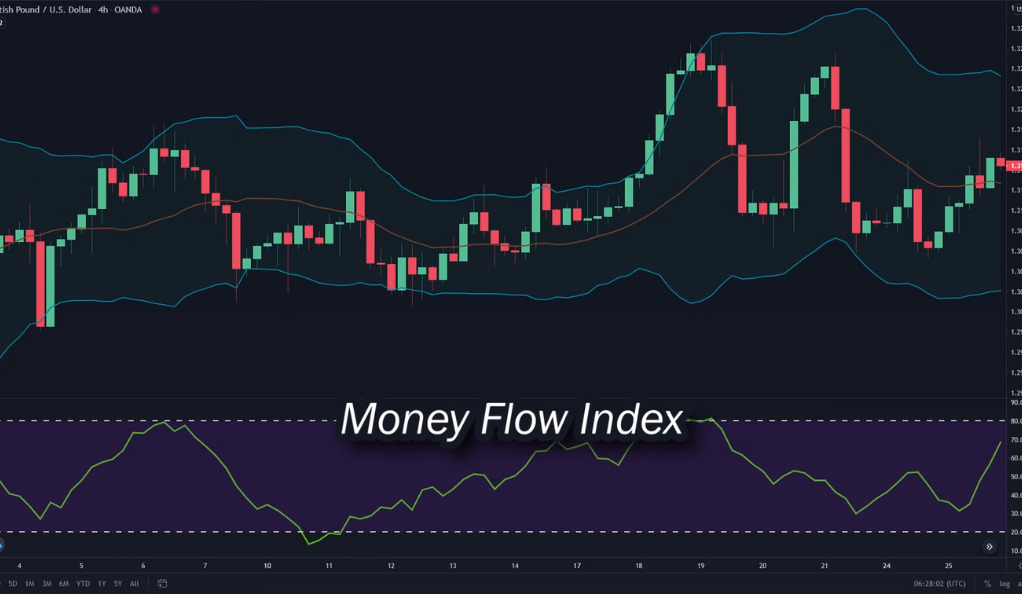
By incorporating the MFI into the analysis of a breakout, traders can enhance their confidence in the breakout direction. The MFI provides a quantitative measure of the market’s momentum and helps validate the anticipated bullish or bearish sentiment. This confirmation can be particularly useful when used in conjunction with other technical indicators and analysis techniques. Traders can evaluate the strength of the breakout based on the alignment of the MFI with the price action and the overall market conditions, allowing for more informed trading decisions.
The Exit Strategy: Maximizing Profits
Once you’ve entered a trade, let it run until a candle breaks out of the middle SMA line. If the candle breaks out, close your position. This strategy can help to maximize profits by allowing you to exit the trade at the right time.
Conclusion
Mastering the Bollinger Bands indicator can significantly enhance your trading strategy. By understanding how it works and avoiding common mistakes, you can use this tool to predict price breakouts and maximize profits. Remember, the key is to use the indicator as a guide, not a rule.
Ainu Token aims to offer impartial and trustworthy information on cryptocurrency, finance, trading, and shares. However, we don't provide financial advice and recommend users to conduct their own studies and thorough checks.
Comments (No)