In the world of financial trading, understanding the language of the markets is essential. This language is often communicated through charts, graphs, and most importantly, candlestick patterns. These patterns, born from centuries-old Japanese rice trading, have become a cornerstone of modern technical analysis. This article will delve deeper into the intricacies of price action candlestick patterns, focusing on the Engulfing Pattern, the Rejection Candle, and the Shrinking Candles Pattern. We’ll also explore how to implement an effective exit strategy using the Average True Range (ATR) indicator.
The Art of Reading Candlestick Patterns
Candlestick patterns are a form of technical analysis that traders use to predict future price movements. Each candlestick represents a specific time period and displays the opening, closing, high, and low prices during that period. The ‘body’ of the candlestick represents the range between the opening and closing prices, while the ‘wicks’ or ‘shadows’ show the high and low prices.
Understanding these patterns can provide valuable insights into market sentiment and potential reversals in price trends. However, it’s important to remember that no single pattern should be used in isolation. Instead, they should be used in conjunction with other indicators and price action methods for a more comprehensive trading strategy.
The Engulfing Pattern: A Tale of Market Reversal
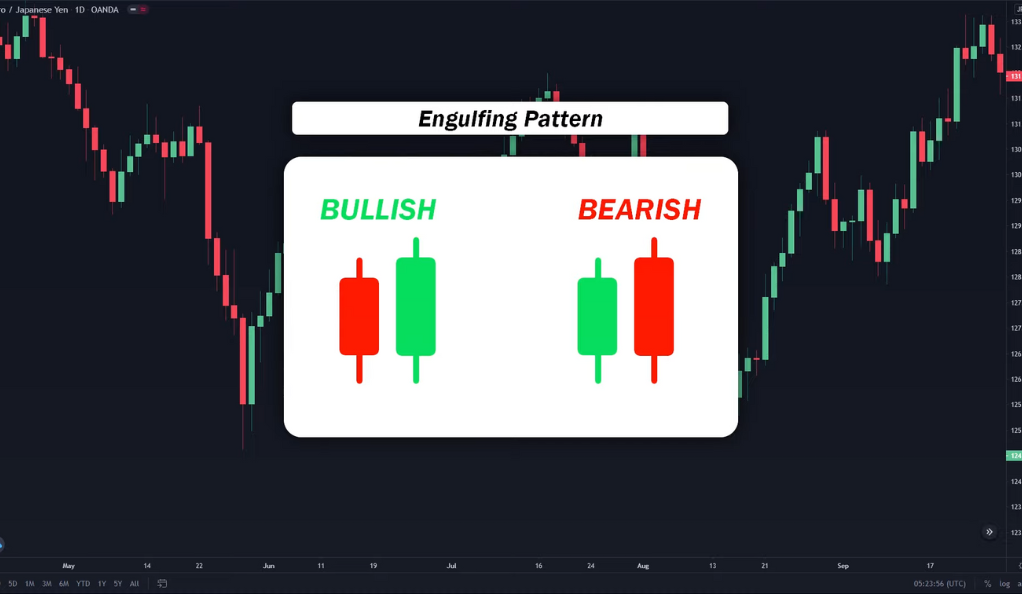
The Engulfing Pattern is a two-candle reversal pattern that appears at the end of an uptrend or a downtrend. It’s called ‘engulfing’ because the body of the second candle completely covers or ‘engulfs’ the body of the first one.
Bullish Engulfing Pattern: A Sign of Rising Prices
The bullish engulfing pattern is a significant candlestick pattern used in technical analysis to predict future price movements in financial markets. It is characterized by two candles: a smaller red candlestick followed by a larger green candlestick that completely engulfs the previous red one.
In terms of interpretation, the bullish engulfing pattern suggests a potential reversal from a downtrend to an uptrend. It is typically observed after a period of declining prices and is seen as a bullish signal by traders. The pattern indicates that buyers have gained control over the market, pushing prices higher and overpowering the selling pressure.
The significance of the bullish engulfing pattern is enhanced when it is supported by other technical indicators or a notable increase in trading volume. Traders often seek confirmation from other tools such as moving averages, trendlines, or oscillators to validate the pattern’s reliability.
The presence of a bullish engulfing pattern provides traders with a buying opportunity. It indicates that the market sentiment is shifting from bearish to bullish, and prices are likely to rise in the near future. This pattern is particularly appealing to those looking to enter long positions or close out existing short positions.
Bearish Engulfing Pattern: A Warning of Falling Prices
The bearish engulfing pattern is a candlestick pattern used in technical analysis to anticipate future price movements in financial markets. It is characterized by two candles: a smaller green candlestick followed by a larger red candlestick that engulfs the previous green one.
When interpreting the bearish engulfing pattern, it indicates a potential reversal from an uptrend to a downtrend. This pattern is often observed after a period of rising prices and is viewed as a bearish signal by traders. It suggests that sellers have gained control over the market, pushing prices lower and overpowering the buying pressure.
The significance of the bearish engulfing pattern increases when it is supported by other technical indicators or a significant increase in trading volume. Traders often seek confirmation from additional tools such as moving averages, trendlines, or oscillators to validate the pattern’s reliability.
The Rejection Candle Pattern: A Battle Between Buyers and Sellers
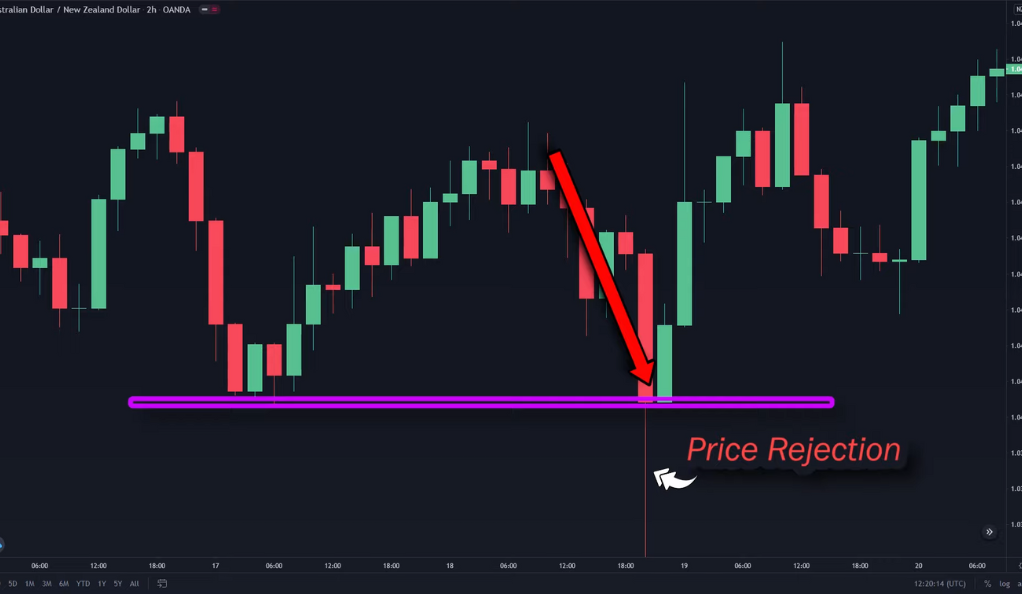
The Rejection Candle Pattern is a single candle pattern that shows a strong rejection of a certain price level. It’s characterized by a long wick on one side of the candle, indicating that the market has rejected higher or lower prices.
Buying Opportunity with Rejection Candle
The buying opportunity with rejection candle is a trading strategy used in technical analysis to identify potential buying opportunities in financial markets. This strategy involves recognizing a specific candlestick pattern known as the rejection candle, which can indicate a shift in market sentiment and the potential for price increases.
A rejection candle occurs when the market initially moves lower but quickly reverses and closes higher, forming a candlestick with a long lower wick and a small body. This pattern suggests that sellers attempted to push the price lower but were ultimately rejected by buyers, resulting in a reversal and a close near or above the opening price.
Selling Opportunity with Rejection Candle
The selling opportunity with rejection candle is a trading strategy used in technical analysis to identify potential selling opportunities in financial markets. This strategy revolves around recognizing a specific candlestick pattern called the rejection candle, which can indicate a shift in market sentiment and the potential for price decreases.
A rejection candle occurs when the market initially moves higher but quickly reverses and closes lower, forming a candlestick with a long upper wick and a small body. This pattern suggests that buyers attempted to push the price higher but were ultimately rejected by sellers, resulting in a reversal and a close near or below the opening price.
The selling opportunity with rejection candle strategy is particularly effective when the rejection candle forms at a resistance level. A resistance level is a price level where selling pressure overcomes buying interest, causing the price to stall or decline. When a rejection candle occurs at a resistance level, it suggests that sellers have successfully defended the resistance level and gained control of the market.
The Shrinking Candles Pattern: A Sign of Weakening Momentum
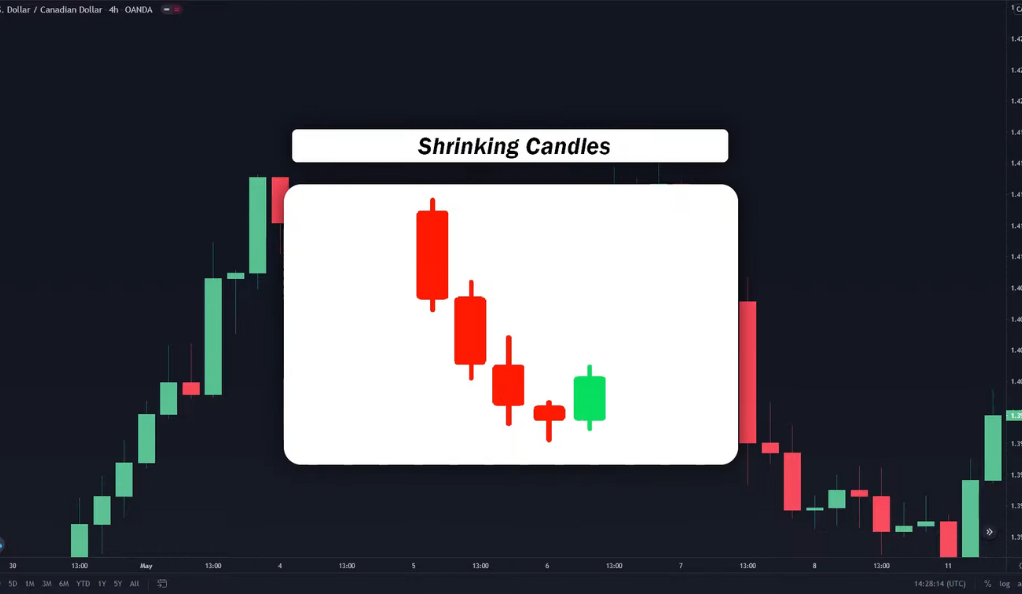
The Shrinking Candles Pattern is characterized by a series of candles that are gradually getting smaller. This pattern suggests a decrease in momentum and can signal a potential price reversal.
Selling Opportunity with Shrinking Candles
The selling opportunity with shrinking candles is a trading strategy used in technical analysis to identify potential selling opportunities in financial markets. This strategy involves recognizing a specific candlestick pattern characterized by a small candle with a long wick near a resistance level, followed by a subsequent big red candle. This pattern suggests a weakening upward momentum and indicates a potential price decline.
When a small candle with a long wick appears near a resistance level, it suggests that the buying pressure is unable to overcome the selling pressure at that level. The small candle body signifies indecision or lack of conviction among market participants, while the long wick indicates price rejection from the resistance level.
Buying Opportunity with Shrinking Candles
The buying opportunity with shrinking candles is a trading strategy used in technical analysis to identify potential buying opportunities in financial markets. This strategy involves recognizing a specific candlestick pattern characterized by a small candle with a long wick near a support level, followed by a subsequent big green candle. This pattern suggests a weakening downward momentum and indicates a potential price rise.
When a small candle with a long wick appears near a support level, it suggests that the selling pressure is unable to overcome the buying interest at that level. The small candle body signifies indecision or lack of conviction among market participants, while the long wick indicates price rejection from the support level.
Crafting an Effective Exit Strategy
While knowing when to enter a trade is important, knowing when to exit is equally, if not more, crucial. An effective exit strategy can help protect your profits and limit your losses.
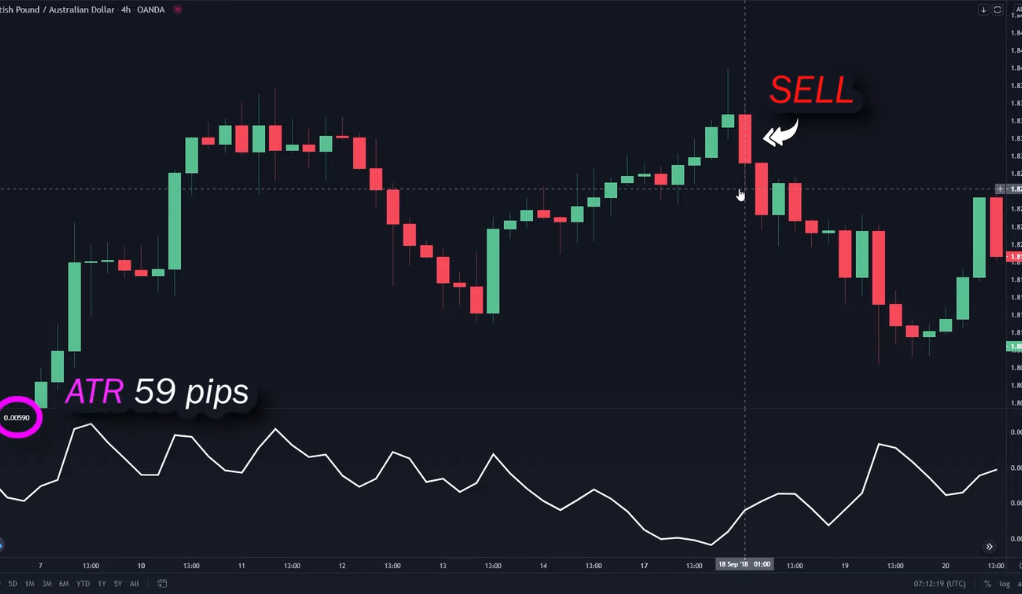
Using the ATR Indicator for Stop Loss Placement
The Average True Range (ATR) is a technical analysis indicator that measures market volatility. It can be used to set a stop loss level, which is a predetermined price at which a trader will sell a security to limit their loss.
The ATR value of the candle where you enter the trade is used to set the stop loss. For example, if you enter a trade at $100 and the ATR is $5, you might set your stop loss at $95 (for a long trade) or $105 (for a short trade).
Recognizing the Signs to Close the Position
Knowing when to close a position can be tricky. However, there are several signs that can indicate it’s time to exit. These include when the candles start getting smaller (indicating a loss of momentum), when the price movement goes flat, or when the price reverses direction. Another sign is when the price doesn’t show a clear trend anymore, suggesting that the market sentiment may be changing.
Conclusion
Mastering trading strategies using price action candlestick patterns can significantly enhance your trading performance. By understanding the Engulfing Pattern, the Rejection Candle, and the Shrinking Candles Pattern, you can gain valuable insights into market sentiment and potential price reversals. However, remember that these patterns should be used in conjunction with other indicators and price action methods for a more comprehensive trading strategy. And don’t forget the importance of an effective exit strategy to protect your profits and limit your losses.
Ainu Token aims to offer impartial and trustworthy information on cryptocurrency, finance, trading, and shares. However, we don't provide financial advice and recommend users to conduct their own studies and thorough checks.
Comments (No)