Trading in the financial markets is indeed a complex endeavor, requiring not only a keen understanding of market dynamics but also a deep knowledge of various strategies and tools. Traders, both novice and experienced, often rely on a range of tools to help them navigate the often turbulent waters of the financial markets. Among these tools, one that has gained significant popularity and is widely used across various market types, from forex to commodities, is the Fibonacci retracement.
The Fibonacci retracement tool is based on the Fibonacci number sequence, a mathematical sequence where each number is the sum of the two preceding ones. This sequence, while simple in its construction, has profound implications in various fields, including trading. In the context of trading, Fibonacci retracements are used to identify potential reversal points in the market, providing traders with insights into when a current trend may reverse. This tool, therefore, plays a crucial role in helping traders anticipate market movements, enabling them to strategize their trades accordingly. This article aims to delve deeper into the concept of Fibonacci retracements, offering a comprehensive understanding of how to use them effectively and their significance in the realm of trading.
The Fibonacci Sequence and Its Application in Trading
Before we dive into Fibonacci retracements, it’s essential to understand the Fibonacci sequence. This sequence is a series of numbers where each number is the sum of the two preceding ones, starting from 0 and 1. So, the sequence goes 0, 1, 1, 2, 3, 5, 8, 13, 21, and so on. This sequence is not just a mathematical curiosity; it appears in various aspects of the universe, from the arrangement of leaves on a stem to the spiral of galaxies.
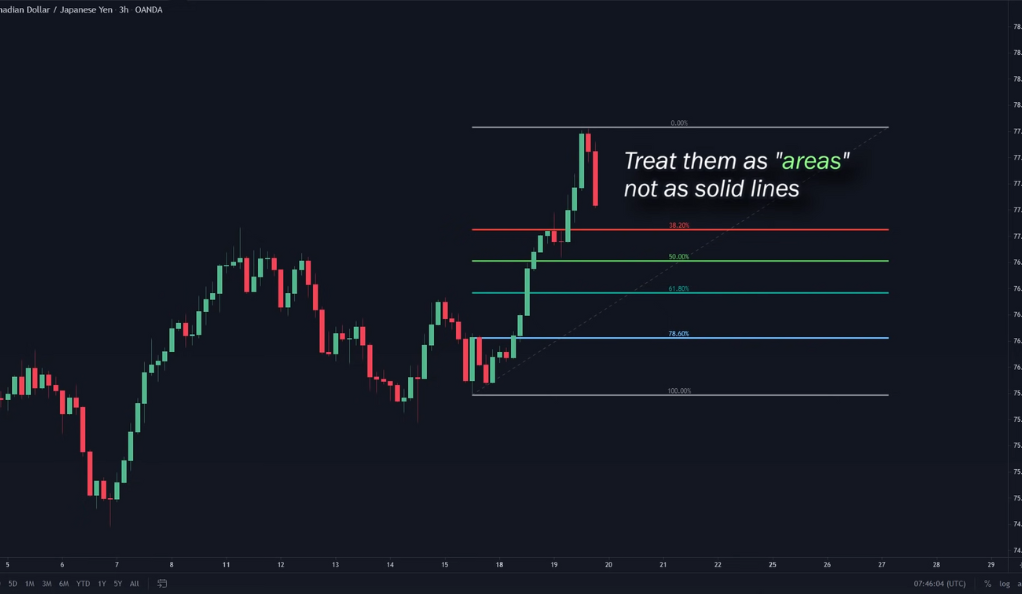
In trading, the Fibonacci sequence is used to create technical indicators, one of which is the Fibonacci retracement. These retracements are used to identify potential levels of support and resistance in the market. These key levels help traders identify the end of a pullback in a market trend, essentially providing a way to anticipate and strategize around the market’s ebb and flow. The Fibonacci retracement tool generates these levels, which are treated as areas rather than solid lines.
Key Fibonacci Levels
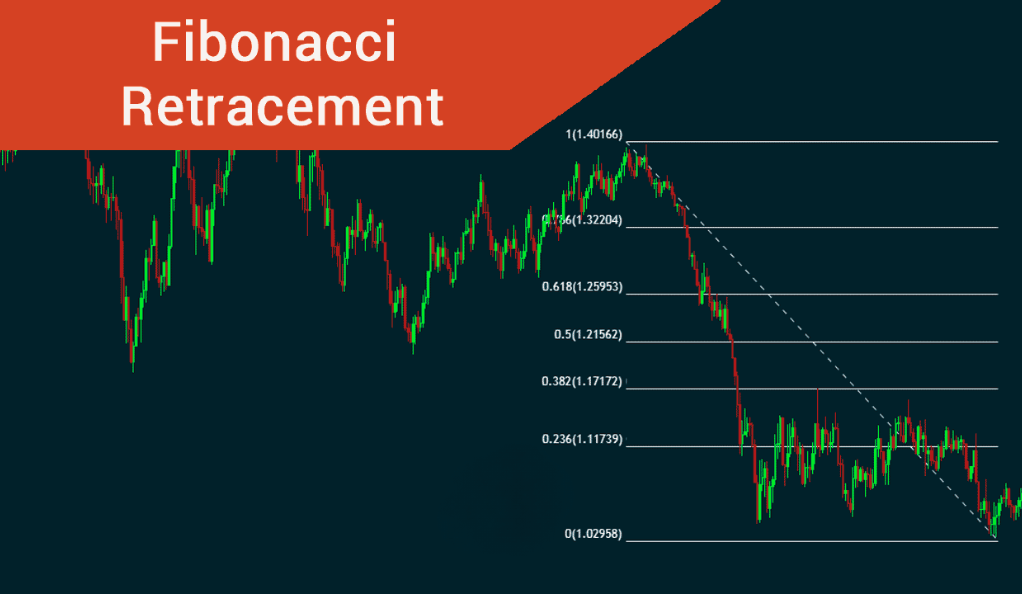
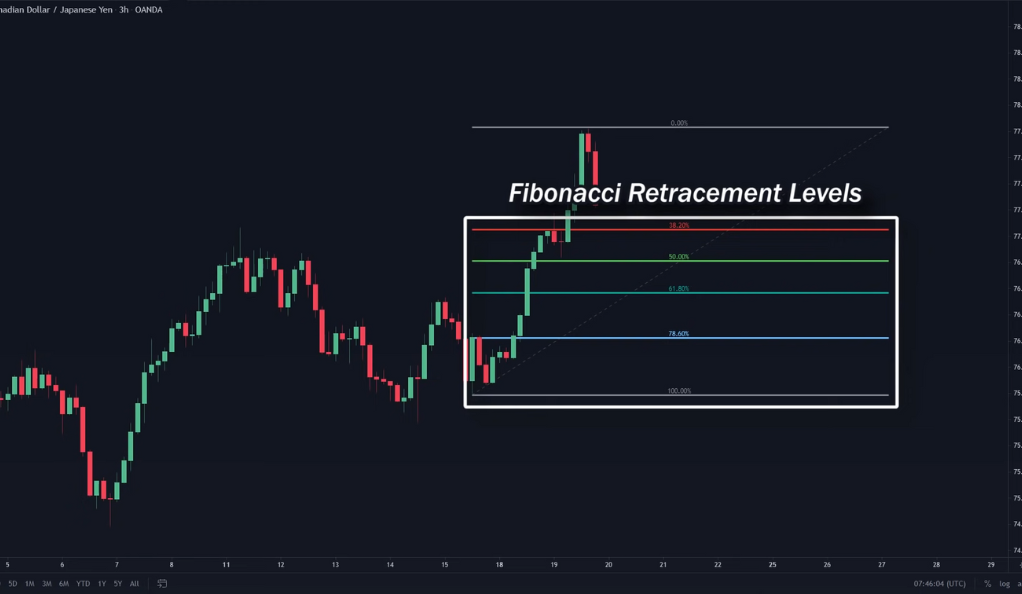
The Fibonacci retracement tool is a powerful instrument in a trader’s toolbox, providing key insights into potential price movements. It identifies several key levels, namely 38.2%, 50%, and 61.8%. These levels, often referred to as the “golden zone” in trading, represent the most common areas where the price may pull back during a trend. The concept of the “golden zone” comes from the Fibonacci sequence, where the ratio between any number and the next higher number approaches 0.618, and the ratio between a number and the next lower number approaches 1.618 as the numbers increase. These ratios are considered “golden” due to their frequent occurrence in nature and their application in various fields, including trading.
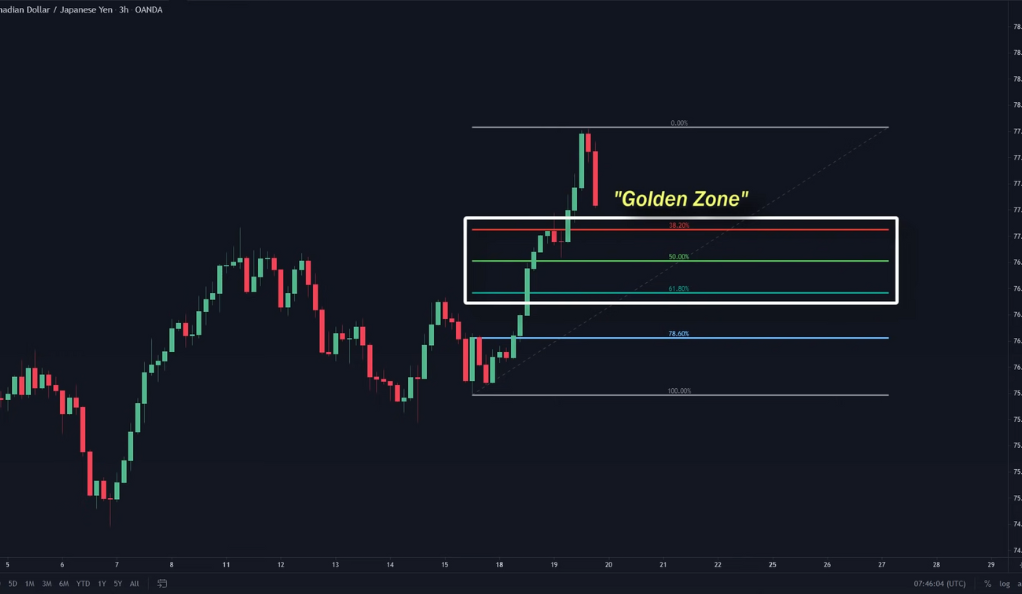
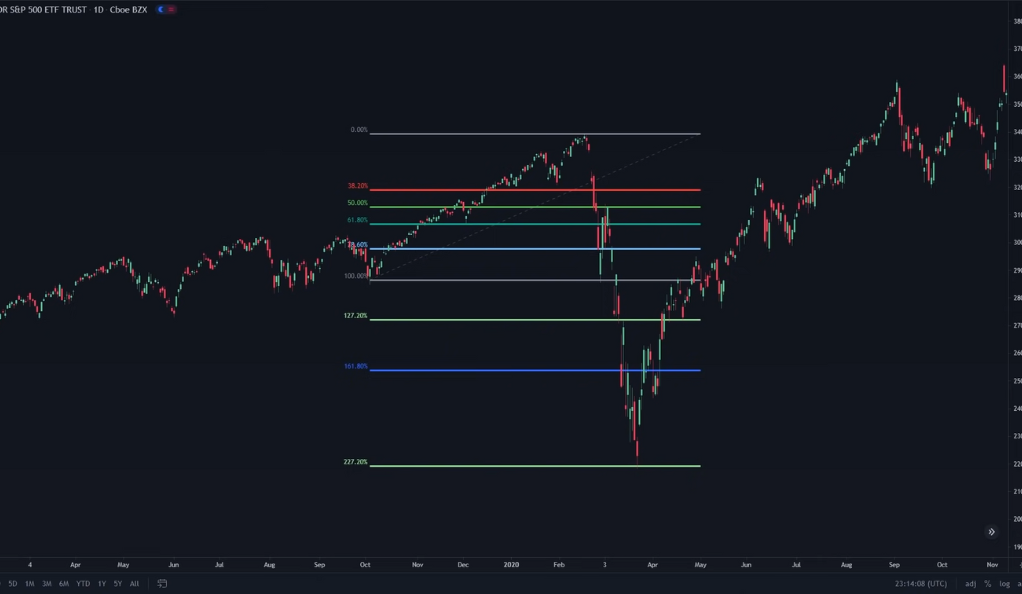
However, it’s important to note that these levels are not absolute barriers that the price cannot cross. In fact, the price can and often does break through these levels, moving towards deeper levels like 78.6% and 100%. The 100% level is particularly significant as it is the maximum level where the price can still be considered as a pullback. If the price moves below this level, it indicates a potential shift from a pullback to a downtrend. This understanding is crucial for traders as it helps them adjust their strategies accordingly. For instance, if a trader sees the price breaking through the 100% level, they might consider closing their long positions and opening short positions, anticipating a potential downtrend. Thus, understanding these key Fibonacci levels and how to interpret them can significantly enhance a trader’s ability to navigate the market effectively.
Using the Fibonacci Retracement Tool
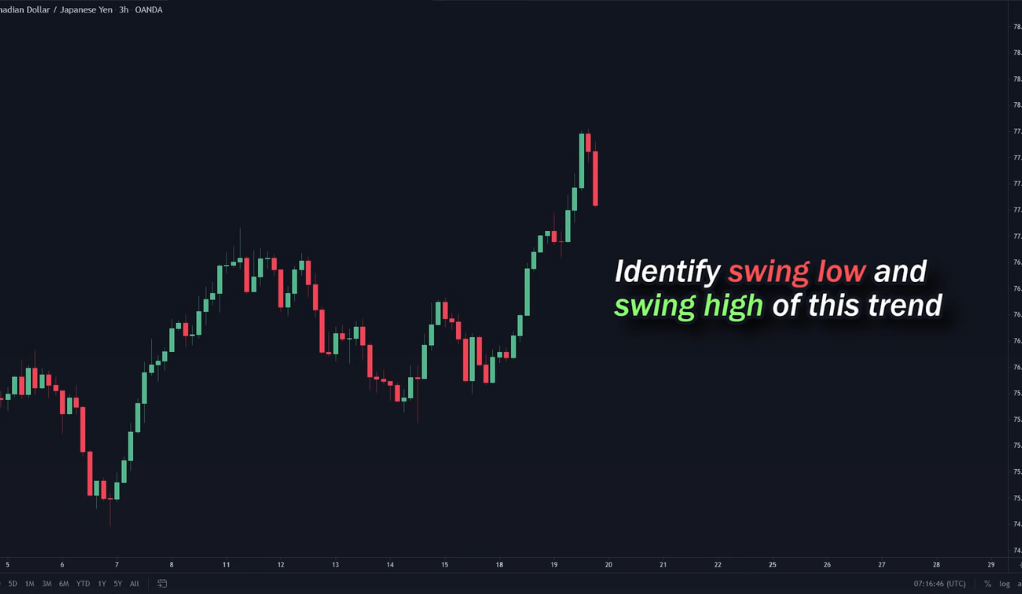
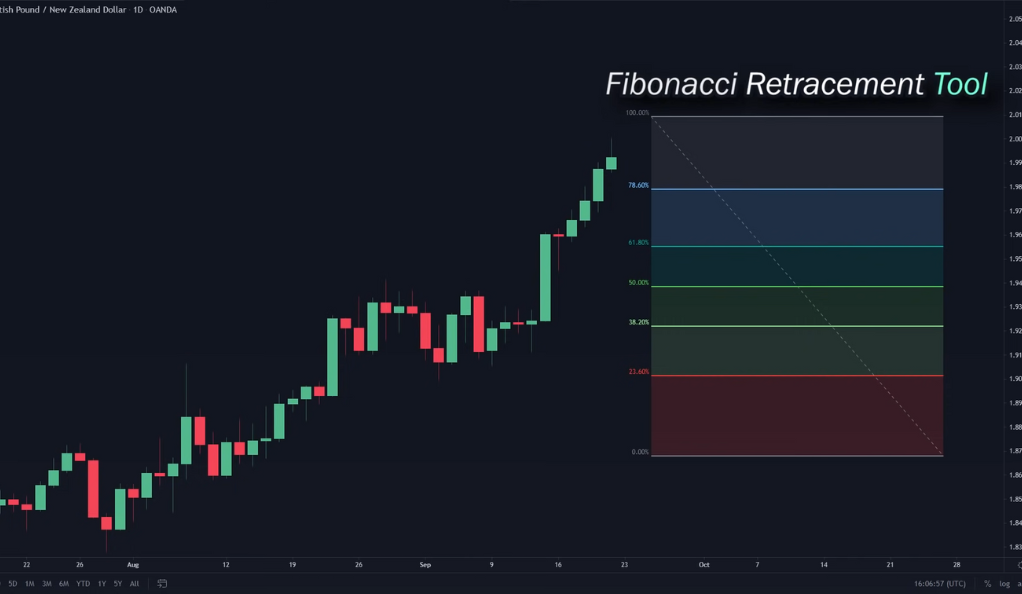
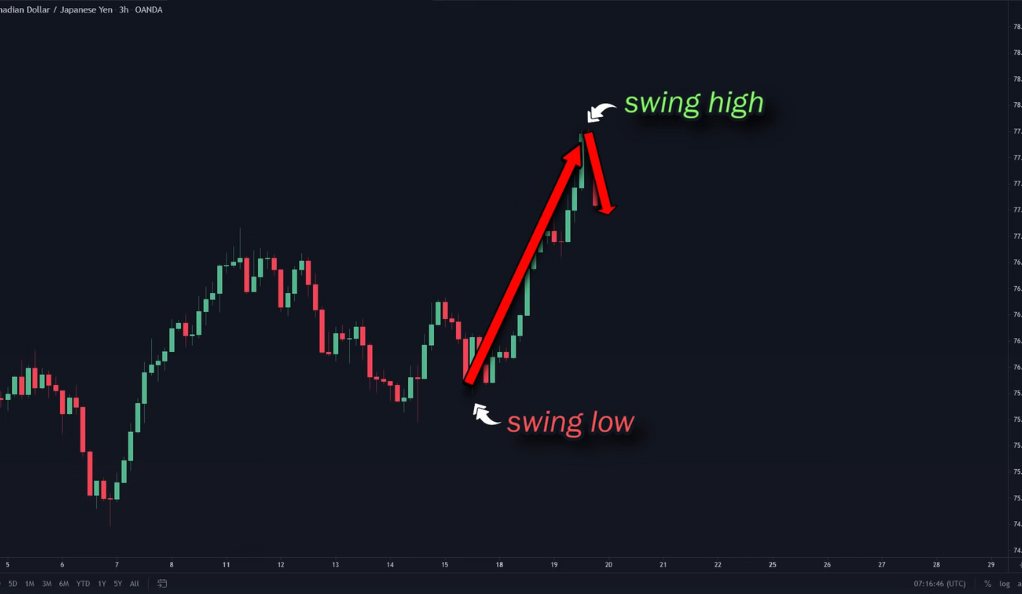
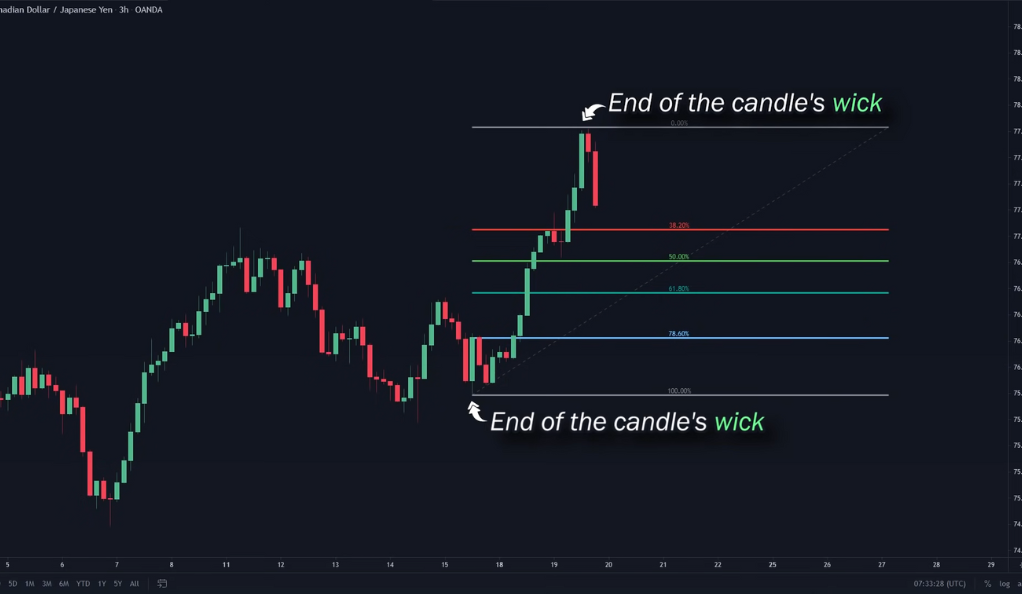
The Fibonacci retracement tool is a powerful instrument in the world of trading, but to use it effectively, traders need to understand its mechanics and nuances. The first step in using the Fibonacci retracement tool is to identify the swing low and swing high of a trend. The swing low is the lowest point the price reached before reversing upwards, while the swing high is the highest point the price reached before reversing downwards. Identifying these points accurately is crucial as they form the basis for drawing the Fibonacci retracement levels.
Once the swing low and swing high are identified, the Fibonacci retracement tool is drawn by connecting these two points. This simple act generates the Fibonacci levels, which are percentages of the total move from the swing low to the swing high. These levels, namely 38.2%, 50%, and 61.8%, represent potential areas where the price might reverse or at least slow down. Traders can use these levels to anticipate potential price movements and plan their trades accordingly.
However, it’s important to remember that these Fibonacci levels are not definitive barriers but potential areas of interest. They should not be used in isolation but should be combined with other technical analysis tools and indicators for a more comprehensive trading strategy. For instance, if a Fibonacci level coincides with a long-term support or resistance level, it strengthens the significance of that level. Similarly, if a Fibonacci level aligns with a key moving average, it adds weight to that level. By combining the Fibonacci retracement tool with other technical analysis tools, traders can increase their chances of successful trades, enhancing their overall trading strategy.
In the second step, traders need to understand that the Fibonacci retracement tool is not a standalone tool. It’s a part of a broader technical analysis framework and should be used in conjunction with other technical analysis tools and indicators. For instance, traders can use trend lines, moving averages, or momentum indicators alongside the Fibonacci retracement tool to validate the potential reversal points and strengthen their trading decisions.
Moreover, traders should also consider the broader market context when using the Fibonacci retracement tool. For instance, in a strong uptrend, the price might not retrace to the deeper Fibonacci levels and might bounce off the 38.2% or 50% level. On the other hand, in a weak uptrend or range-bound market, the price might retrace to the 61.8% level or even the 78.6% level. Therefore, understanding the market context can help traders use the Fibonacci retracement tool more effectively.
Identifying Trade Opportunities
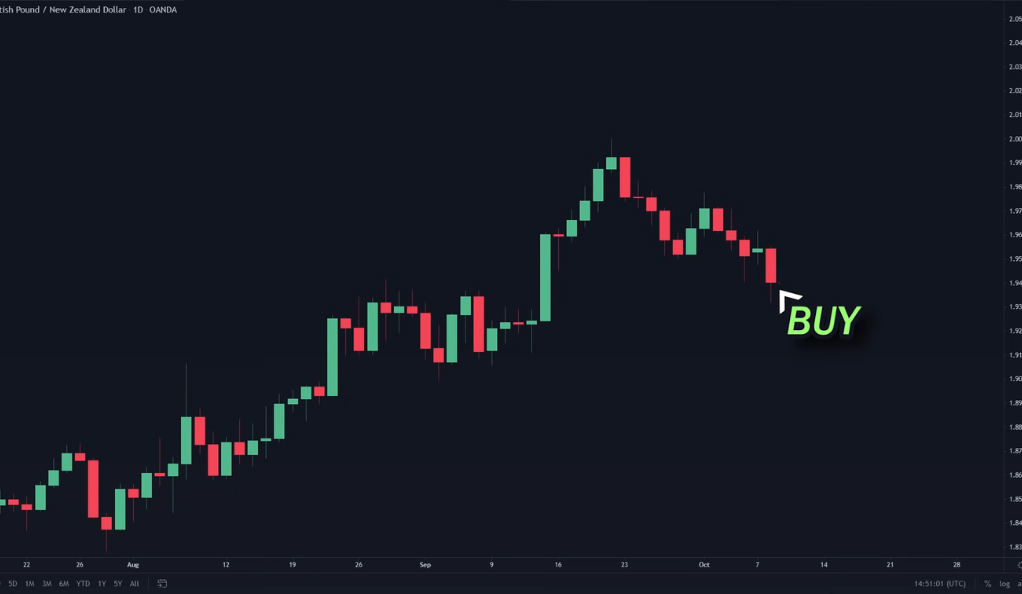
Identifying trade opportunities using Fibonacci retracements involves a keen observation of the price action. Traders need to wait for the price to react to one of the Fibonacci levels. For instance, a bullish engulfing pattern, where the second candle’s body completely covers the previous candle, can indicate upward momentum.
However, it’s crucial to wait for confirmation before entering a position. This is because the price can react to a level but still break through it. Therefore, traders need to look for signs of momentum in the price action to confirm the potential trade. This could be in the form of candlestick patterns, volume analysis, or other technical indicators.
Combining Fibonacci Levels with Support and Resistance
Fibonacci retracements can be combined with existing support and resistance levels to create an area of confluence. This area of confluence increases the likelihood of the price bouncing at this level, providing a more reliable trading signal.
For instance, if a Fibonacci retracement level coincides with a long-term support or resistance level, it strengthens the significance of that level. Traders can use this confluence to their advantage by placing trades around these levels with a higher degree of confidence.
Bearish Fibonacci Retracement
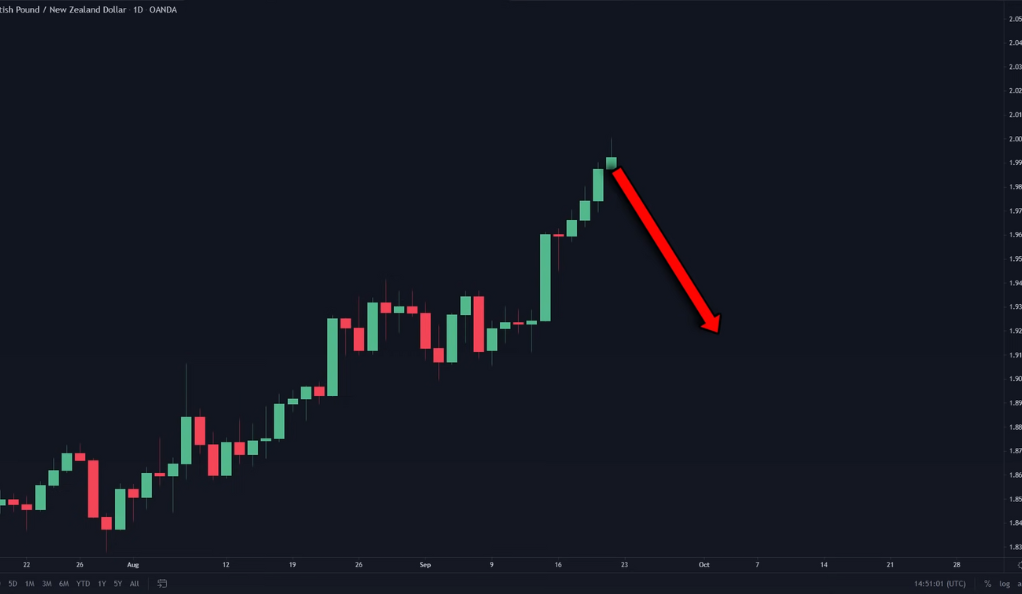
In the world of trading, understanding market trends is crucial, and the Fibonacci retracement tool is a valuable ally in this endeavor. Specifically, in a bearish trend, where the market is dominated by sellers and prices are falling, the Fibonacci retracement tool is applied in a slightly different manner. Instead of drawing it from the swing low to the swing high as in a bullish trend, it is applied from the swing high to the swing low. This reversal in application aligns with the direction of the trend, providing traders with key levels where the price might find resistance on its downward journey.
Once the Fibonacci levels are drawn, traders then wait for the price to react to one of these levels. This reaction can provide an opportunity to enter a short position, profiting from the continued downward movement of the price. However, it’s important to note that these levels are not definitive barriers but potential areas of interest. Hence, traders look for signs of downward momentum, such as increased selling volume or bearish candlestick patterns, to confirm the likelihood of the price continuing its descent.
Just as in a bullish trend, patience and confirmation are key in a bearish trend. Jumping the gun and entering a trade prematurely can lead to unnecessary losses. Therefore, traders need to wait for confirmation before entering a trade. This confirmation could come in the form of bearish candlestick patterns, such as a bearish engulfing or shooting star, or other technical indicators that suggest a continuation of the downtrend, such as a bearish crossover in moving averages or increased momentum on the downside. By combining the Fibonacci retracement tool with these other technical analysis tools, traders can increase their chances of successful trades, even in a bearish market.
Conclusion
Fibonacci retracements are a powerful tool in a trader’s arsenal. They provide key levels of potential support and resistance, helping traders identify high-probability trade opportunities. However, like any trading tool, they should be used in conjunction with other indicators and strategies to increase their effectiveness.
By understanding and applying Fibonacci retracements correctly, traders can enhance their trading strategy and potentially increase their profitability in the markets. It’s a testament to the power of mathematics and its application in understanding the financial markets. As with all trading strategies, it’s important to practice risk management and never risk more than you can afford to lose.
Ainu Token aims to offer impartial and trustworthy information on cryptocurrency, finance, trading, and shares. However, we don't provide financial advice and recommend users to conduct their own studies and thorough checks.
Comments (No)