In the dynamic world of trading, the ability to make informed decisions is paramount. Among the plethora of tools available to traders, the Volume Weighted Average Price, or VWAP, stands out due to its unique ability to provide a more accurate average trading price for a security. This powerful tool takes into account the volume of securities traded, as well as the price at which they are traded, to give traders a more comprehensive view of the market. The VWAP is particularly useful for passive traders and is one of the few indicators that are widely used by mutual funds and pension funds.
This comprehensive guide aims to demystify the VWAP indicator, providing a deep dive into its intricacies and applications. The VWAP can be a game-changer in a trader’s arsenal, helping to identify whether a security is being traded at a value above or below its average, thus informing buying or selling decisions. Furthermore, the guide will explore how to maximize the potential of the VWAP in your trading strategies. This includes understanding how to read and interpret the VWAP lines, and how to combine the VWAP with other indicators to enhance its effectiveness and refine your trading strategies.
Understanding the VWAP Indicator
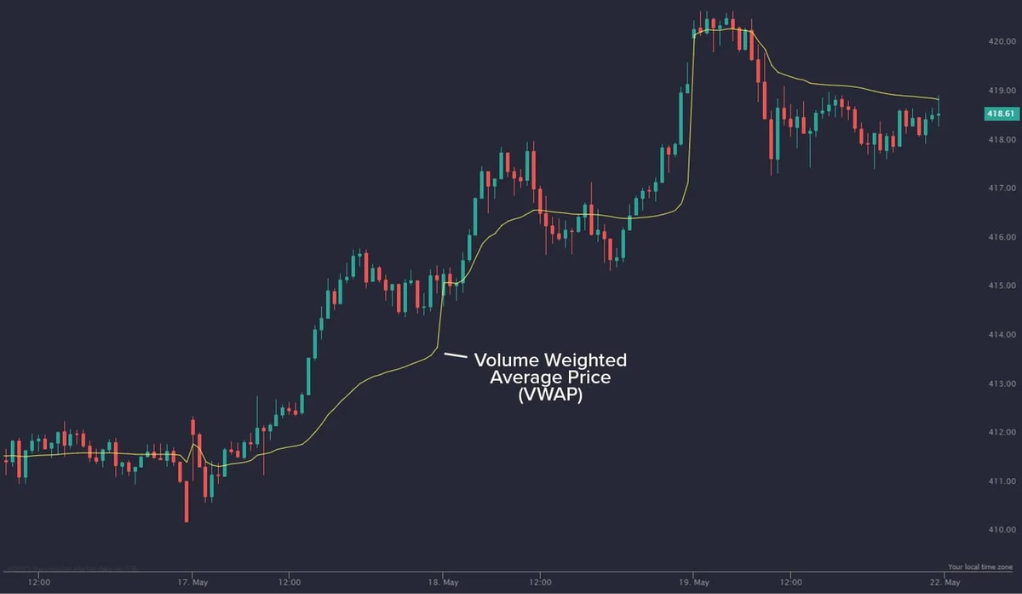
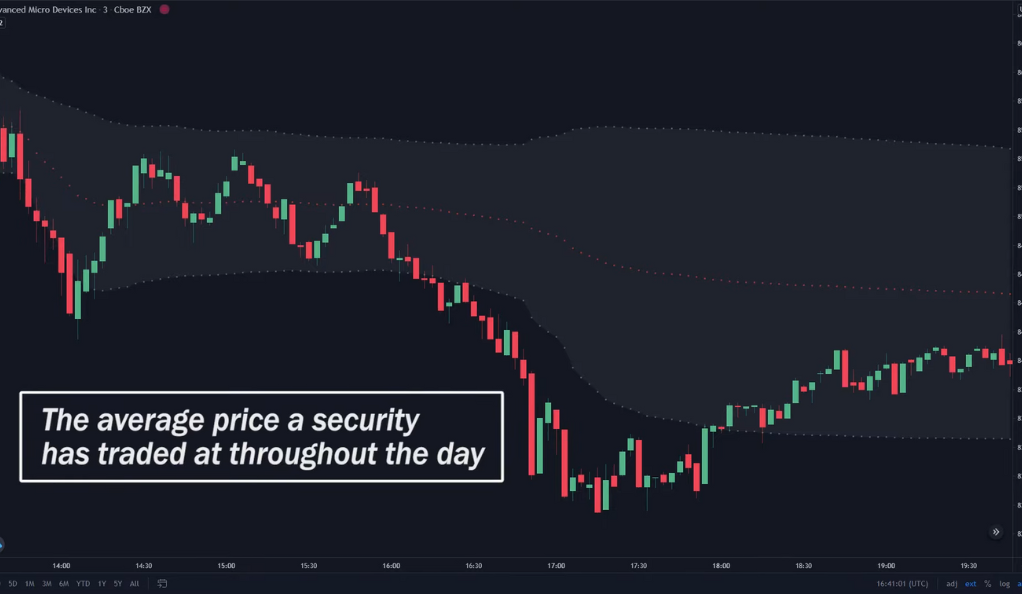
The Volume Weighted Average Price, or VWAP, is a critical tool in the arsenal of many traders and investors. As a trend confirmation indicator, it provides a more nuanced understanding of market dynamics by calculating the average price at which a security has traded throughout the day. But it doesn’t stop there. The VWAP takes into account both the volume of securities traded and the price at which they are traded, offering a more comprehensive view of the market. This dual consideration of volume and price allows traders to gain a more accurate picture of the market’s behavior, enabling them to make more informed decisions.
Interestingly, the VWAP is not just for active day traders. It’s also a favorite among those who prefer a more passive approach to their trading or investing strategy. Mutual funds and pension funds, which typically aim for minimal impact on the market with their large orders, often use the VWAP to guide their execution. By using the VWAP, these large institutional investors can ensure that their trades align with the market’s volume, thus avoiding causing drastic price changes. This widespread use of the VWAP among different types of investors underscores its versatility and effectiveness as a trading tool.
The Significance of VWAP in Trading
The Volume Weighted Average Price (VWAP) holds a significant place in the world of trading. It serves as a benchmark that traders use to determine if a security is being traded at a value above or below its average price. This information is crucial as it can influence a trader’s decision to buy or sell a security. For instance, if a security’s price is above the VWAP line, it indicates a bullish trend, suggesting that it might be a good time to sell. Conversely, if the price is below the VWAP line, it signifies a bearish trend, indicating that it might be an opportune time to buy.
The VWAP is particularly useful for analyzing intraday prices, which are time frames that are less than a day, such as the one-minute, three-minute, or hourly chart. Intraday trading involves making numerous trades within a single trading day, and the VWAP can provide valuable insights into the market’s direction during this period. By providing a clear picture of the market trend within the day, the VWAP allows traders to make more informed and timely decisions, enhancing their trading strategies and potentially increasing their profits.
Decoding the VWAP Lines
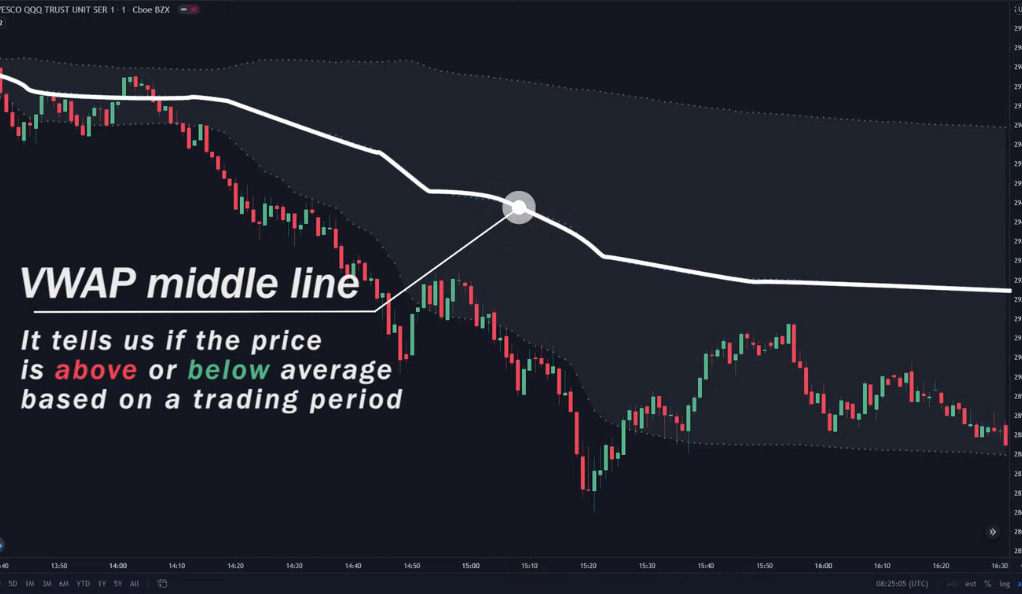
The VWAP indicator is composed of three distinct lines, each serving a unique purpose in the analysis of market trends. The middle line, known as the normal VWAP line, acts as a baseline to determine whether a security’s price is trading above or below its average price. This line is crucial as it provides a benchmark against which the price of the security is compared, offering traders a clear picture of the security’s performance relative to its average.
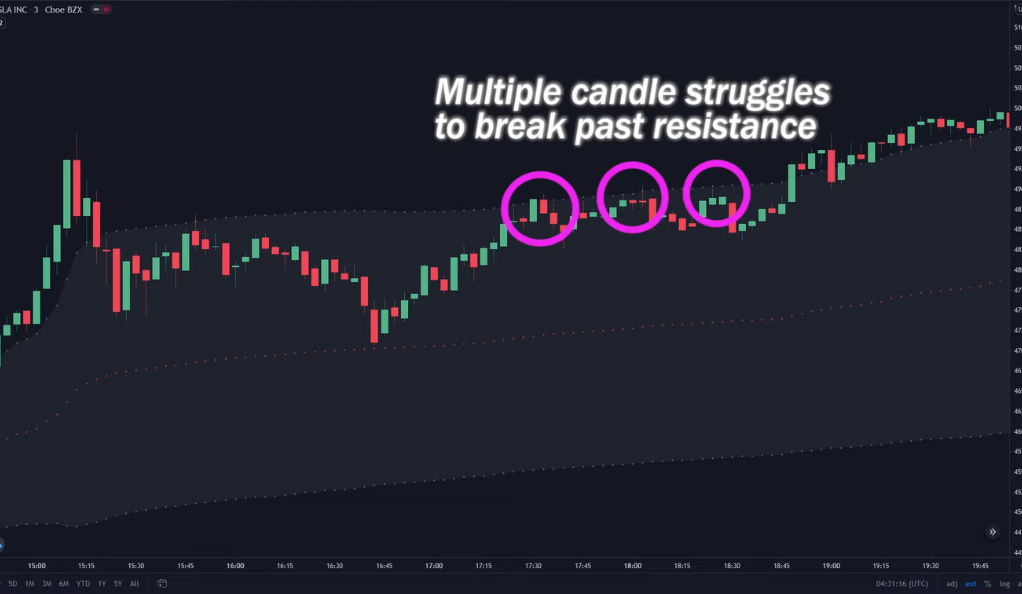
The top line, referred to as the 75% line, plays a significant role in identifying uptrends. If a security’s price consistently pushes above this line and causes the indicator to turn upwards, it signifies that the price is on an uptrend. This information can be invaluable to traders, as it can indicate a potential opportunity to sell or short sell the security for profit.
Conversely, the line below, known as the 25% line, is instrumental in spotting downtrends. If a security’s price constantly breaks past below this line, it suggests that the price is on a downtrend. This can signal to traders that it might be an opportune time to buy the security or cover a short position. By understanding and interpreting these three lines, traders can gain a more nuanced understanding of market trends and make more informed trading decisions.
Combining VWAP with Other Indicators
The VWAP, while powerful on its own, can be combined with other indicators to enhance its effectiveness and provide a more comprehensive view of market trends. This combination approach can help traders make more informed decisions by providing additional layers of analysis. For instance, the VWAP can be used in conjunction with the Relative Strength Index (RSI), a momentum oscillator that measures the speed and change of price movements. The RSI is typically used to identify overbought or oversold conditions in a market.
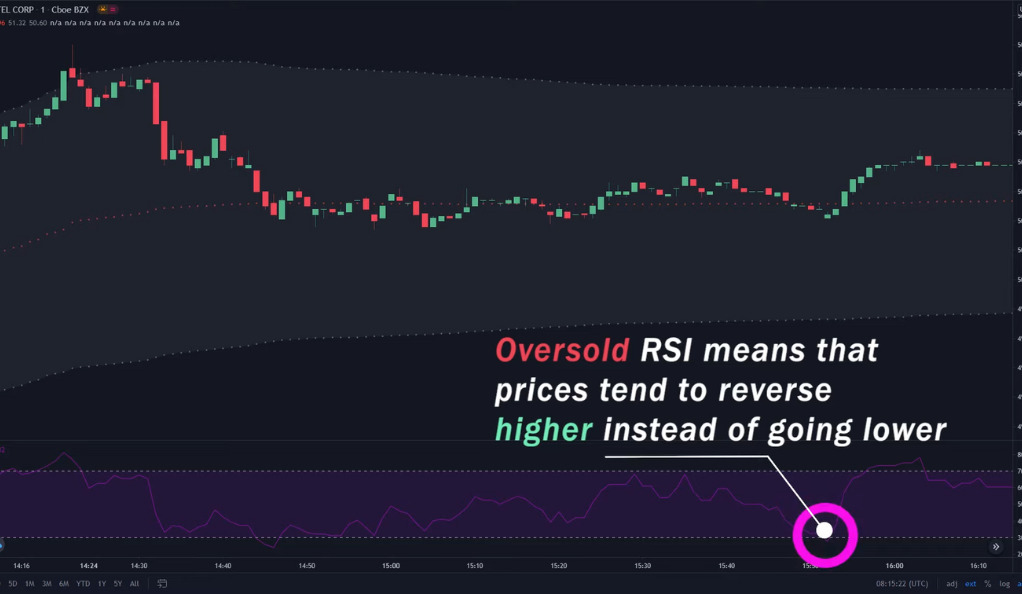
When used together, the VWAP and RSI can provide valuable insights into potential breakouts. For instance, if the VWAP indicates an uptrend and the RSI is in an oversold condition, it could suggest a potential upward breakout. Conversely, if the VWAP shows a downtrend and the RSI is in an overbought condition, it could indicate a potential downward breakout. This combination of indicators can provide a more nuanced view of market conditions, helping traders to identify potential trading opportunities more accurately.
Moreover, combining the VWAP with other indicators is not limited to the RSI. Traders can experiment with various combinations to find what works best for their trading style and strategy. Other popular indicators that can be used with the VWAP include the Moving Average Convergence Divergence (MACD), Bollinger Bands, and the Stochastic Oscillator. Each combination offers a unique perspective on market trends, allowing traders to tailor their approach to suit their individual trading goals and risk tolerance.
Learning from Trading Mistakes
The importance of learning from trading mistakes and continuously improving your trading strategies. It also encourages the use of multiple resources for learning and practicing trading. Remember, no trader is perfect, and everyone makes mistakes. The key is to learn from these mistakes and use them as stepping stones to improve your trading strategies.
The Power of Practice
Mastering the use of the VWAP indicator requires time and practice. It’s not something that you can learn overnight. It requires a deep understanding of the market trends and a keen eye for details. The more you practice using the VWAP indicator, the better you will get at it.
Conclusion
In the realm of trading, the Volume Weighted Average Price (VWAP) indicator emerges as a potent tool. It plays a pivotal role in defining support and resistance levels, which are crucial for determining entry and exit points in trading. When the VWAP is paired with another indicator, such as the Relative Strength Index (RSI), it can provide a more comprehensive and nuanced view of market trends. This combination can help traders identify potential trading opportunities and make more informed decisions.
However, like any tool in trading, mastering the use of the VWAP indicator requires time, patience, and practice. It’s not something that can be understood overnight. Traders need to spend time analyzing the VWAP lines, understanding their implications, and observing how they interact with the price movements of securities. Practice is key here. The more a trader uses the VWAP in their trading, the more familiar they become with its nuances and the better they can leverage its insights.
In conclusion, the journey of mastering the VWAP indicator is one of continuous learning and improvement. Trading is a dynamic field, and there’s always something new to learn, a new strategy to try, or a new trend to understand. So, keep practicing, keep learning, and keep refining your trading strategies. Remember, every step you take in learning more about indicators like the VWAP brings you one step closer to becoming a more proficient and successful trader.
Ainu Token aims to offer impartial and trustworthy information on cryptocurrency, finance, trading, and shares. However, we don't provide financial advice and recommend users to conduct their own studies and thorough checks.
Comments (No)