Investing, as an activity, is akin to navigating a labyrinth. The unpredictable twists and turns can either lead to a triumphant exit or a confounding dead-end. In the tech stock trading world, volatility takes this complexity up several notches. This article delves into this thrilling realm, where nothing seems as it is, and the line between risk and reward is often blurred. Here, we’ll dissect recent market trends such as ‘AI Mania,’ the ongoing tug-of-war between reinflation and recession, and even the intriguing phenomenon of inverted charts. So, buckle up for an exploratory ride into the exhilarating roller-coaster that is the tech stock market!
Contents
- 1 Deciphering Inverted Charts
- 2 Market Sentiment: The Emotional Seesaw
- 3 Reinflation vs Recession: The Big Economic Debate
- 4 The Tech Sector and Bubble Theory
- 5 To Chase or To Hunt: The Investing Dilemma
- 6 AI Mania: The Latest Investment Frenzy
- 7 The Tug of War: Smart Money vs Dumb Money
- 8 The Chasing Mentality: A Critique
- 9 Learning from Past Market Manias
- 10 The Nvidia Example: A Lesson in Investing
- 11 Conclusion
Deciphering Inverted Charts
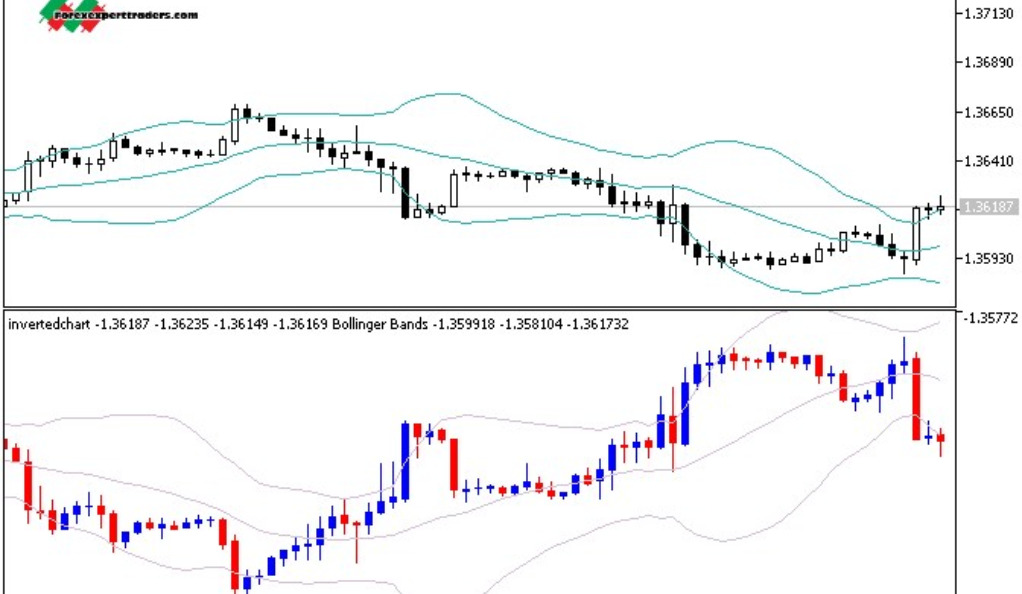
Visual aids often play a crucial role in comprehension. In the world of finance, charts, like maps, guide investors through the sprawling landscape of stock markets. One such aid is the inverted chart. Imagine looking at a picture but seeing its reflection in a mirror. That’s precisely what an inverted chart is – a conventional stock chart turned upside down. It’s a unique tool that, although counterintuitive, often aids investors in periods of high volatility.
Inverting a chart can help overcome cognitive biases, especially during market downturns. We often let fear and pessimism cloud our judgement, making us overlook potential opportunities. An inverted chart, by making a downtrend appear as an uptrend, can inject optimism and encourage a second look at an otherwise discouraging scenario. It’s like re-reading a difficult book; you might find that the plot unravels itself the second time around.
Market Sentiment: The Emotional Seesaw
Emotions and investing are intertwined. It’s crucial to understand the concept of market sentiment, which essentially is the collective emotion of all market participants. The market sentiment often acts as a barometer of the market’s mood – bullish or bearish.
At market bottoms, fear rules the roost. Investors dread that prices will fall further and lead to massive losses. It’s similar to standing at the edge of a cliff, wondering how far down the drop might be. On the other hand, market tops are dominated by euphoria. Investors grow optimistic and believe that prices will keep soaring. It’s like being on a winning streak in a casino; the chips seem to keep piling up until they don’t.
This emotional swing often drives irrational buying and selling decisions, turning the stock market into a kind of emotional seesaw. Market sentiment analysis can thus serve as a counterweight to this emotional sway, helping investors make more rational decisions.
Reinflation vs Recession: The Big Economic Debate
Stepping away from the stock charts and into the broader economic scene, one encounters a raging debate. The bone of contention here is the risk of reinflation versus recession. It’s akin to a duel, where the outcome influences not just the participants but spectators as well – in this case, the investors.
Reinflation implies an increase in inflation rates following a period of low inflation. It’s like a parched desert receiving a sudden downpour. While the rainfall is necessary, too much of it can lead to flooding. Similarly, reinflation can stimulate economic growth but can also lead to an overheated economy. On the other hand, a recession is a period of economic decline. It’s like a long, harsh winter where resources are scanty, and survival becomes a challenge.
These contrasting economic scenarios create a unique weather system in the stock market. The interpretation of economic data, such as employment figures or GDP growth, is heavily influenced by this reinflation vs recession debate. It dictates investment strategies and drives market trends, making it a crucial factor in understanding the tech stock market’s volatility.
The Tech Sector and Bubble Theory
One can’t discuss tech stocks without addressing the proverbial elephant in the room – the Bubble Theory. A ‘bubble’ refers to a situation where asset prices inflate rapidly, far beyond their intrinsic value, only to crash abruptly. It’s like a soap bubble – captivating while it lasts, but destined to pop eventually.
The tech sector seems to be encapsulated in such a bubble. It’s witnessing rapid price increases driven by inflated multiples rather than concrete fundamentals, such as cash flows or earnings. Investors, buoyed by the sector’s potential, seem to disregard its sky-high valuations. It’s akin to betting all your chips on a single, high-stakes round of poker, ignoring the potential pitfalls.
We’ve been here before, with the Dot-com bubble of the late 90s serving as a poignant reminder. Thus, it’s crucial for investors to assess the tech sector through the lens of bubble theory, understanding that while the ride up can be exhilarating, the fall can be equally devastating.
To Chase or To Hunt: The Investing Dilemma
Navigating the stock market often presents investors with a key question: should one chase performance in high-flying sectors or hunt for bargains in those lagging behind? This is a strategic decision that every investor grapples with, a classic showdown between ambition and caution.
Chasing performance is akin to following the herd. If a sector is performing well, the natural instinct is to invest and reap the benefits of its success. It’s like joining a party at its peak, where the music is loud, and everyone seems to be having a great time. But the risk here is that the party may be close to ending, leaving latecomers with the hangover of a market correction or crash.
Bargain hunting, on the other hand, is a more patient, calculated approach. It involves finding undervalued stocks that have the potential to grow. This strategy is like scouring a thrift shop for hidden treasures. While it requires time and effort, the payoff can be substantial if the stocks eventually appreciate.
It’s worth noting that neither strategy is inherently superior; the choice largely depends on the investor’s risk tolerance, investment goals, and market outlook.
AI Mania: The Latest Investment Frenzy
The stock market often witnesses trends or fads that grip investors. The latest to join this list is ‘AI Mania’. Artificial Intelligence has been making waves in multiple sectors, from healthcare to finance, making AI-related stocks the new darling of investors.
However, there’s a potential pitfall here. Whenever a particular sector or technology garners excessive attention, there’s a risk of a bubble. AI Mania, while fuelled by the undeniable potential of AI, can lead to overvaluation of AI stocks. It’s like the frenzy at a limited-time sale; while the rush can be intoxicating, not everything bought in a hurry is worth its price.
While riding the AI wave can be profitable, it’s crucial for investors to evaluate AI companies based on their fundamentals, such as revenue growth, profitability, and competitive advantage, rather than getting swept up in the mania.
The Tug of War: Smart Money vs Dumb Money
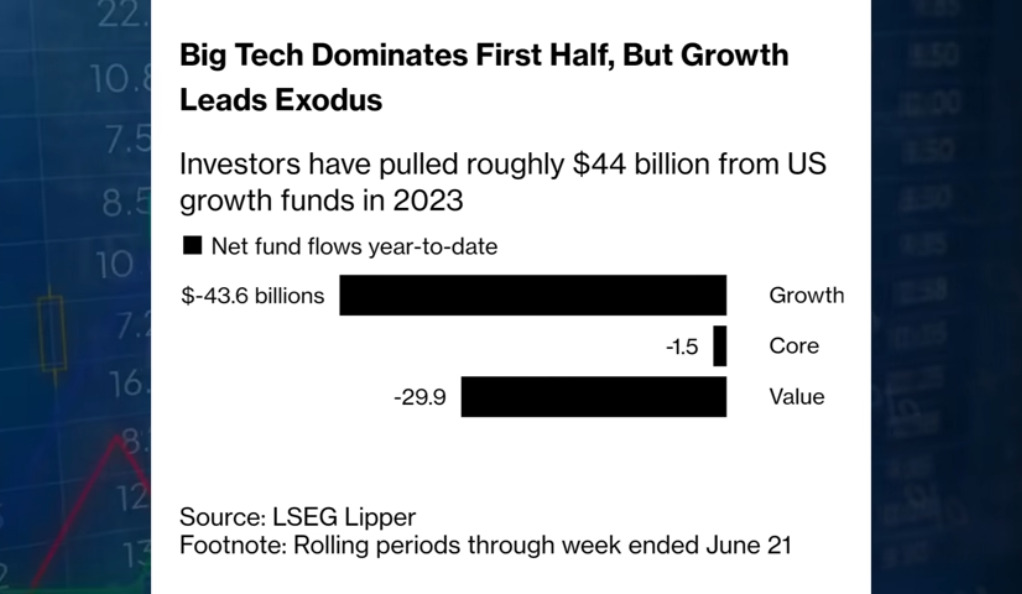
An intriguing trend playing out in the market involves ‘smart money’ and ‘dumb money’. Smart money refers to institutional investors who have a wealth of experience, sophisticated tools, and deep pockets. They’re the big sharks of the investment ocean. On the other hand, dumb money refers to retail investors who, while enthusiastic, often lack the same level of expertise or resources.
In the current market scenario, it appears that smart money is cashing out of growth stocks while dumb money continues to pour in. It’s like experienced swimmers leaving the water, sensing a storm, while newer ones are oblivious and continue to forage.
This trend warrants caution. When smart money starts exiting, it’s often a signal that the market could be overheated and due for a correction. It’s akin to birds flying away before an earthquake; while not always accurate, it’s a signal that shouldn’t be ignored.
The Chasing Mentality: A Critique
Retail investors often fall prey to a ‘chasing mentality’. The drive to not miss out on the ‘next big thing’ leads to buying high and selling low – a surefire recipe for disaster. It’s like chasing a rainbow for a pot of gold. Is the pot of gold really there, or is it just an illusion?
Learning from Past Market Manias
There’s an uncanny resemblance between the current market and past market manias. Remember the ‘stay at home’ mania, vaccine mania, or the EV mania? Each of these bubbles burst eventually, leaving many investors high and dry. It’s like a series of waves that sweep away the unprepared while those who are ready ride them to the shore.
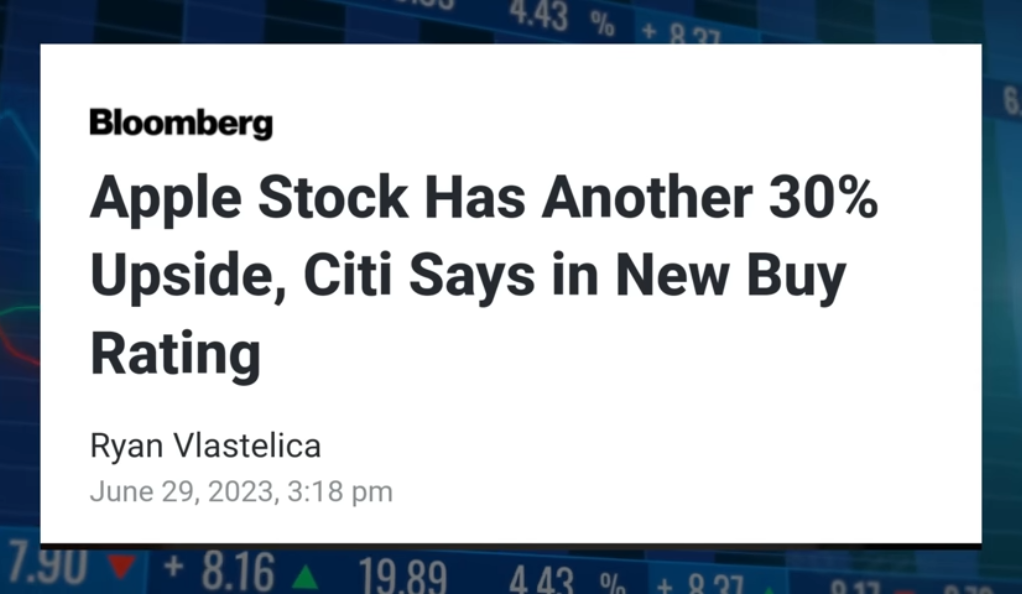
The Nvidia Example: A Lesson in Investing
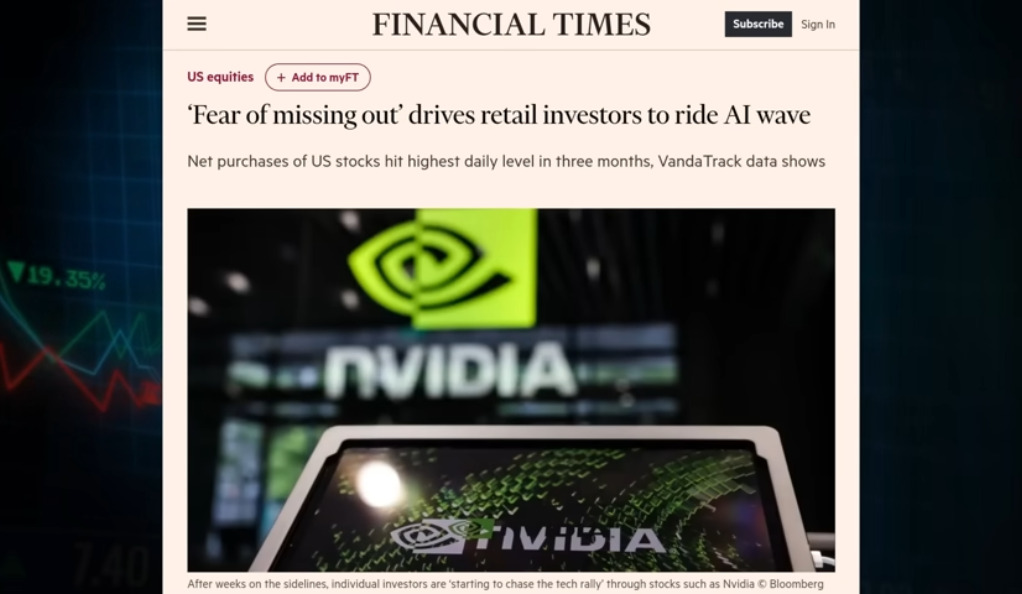
Taking Nvidia as an example, it might seem like a missed opportunity not to have invested during its recent rally. But it’s essential to remember that all bubbles eventually burst. It’s like not boarding a train that seems to be accelerating without brakes – it might seem that you are missing out, but a derailment could be catastrophic.
Conclusion
In conclusion, investing is a complex dance of decision-making, where understanding the music is critical. In the volatile world of tech stocks, it’s imperative to stay grounded in fundamentals and resist the lure of manias. Whether it’s a potential AI bubble, the debate between reinflation and recession, or the trap of the chasing mentality, investors need to navigate these waters with caution and wisdom. After all, in the grand scheme of things, it’s not about the quick wins, but the long, steady journey that leads to real wealth.
Ainu Token aims to offer impartial and trustworthy information on cryptocurrency, finance, trading, and shares. However, we don't provide financial advice and recommend users to conduct their own studies and thorough checks.
Comments (No)