In the dynamic and often unpredictable world of trading, having the right tools to navigate market volatility can make all the difference between success and failure. One such tool that has emerged as a game-changer for traders worldwide is the Average True Range (ATR) indicator. This technical analysis indicator, introduced by J. Welles Wilder Jr., has proven to be incredibly useful in measuring market volatility, providing traders with valuable insights that can significantly enhance their trading strategy.
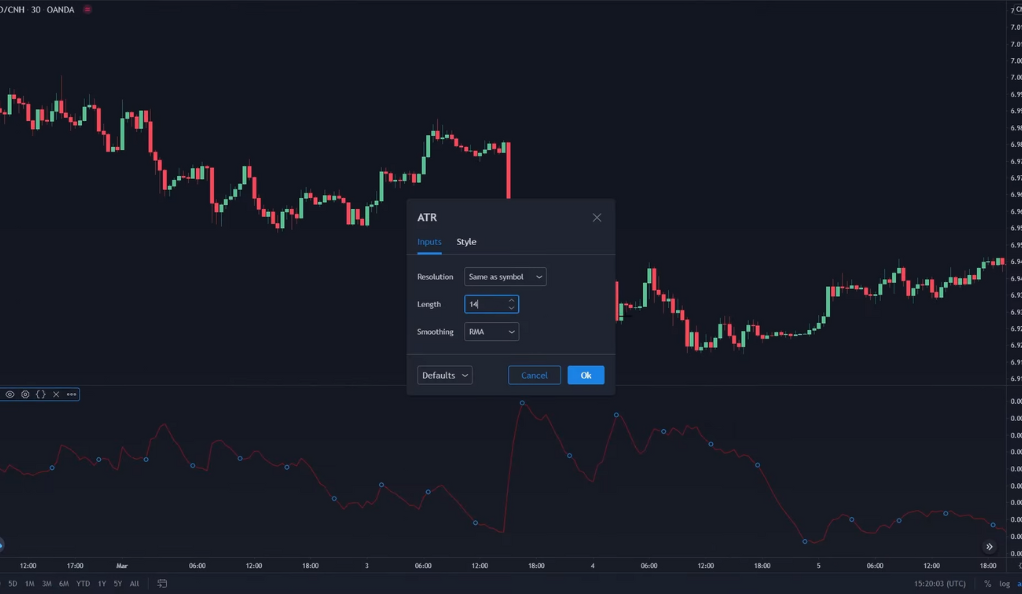
But what exactly is the ATR, and how does it work? The ATR is a type of moving average of the true ranges of a set number of periods, typically 14. It doesn’t predict the direction of price movement, but it provides a measure of the market’s volatility. By calculating the average range of price movement over a specified period, the ATR helps traders understand the volatility of the market they are dealing with. This understanding can then be used to make more informed decisions about entry and exit points, stop loss levels, and risk management, thereby enhancing the effectiveness of their trading strategy.
What is the ATR Indicator?
The Average True Range (ATR) is a powerful tool in the arsenal of technical analysis indicators. Introduced by J. Welles Wilder Jr., the same brilliant mind behind the Relative Strength Index (RSI), the ATR has become a go-to for traders looking to understand and navigate market volatility. Unlike many other indicators, the ATR does not predict the direction of a trend. Instead, it focuses on providing valuable information about the level of volatility in the market, which is a crucial aspect of trading that often gets overlooked.
The ATR works by calculating the average range of price movement over a specified period, typically 14 periods. It takes into account the highs and lows of each period and provides an average that gives traders an idea of what kind of price movement to expect. This information can be incredibly useful in planning trades and managing risk. For instance, in a highly volatile market, a trader might choose to use wider stop losses or take smaller position sizes to account for the larger potential price swings. Conversely, in a low volatility market, a trader might choose to trade larger position sizes or use tighter stop losses, as the price is less likely to make large, unexpected moves. By providing a measure of market volatility, the ATR helps traders make these important decisions.
How Does the ATR Work?
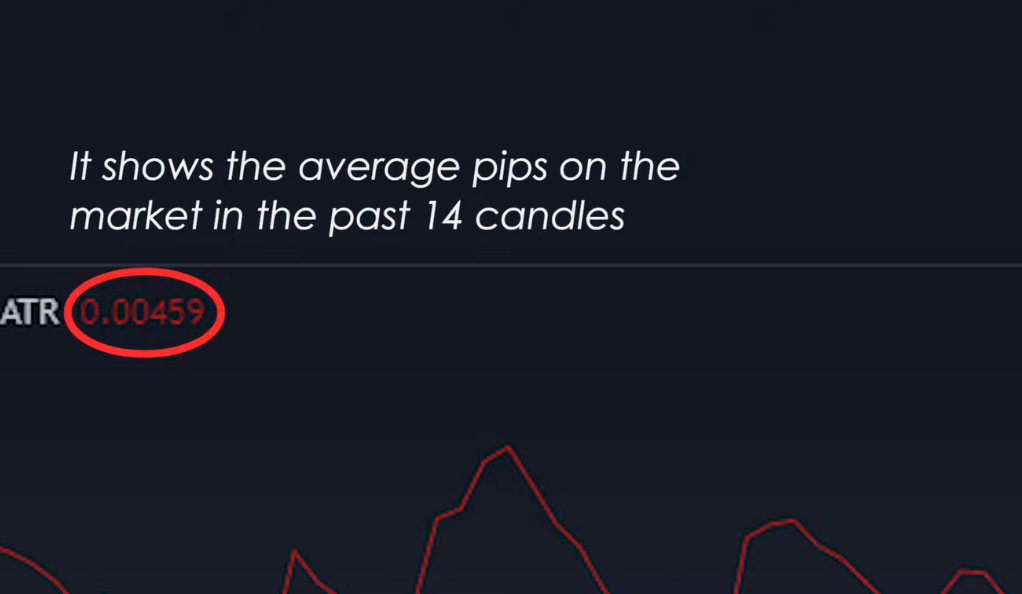
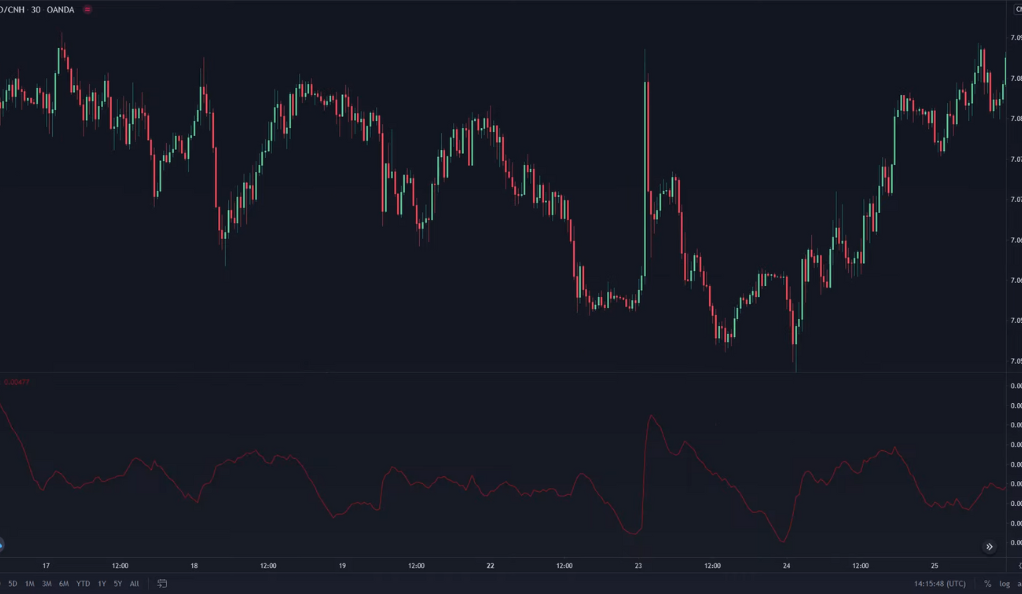
The Average True Range (ATR) operates on a relatively straightforward principle. It calculates the average number of pips – the smallest price move that a given exchange rate can make – over a specific period, typically the past 14 candles or time periods. This calculation provides a numerical value that represents the market’s average true range, hence the name of the indicator. The ATR value serves as a gauge of market volatility, with a higher ATR value indicating a higher level of volatility and a lower value suggesting less volatility.
However, it’s crucial to understand what the ATR does and does not tell us. While the ATR provides a measure of market volatility, it does not give any insight into the direction of the price movement. It only measures the degree of price volatility. This means that a high ATR value doesn’t necessarily mean an uptrend or downtrend. Instead, it signifies that the price is moving a significant amount over a given period, regardless of the direction. This information is invaluable for traders as it helps them adjust their trading strategies according to the market’s volatility level. For instance, in a high volatility market, traders might opt for a more cautious approach, while in a low volatility market, they might pursue more aggressive strategies.
Predicting Price Breakouts with the ATR
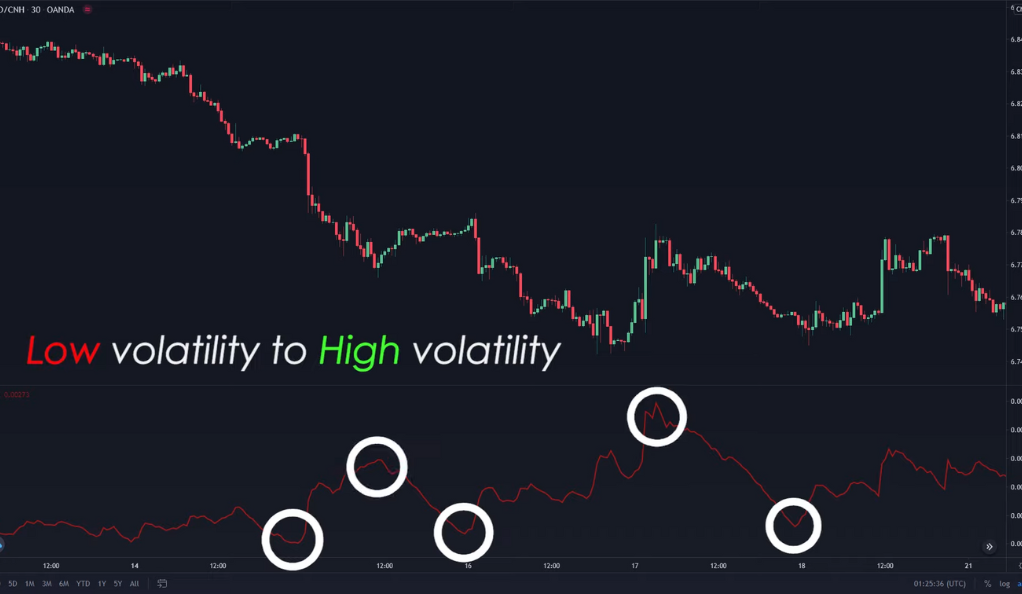
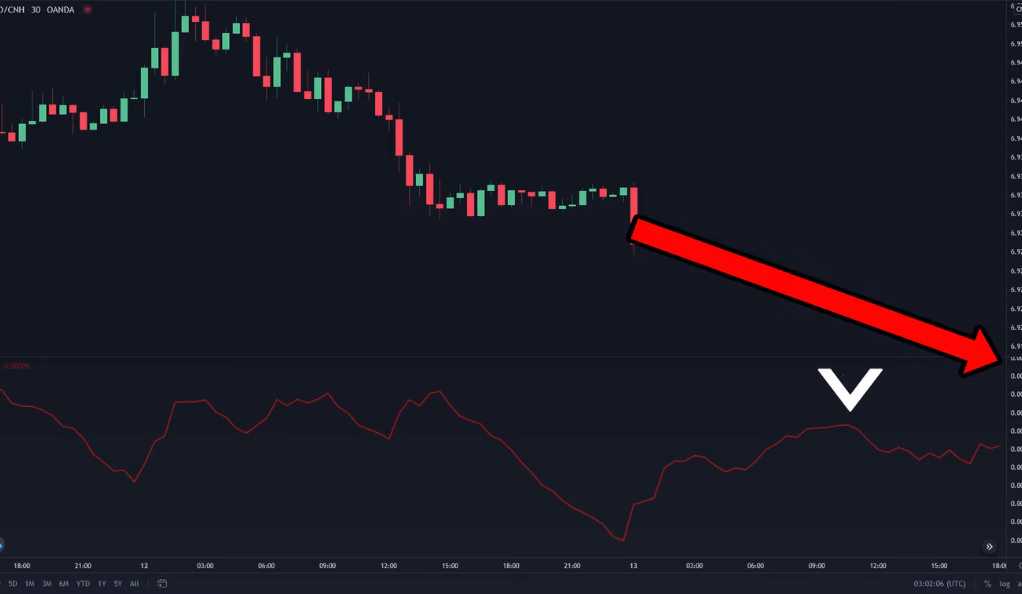
The Average True Range (ATR) is not just a measure of market volatility; it can also serve as a predictive tool for price breakouts. A price breakout occurs when the price of an asset moves above a resistance level or below a support level on high volume. Predicting when these breakouts are likely to occur can give traders a significant edge in the market. The ATR can help in this regard. When the ATR is at a relatively low value, it suggests that the market is in a state of calm. However, as the saying goes, “calm before the storm,” this period of low volatility could be a precursor to a breakout.
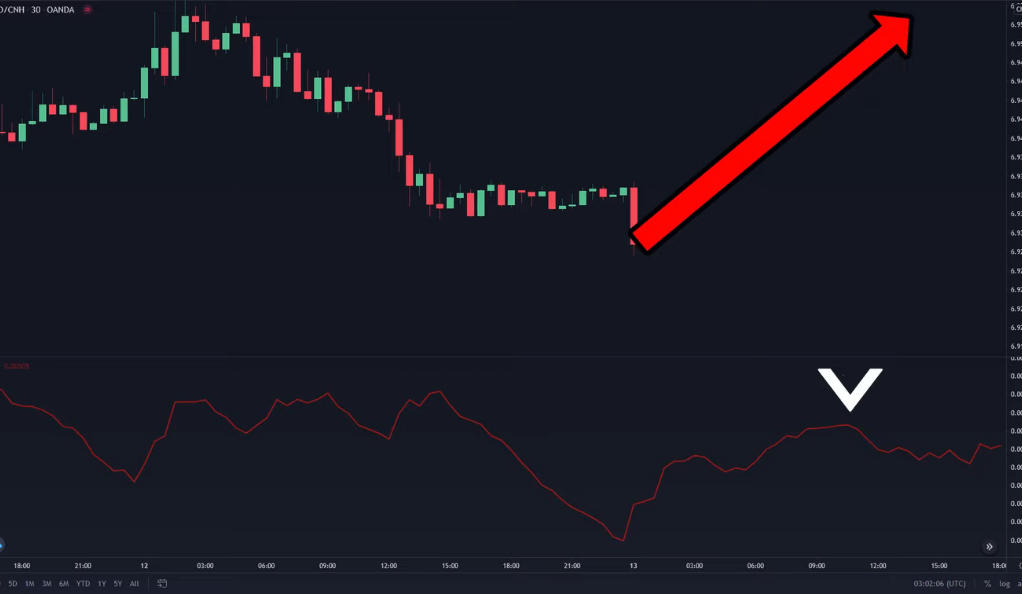
Markets often alternate between periods of low and high volatility. This cyclical nature of market volatility is a fundamental characteristic of financial markets. During periods of low volatility (low ATR), the market is typically consolidating, and the price is moving within a narrow range. However, these periods of consolidation often precede significant price moves or breakouts. Therefore, a low ATR value can be seen as a potential signal that a breakout might be on the horizon. Traders can use this information to prepare for the breakout and plan their trades accordingly. For instance, they might decide to place entry orders above the resistance level or below the support level to catch the breakout when it occurs.
Using the ATR to Set Stop Losses
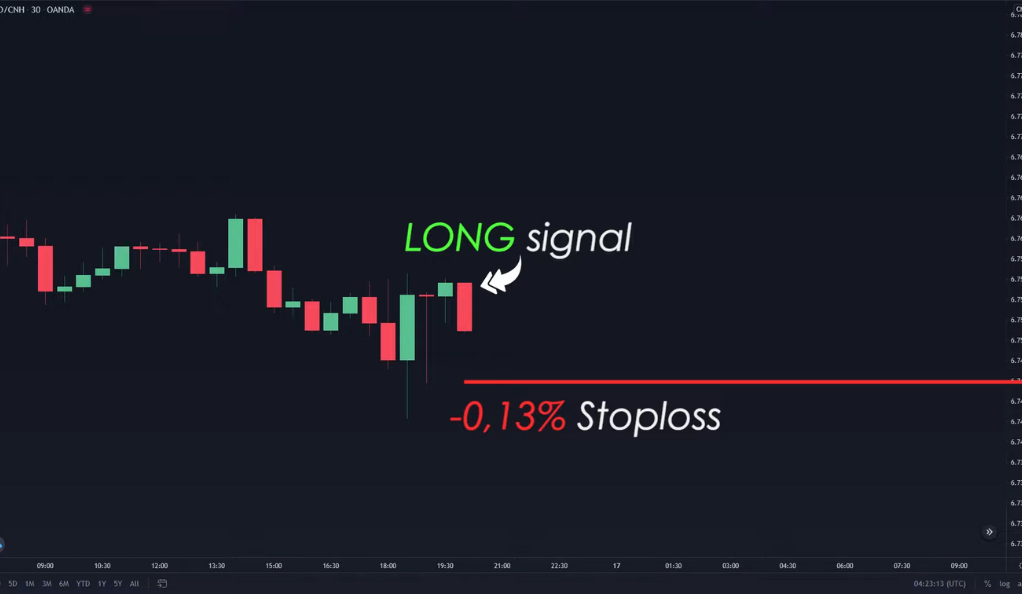
The Average True Range (ATR) is not just a tool for understanding market volatility and predicting price breakouts; it can also be a valuable ally when setting stop losses. A stop loss is an order placed with a broker to buy or sell once the stock reaches a certain price, designed to limit an investor’s potential loss on a trading position. The placement of stop losses is a critical aspect of trade management and risk control.
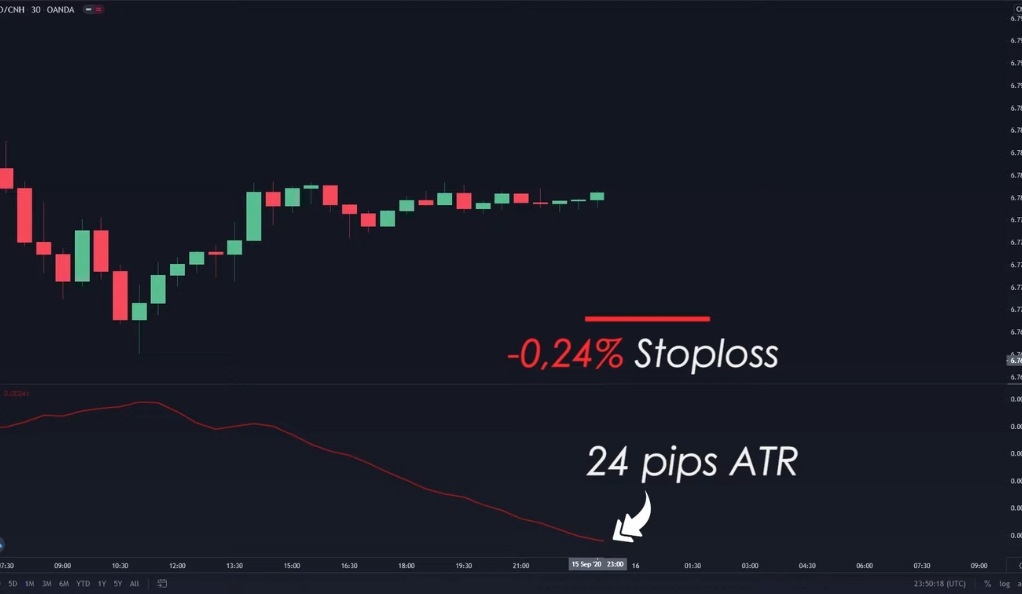
The ATR can help traders set more effective stop losses by aligning them with the market’s current volatility level. The stop loss should be a multiple of the ATR value, which can be adjusted based on the trader’s risk tolerance. For instance, if the ATR value is 24 pips, a trader might set their stop loss at 24 pips. This would mean that if the price moves against the trader’s position by more than 24 pips, the trade would be automatically closed, limiting the loss on that trade.
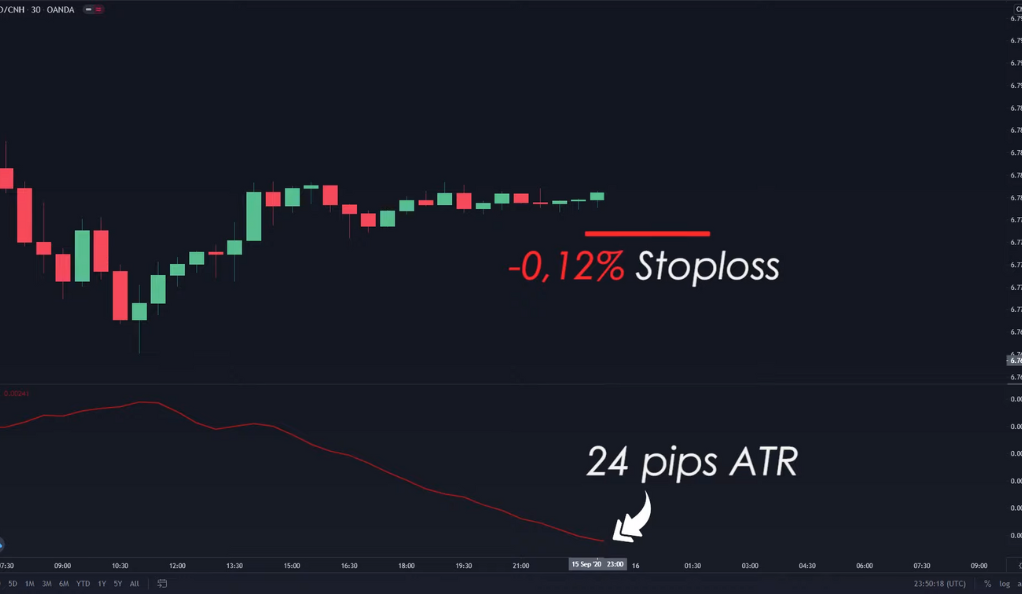
However, not all traders have the same risk tolerance. Some traders might prefer a tighter stop loss to limit potential losses even further. In this case, they could set their stop loss at a lower multiple of the ATR value. For example, they could set it at 12 pips (24 divided by 2). This approach ensures that the stop loss is always in line with the market’s current volatility level, making it a dynamic and adaptable tool. By using the ATR to set stop losses, traders can ensure that their risk management strategy is responsive to changing market conditions, thereby potentially improving their trading performance.
Combining the ATR with Other Indicators
The ATR is a powerful tool on its own, but when combined with other indicators, it can provide even more valuable insights. For instance, you can use the ATR in conjunction with the Haiken Ashi or the Chandelier Stop to predict the direction of the breakout and determine when to exit a trade.
The ATR and Money Management
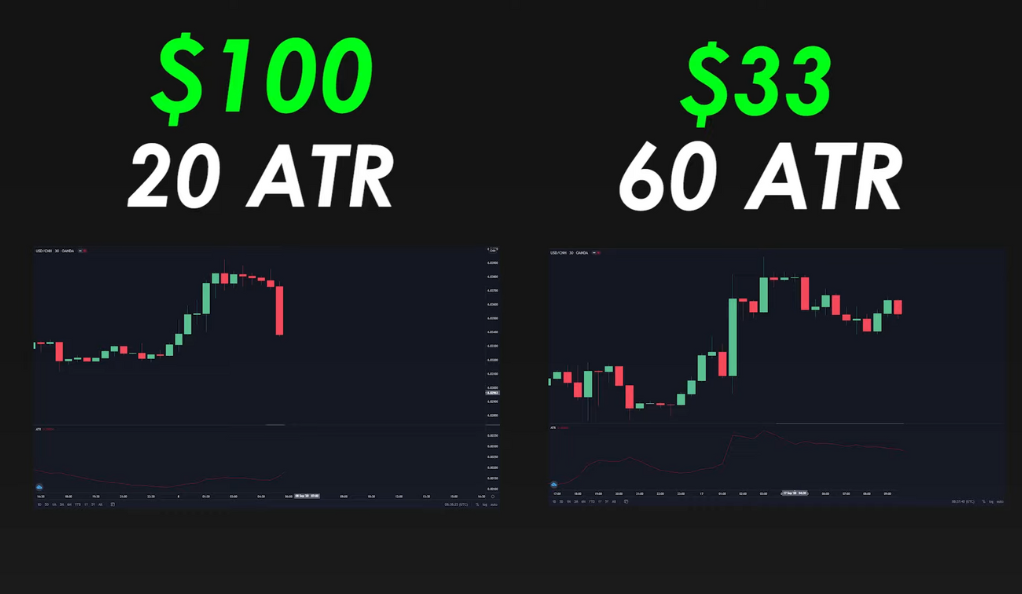
The ATR isn’t just useful for predicting breakouts and setting stop losses; it can also play a crucial role in money management. If you’re risking a certain amount on a trade with a specific ATR value, you should adjust your risk proportionally for trades with different ATR values. For example, if you’re risking $100 on a trade with an ATR of 20, and you want to trade in a market with an ATR of 60, you should risk only $33, since the market is three times more volatile.
Conclusion
In the world of trading, the Average True Range (ATR) indicator stands out as an invaluable tool that can significantly enhance a trader’s strategy. It offers a unique perspective into the often unpredictable realm of market volatility, providing traders with the insights they need to navigate the market more effectively. Whether it’s predicting price breakouts or aiding in setting stop losses, the ATR proves its worth time and time again. By understanding and effectively using the ATR, traders can significantly enhance their trading strategy, increasing their chances of success in the market.
However, it’s important to remember that while the ATR is a powerful tool, it doesn’t operate in isolation. It should be used in conjunction with other indicators and strategies to maximize its effectiveness. This holistic approach to trading allows for a more comprehensive understanding of the market, leading to more informed decision-making. So, whether you’re a seasoned trader or just starting, incorporating the ATR into your trading toolkit can provide a significant edge. Remember, the key to successful trading lies in continuous learning and adaptation. So, keep exploring, keep learning, and happy trading!
Ainu Token aims to offer impartial and trustworthy information on cryptocurrency, finance, trading, and shares. However, we don't provide financial advice and recommend users to conduct their own studies and thorough checks.
 Indicator in Trading)
 Indicator in Trading)
Comments (No)