The world of trading is filled with various indicators, each promising to guide you towards the path of profitability. One such powerful tool is the Relative Strength Index (RSI). Understanding how to use this tool effectively can significantly enhance your trading strategy. Let’s dive in and explore the RSI in detail.
Understanding the Basics of RSI
To master the Relative Strength Index (RSI) in trading, it is essential to understand its basics. The RSI is a widely used momentum oscillator that gauges the velocity and magnitude of price movements. By oscillating between zero and 100, this indicator offers valuable insights into the market’s overbought or oversold conditions. While the conventional interpretation considers an RSI value above 70 as an indication of an overbought market and a value below 30 as suggestive of an oversold market, it is crucial to delve deeper into the intricacies of RSI analysis.
The RSI’s true power lies in its ability to provide nuanced signals beyond simple overbought and oversold conditions. Traders can uncover additional information by analyzing divergences, trendlines, and chart patterns in conjunction with RSI readings. Divergences occur when the price movement and the RSI trend exhibit contrasting patterns, which can signal potential reversals or shifts in the market sentiment. Moreover, drawing trendlines on the RSI chart can aid in identifying support and resistance levels, helping traders make more informed decisions. Additionally, combining RSI analysis with other technical indicators and thorough market research can enhance its effectiveness in predicting price movements and maximizing trading profits. By mastering these advanced techniques, traders can unlock the full potential of the Relative Strength Index and gain a competitive edge in the dynamic world of trading.
Common Misconceptions about RSI
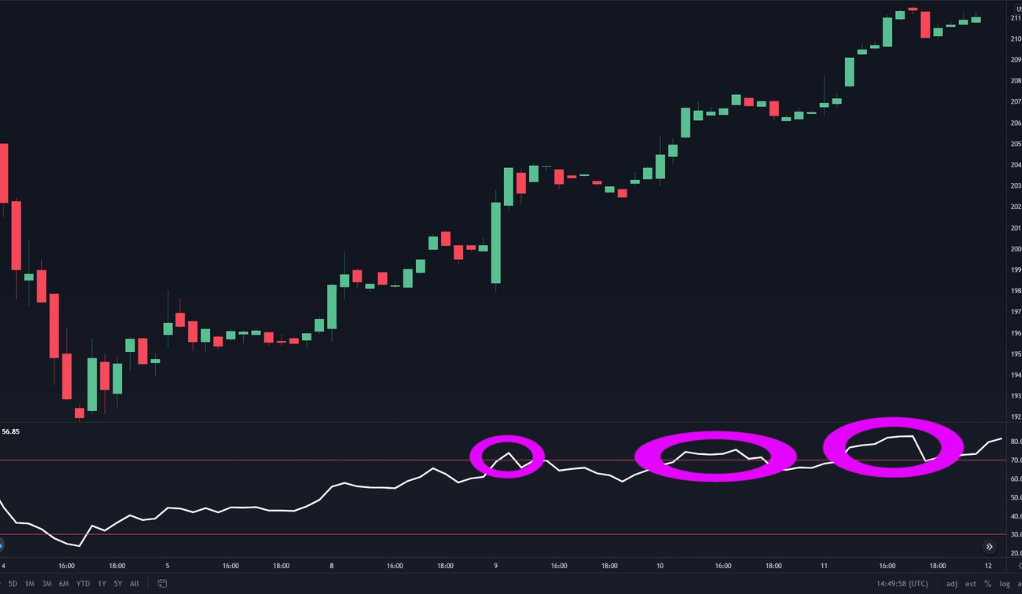
It is crucial to address common misconceptions surrounding the Relative Strength Index (RSI) to ensure traders use this indicator effectively. One prevalent misconception is the belief that when the RSI enters the oversold region, a market reversal to the upside is imminent, and conversely, when the RSI reaches the overbought region, a downward reversal is expected. However, this oversimplified view can lead to poor trading decisions. In reality, markets, especially those experiencing strong trends, can remain overbought or oversold for extended periods without an immediate reversal. Relying solely on RSI signals without considering other factors can result in false signals and missed opportunities. Therefore, it is important to use the RSI in conjunction with other technical analysis tools and consider the overall market context to make well-informed trading decisions.
To effectively utilize the RSI, traders should adopt a more nuanced approach. Instead of relying solely on the overbought and oversold levels, they should focus on the RSI’s dynamics and its interaction with price movements. Understanding the concept of divergence is crucial. Divergences occur when the price and the RSI trend display contrasting patterns, indicating potential reversals or shifts in market sentiment. Additionally, considering the duration and strength of the trend can provide valuable insights. In a strong uptrend, the RSI may stay in the overbought region for an extended period, and vice versa in a downtrend. Traders should also incorporate other technical indicators, such as moving averages or trendlines, to validate RSI signals and gain a comprehensive view of the market. By adopting a more holistic approach and avoiding oversimplification, traders can harness the true potential of the RSI and make informed trading decisions in various market conditions.
RSI: A Supporting Indicator, Not a Standalone Tool
While the Relative Strength Index (RSI) is a valuable tool in trading, it is important to understand that it is most effective when used in conjunction with other indicators and forms of analysis. Relying solely on the RSI as the main guiding tool for trading decisions can be risky. Instead, the RSI should be treated as a supporting indicator that works in harmony with other technical analysis methods. For example, when the RSI indicates oversold levels, it can be more meaningful when it aligns with a major support line on the price chart. This combination of indicators can provide a stronger and more reliable signal, increasing the probability of successful trades. By considering multiple indicators and analysis techniques together, traders can obtain a more comprehensive view of the market dynamics and make well-informed trading decisions.
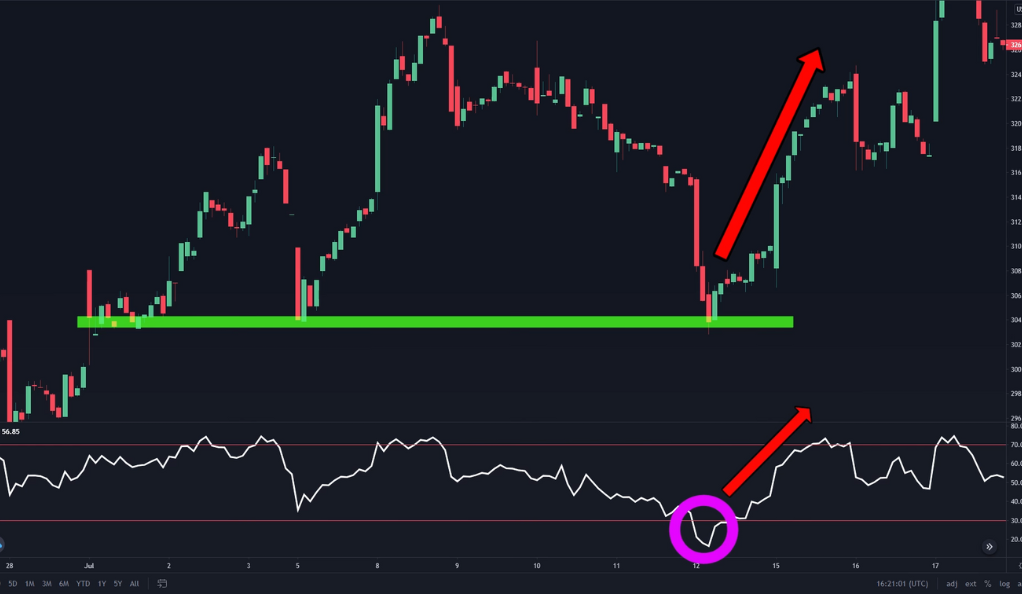
To maximize the effectiveness of the RSI, it is essential to integrate it into a broader trading strategy. By incorporating other forms of analysis, such as support and resistance levels, trend lines, or candlestick patterns, traders can validate the signals generated by the RSI and reduce the risk of false readings. For instance, if the RSI indicates an overbought condition while the price approaches a strong resistance level, it adds weight to the potential for a reversal or a price correction. Similarly, when the RSI shows oversold levels and coincides with a bullish trendline, it strengthens the signal for a possible upward price movement. By combining the RSI with other indicators, traders can enhance their overall trading strategy, mitigate risk, and improve their chances of identifying profitable opportunities in the market. Remember, the RSI should be seen as a valuable piece of the puzzle rather than a standalone tool for trading decisions.
The Power of RSI Divergences
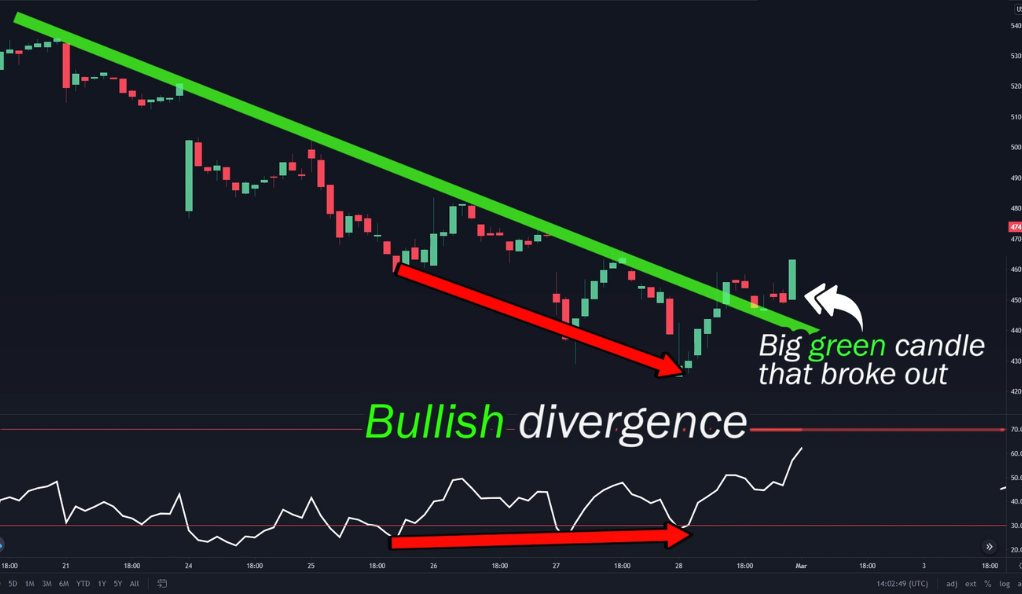
One of the most potent ways to use the RSI is to spot divergences. A divergence occurs when the price of an asset moves in the opposite direction of the RSI. There are two types of divergences: bullish and bearish.
A bullish divergence is when the price forms lower lows, but the RSI forms higher highs. This scenario often signals a potential reversal to the bullish side. Conversely, a bearish divergence occurs when the price forms higher highs, but the RSI forms lower lows, indicating a possible shift to the bearish side.
The 50 Line Strategy with RSI
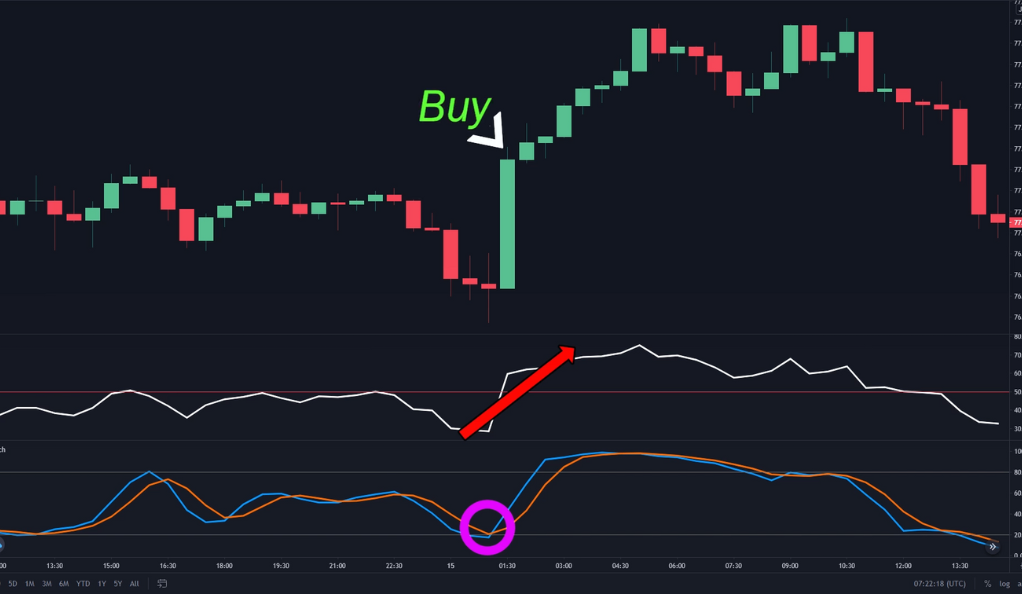
The 50 line strategy with the Relative Strength Index (RSI) is a simple yet popular approach used by traders. When the RSI crosses above the 50 line, it is interpreted as a bullish signal, indicating potential upward momentum in the market. Conversely, when the RSI crosses below the 50 line, it is seen as a bearish signal, suggesting a possible downward movement in prices. However, it is important to note that relying solely on this strategy may not yield consistent results. Traders should consider incorporating additional indicators and analysis techniques to validate the signals generated by the RSI and enhance the overall accuracy of their trading decisions. By combining the 50 line strategy with complementary indicators, such as the Stochastics indicator, traders can gain a more comprehensive understanding of market conditions and increase the reliability of their trading signals.
While the 50 line strategy with the RSI provides a straightforward approach to identifying potential bullish or bearish signals, it is crucial to use it in conjunction with other indicators and analysis tools. The RSI crossing above or below the 50 line alone may not provide sufficient confirmation for initiating trades. To strengthen the reliability of this strategy, traders can incorporate additional indicators, such as the Stochastics indicator. The Stochastics indicator measures the momentum of price movements and can provide further confirmation when its readings align with the signals generated by the RSI. For instance, if the RSI crosses above the 50 line and the Stochastics indicator also indicates an upward shift, it adds conviction to the bullish signal. By combining indicators, traders can increase the accuracy of their trading signals and make more informed decisions. Remember, the 50 line strategy is a valuable starting point, but integrating it with complementary indicators can enhance its effectiveness and improve trading outcomes.
The Importance of Combining RSI with Other Indicators
Combining the Relative Strength Index (RSI) with other indicators is crucial for developing a well-rounded trading strategy. While the RSI is a powerful tool for assessing market momentum and overbought/oversold conditions, it should not be used in isolation. The market is influenced by multiple factors, and no single indicator can capture the complexity of price movements. By integrating the RSI with other forms of analysis, such as support and resistance levels, trend lines, and additional technical indicators like moving averages or volume analysis, traders can gain a more holistic perspective of the market. This combination of indicators provides a comprehensive set of signals that can enhance the accuracy and reliability of trading decisions. It allows traders to filter out false signals, validate trends, and identify potential entry and exit points with greater precision.
Using the RSI in conjunction with other indicators helps to confirm and strengthen the signals generated by each individual tool. For example, when the RSI indicates overbought conditions, a trader might look for additional signals, such as a bearish candlestick pattern or a divergence with the price action, to reinforce the potential for a market reversal. Similarly, combining the RSI with support and resistance levels can provide valuable insights into the strength of price levels and potential areas of price reversal. By leveraging multiple indicators and analysis techniques, traders can create a more robust trading strategy that accounts for various market dynamics and increases the probability of making successful trades. Remember, the goal is to establish a synergy between different indicators and tools, harnessing their collective power to improve decision-making and achieve consistent profitability in the dynamic world of trading.
Conclusion
Mastering the RSI can significantly enhance your trading strategy. However, it’s crucial to remember that the RSI is not a standalone tool. It should be used in conjunction with other forms of analysis and indicators. By understanding the common misconceptions about the RSI, using it as a supporting indicator, spotting divergences, and employing the 50 line strategy, you can leverage the RSI to its full potential.
Ainu Token aims to offer impartial and trustworthy information on cryptocurrency, finance, trading, and shares. However, we don't provide financial advice and recommend users to conduct their own studies and thorough checks.
 in Trading)
 in Trading)
Comments (No)