The RSI Divergent Strategy utilizes three key indicators: the Relative Strength Index (RSI), the 200 Exponential Moving Average (EMA), and Stochastics. These indicators provide traders with insights into market trends and potential trading opportunities. The RSI is a momentum oscillator that identifies overbought and oversold conditions. The 200 EMA smoothes out price data to determine the overall trend. Stochastics compares an asset’s closing price to its price range and helps identify overbought/oversold conditions and trend reversals.
When combined, these indicators form the RSI Divergent Strategy. Traders look for divergences between the RSI and price action, as well as the 200 EMA and Stochastics, to identify potential reversals. A bullish divergence occurs when the RSI forms higher lows while the price forms lower lows, suggesting an upward reversal. A bearish divergence occurs when the RSI forms lower highs while the price forms higher highs, indicating a potential downward reversal. Considering the position of the price relative to the 200 EMA and the readings of Stochastics further confirms trading decisions.
The Indicators: RSI, 200 EMA, and Stochastics
The RSI, 200 EMA, and Stochastics are three key indicators used in trading. The Relative Strength Index (RSI) measures price momentum and overbought/oversold conditions. The 200 Exponential Moving Average (EMA) helps identify the overall trend, and Stochastics compares an asset’s closing price to its price range. These indicators work together to provide traders with valuable insights into market trends and potential trading opportunities.
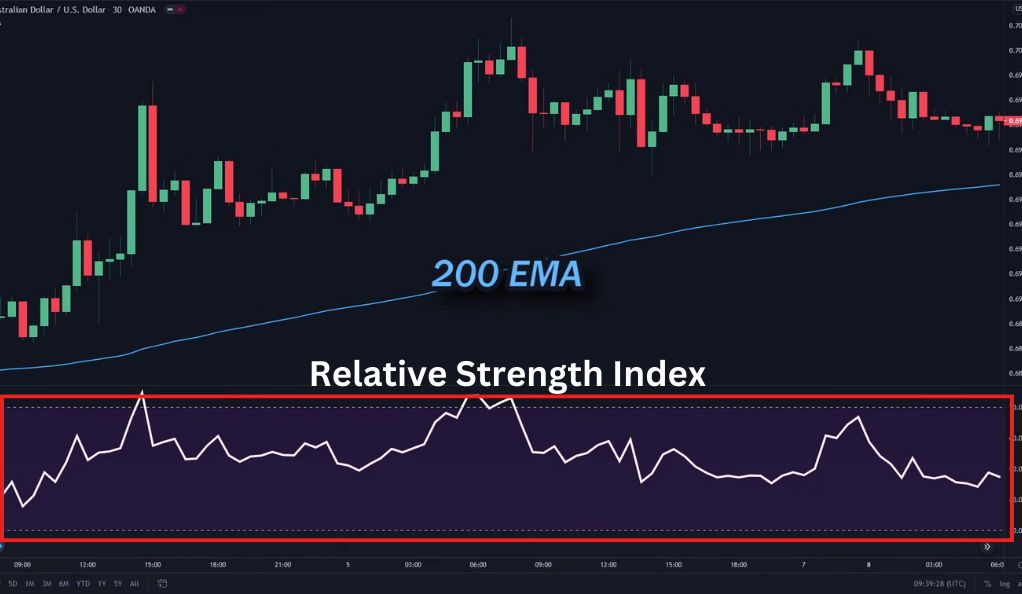
Relative Strength Index (RSI)
The RSI is a momentum oscillator that measures the speed and change of price movements. It oscillates between zero and 100 and is typically used to identify overbought or oversold conditions in a market. However, in the RSI Divergent Strategy, we use it in a slightly different way.
200 Exponential Moving Average (EMA)
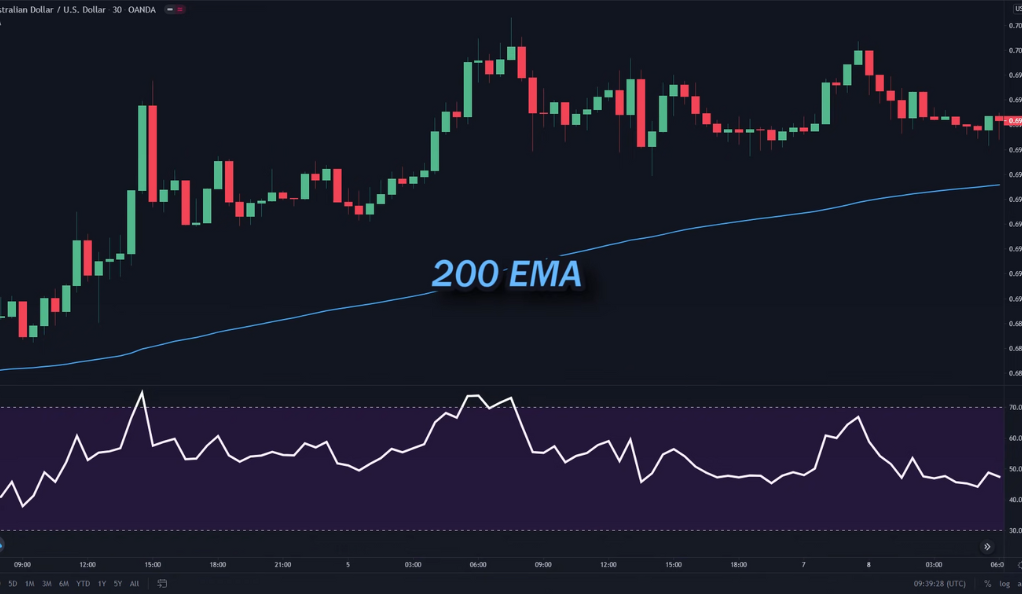
The 200 EMA is a type of moving average that places a greater weight and significance on the most recent data points. Like all moving averages, it smooths out price data to help traders visualize the overall trend in the market.
Stochastics
Stochastics is a momentum indicator that compares a particular closing price of a security to a range of its prices over a certain period of time. It generates values between 0 and 100 and is used to predict price reversals.
The 2 Types of Divergence
In the realm of trading, divergences play a crucial role in predicting potential price movements. Essentially, a divergence occurs when the price of an asset and a momentum indicator, such as the RSI, move in opposite directions. There are two main types of divergences that traders need to be aware of: regular divergence and hidden divergence.

Regular Divergence
Regular divergence is a signal of a potential trend reversal. It occurs when the price and the indicator move in opposite directions. For instance, if the price is making higher highs but the RSI is making lower highs, it’s called a bearish regular divergence and may signal a downward trend reversal. Conversely, if the price is making lower lows but the RSI is making higher lows, it’s a bullish regular divergence, indicating a potential upward trend reversal.
Hidden Divergence
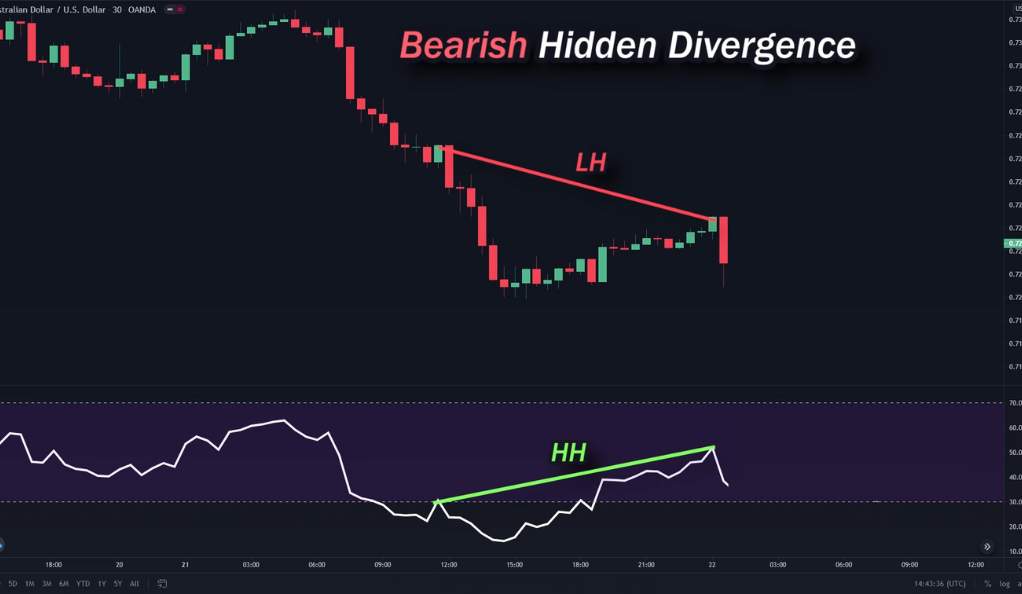
Hidden divergence, on the other hand, signals a potential continuation of the existing trend. A bullish hidden divergence occurs when the price makes a higher low, but the RSI makes a lower low. This suggests that the upward trend may continue. A bearish hidden divergence happens when the price makes a lower high, but the RSI makes a higher high, indicating that the downward trend may persist.
Identifying the Trend with 200 EMA
In the RSI Divergent Strategy, the 200 Exponential Moving Average (EMA) plays a crucial role in identifying the overall trend. By analyzing the relationship between the price and the 200 EMA, traders can determine whether the market is in a bullish or bearish trend. If the price is above the 200 EMA, it suggests a bullish trend, indicating that the asset’s price is generally rising. On the other hand, if the price is below the 200 EMA, it indicates a bearish trend, suggesting that the asset’s price is generally declining.
In the RSI Divergent Strategy, traders use the 200 EMA to establish the trend and then focus on hidden divergences. Hidden divergences occur when the price and RSI indicator show conflicting signals, suggesting a potential trend continuation. If the price is above the 200 EMA, traders look for bullish hidden divergences where the price forms lower lows while the RSI forms higher lows. If the price is below the 200 EMA, they search for bearish hidden divergences with higher highs in price and lower highs in the RSI. While this strategy provides a systematic approach, success in trading relies on caution, thorough analysis, and effective risk management.
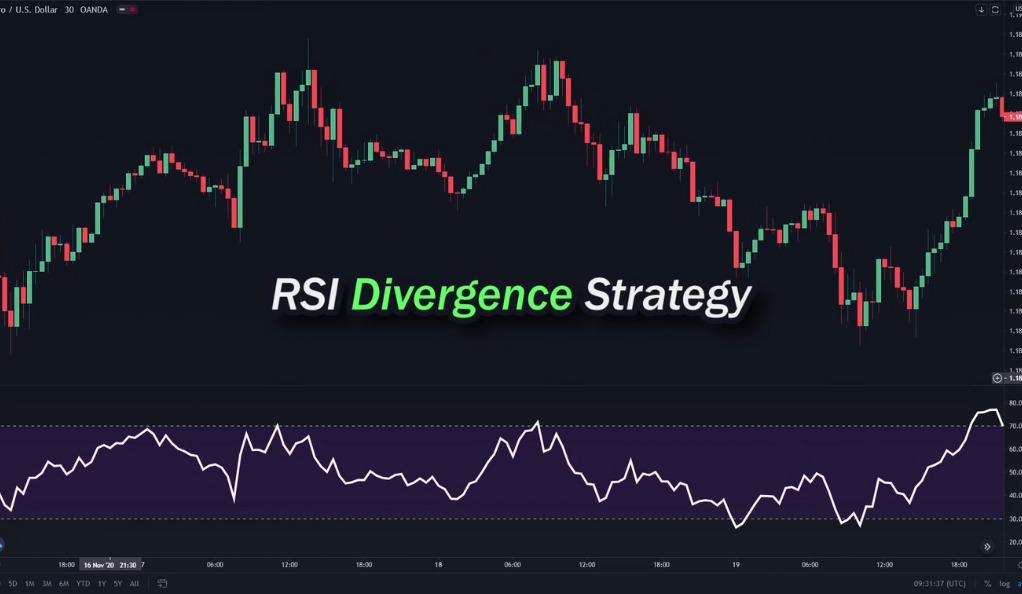
Spotting Divergences with RSI
In the RSI Divergent Strategy, traders pay close attention to spotting divergences using the Relative Strength Index (RSI). Divergences arise when the price and the RSI indicator move in opposite directions, indicating a potential shift in the underlying momentum. A bullish hidden divergence is identified when prices form higher lows while the RSI forms lower lows. This suggests that despite the price showing a temporary decline, the underlying bullish momentum is strengthening. It indicates a potential continuation of the upward trend. Traders may interpret this as a signal to consider buying opportunities.
Conversely, a bearish hidden divergence occurs when prices form lower highs while the RSI forms higher highs. This implies that even though the price experiences temporary upward movements, the underlying bearish momentum is gaining strength. It indicates a potential continuation of the downward trend. Traders may interpret this as a signal to consider selling opportunities or adopting a more cautious approach.
By closely monitoring and identifying these divergences, traders utilizing the RSI Divergent Strategy aim to capitalize on potential trend continuations. It’s important to note that divergences should be considered in conjunction with other technical indicators and market factors for a comprehensive analysis before making trading decisions. Additionally, risk management and adherence to a well-defined trading plan are crucial to mitigate potential risks associated with trading strategies.
Confirming the Divergence with Stochastics
After identifying a divergence using the Relative Strength Index (RSI) in the RSI Divergent Strategy, the next step is to confirm the validity of the divergence. This is where the Stochastics indicator comes into play. Stochastics is a momentum oscillator that compares an asset’s closing price to its price range over a specific period. It consists of two lines, %K and %D, which are used to determine potential overbought and oversold conditions as well as trend reversals.
In the case of a bullish hidden divergence, where prices form higher lows and the RSI forms lower lows, traders look for confirmation from Stochastics. They wait for the Stochastics lines to cross over in an upward direction. This crossover serves as a confirmation that the underlying bullish momentum is strengthening and supports the potential continuation of the upward trend. It provides traders with an additional signal to consider initiating long positions or taking other bullish trading actions.
For a bearish hidden divergence in the RSI Divergent Strategy, where prices form lower highs and the RSI forms higher highs, traders seek confirmation from Stochastics. They wait for the Stochastics lines to cross downward, indicating that the bearish momentum is strengthening and supporting the potential continuation of the downward trend. By using Stochastics as a confirmation tool, traders aim to improve the reliability of their divergence signals. However, it’s crucial to exercise caution, conduct thorough analysis, and consider other market factors before making trading decisions. Proper risk management and adherence to a well-defined trading plan are key to successful trading.
Entry and Exit Points
Once the divergence has been confirmed using the RSI and Stochastics indicators in the RSI Divergent Strategy, traders proceed to determine their entry and exit points for their trading positions. These points are crucial for managing risk and optimizing potential profits.
For a buy position, traders place their stop loss below the nearest swing low, which serves as a price level where the asset has previously shown support. This stop loss placement helps limit potential losses if the trade doesn’t go as anticipated. Additionally, traders set their profit target at 1.5 times their stop loss. This profit target is a predetermined price level at which traders aim to exit the position to secure their desired profit. By setting a profit target that is greater than the stop loss, traders aim to achieve a favorable risk-reward ratio, where the potential reward outweighs the potential risk.
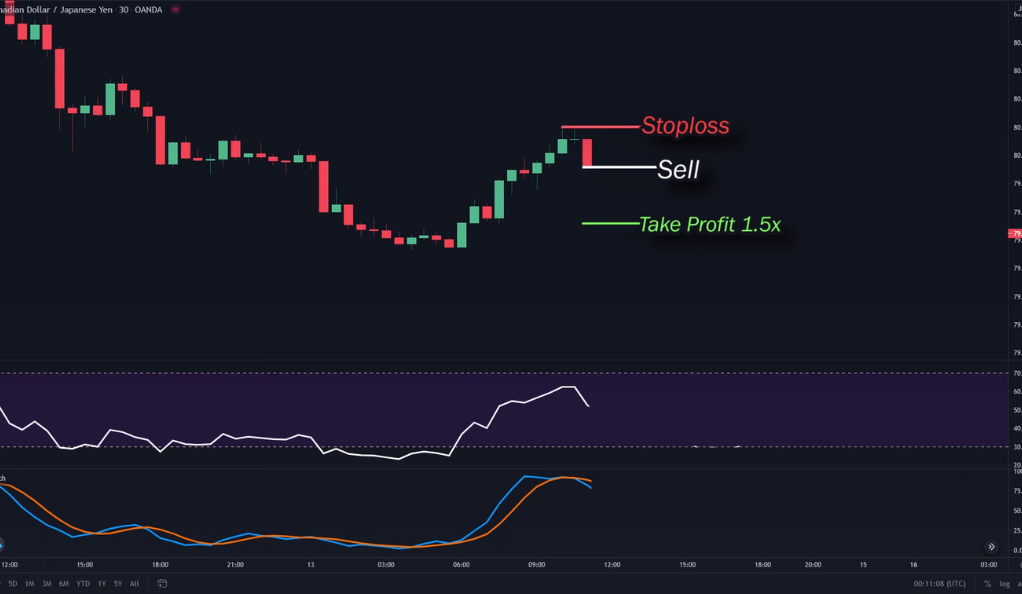
On the other hand, for a sell position, traders place their stop loss above the nearest swing high, which represents a price level where the asset has previously shown resistance. This stop loss placement helps minimize losses if the trade moves against them. Traders also set their profit target at 1.5 times their stop loss. This profit target is a predetermined price level at which traders aim to exit the position to lock in their desired profit. Again, by ensuring that the profit target exceeds the stop loss, traders aim to achieve a favorable risk-reward ratio.
By adhering to these entry and exit points, traders following the RSI Divergent Strategy aim to strike a balance between maximizing potential profits and managing risk effectively. However, it’s important to note that market conditions can change rapidly, and traders should continuously monitor the trade and be prepared to adjust their stop loss or profit target if necessary. Risk management and prudent decision-making are essential components of successful trading.
Conclusion
The RSI Divergent Strategy is a powerful tool in a trader’s arsenal. By utilizing the RSI, 200 EMA, and Stochastics indicators, traders can identify potential trends, spot divergences, and confirm these divergences to make informed trading decisions. However, like any strategy, it doesn’t guarantee success. It’s important to consider other factors and use proper risk management when trading.
Ainu Token aims to offer impartial and trustworthy information on cryptocurrency, finance, trading, and shares. However, we don't provide financial advice and recommend users to conduct their own studies and thorough checks.
Comments (No)