In the fast-paced, ever-changing world of trading, having a reliable strategy can be the difference between success and failure. One strategy that has been gaining attention recently is the Best Free Tradingview Indicator Strategy for 2023. But what makes it so special? Let’s delve deeper into the mechanics of this strategy and uncover its secrets.
The Building Blocks of the Strategy
At the heart of this intriguing strategy lie two free Tradingview indicators: the Linear Regression Candles and the UT Bot Alerts. These indicators form the foundation of the strategy, providing the critical signals that guide traders in their decision-making process. But what makes these indicators so crucial?
Linear Regression Candles
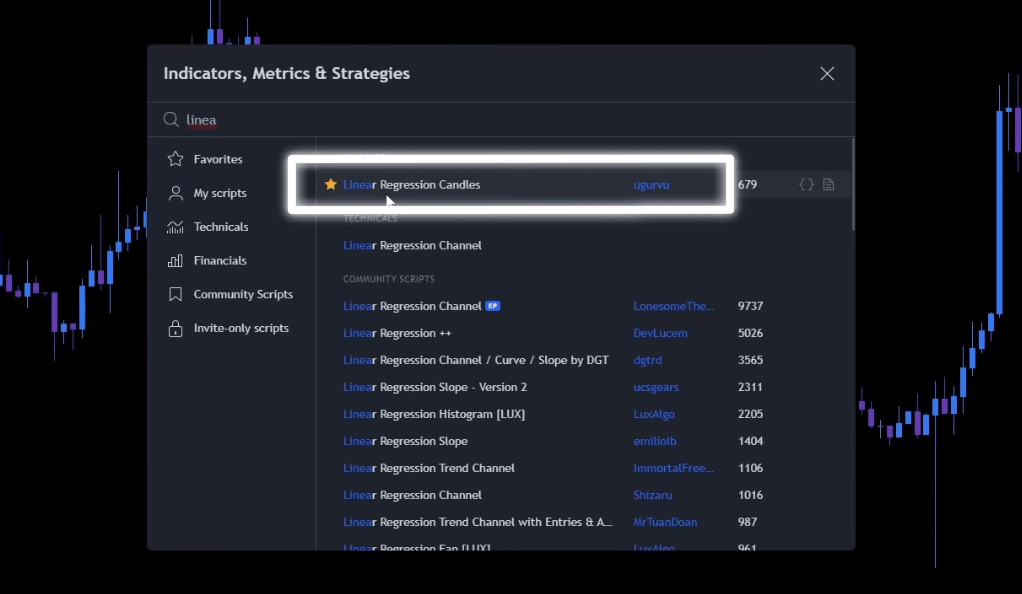
The Linear Regression Candles indicator is a powerful tool designed to filter out market noise. By adjusting the signal smoothing from the standard 11 to 7, traders can gain a more precise understanding of market trends. This adjustment is akin to fine-tuning a radio to eliminate static and hear the broadcast more clearly.
UT Bot Alerts
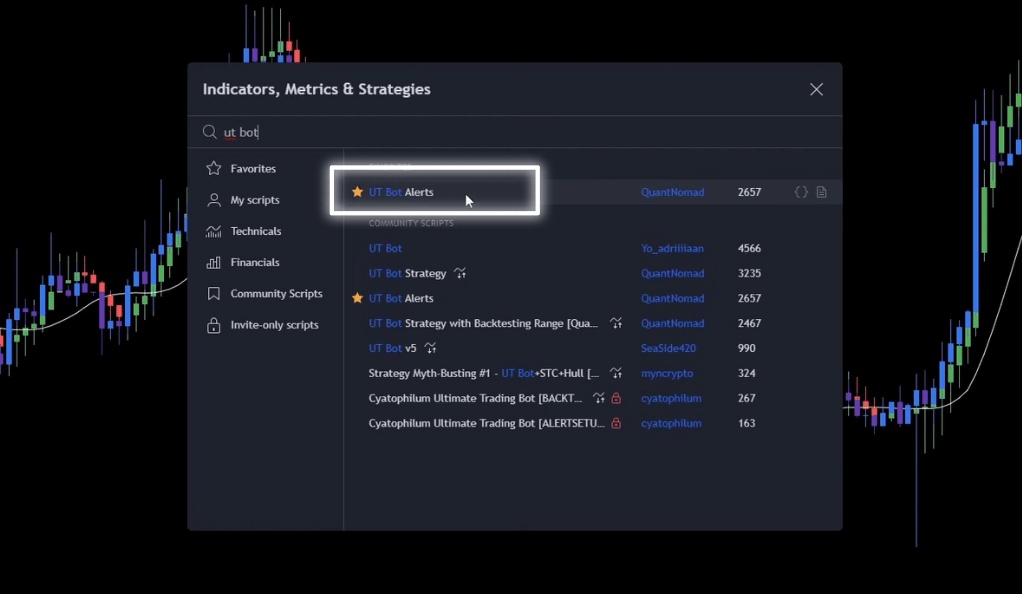
The UT Bot Alerts indicator is a powerful tool that generates buy and sell signals based on specific market conditions. These signals serve as prompts for traders, guiding them on when to enter or exit a trade. However, the true power of this indicator lies in its customizability, allowing traders to adjust its settings to better suit their trading style and objectives.
Key Value Adjustment
One of the primary adjustments that traders can make in the UT Bot Alerts indicator is the Key Value. By default, the Key Value is set at 1. However, for the Best Free Tradingview Indicator Strategy for 2023, the Key Value is changed from 1 to 2.
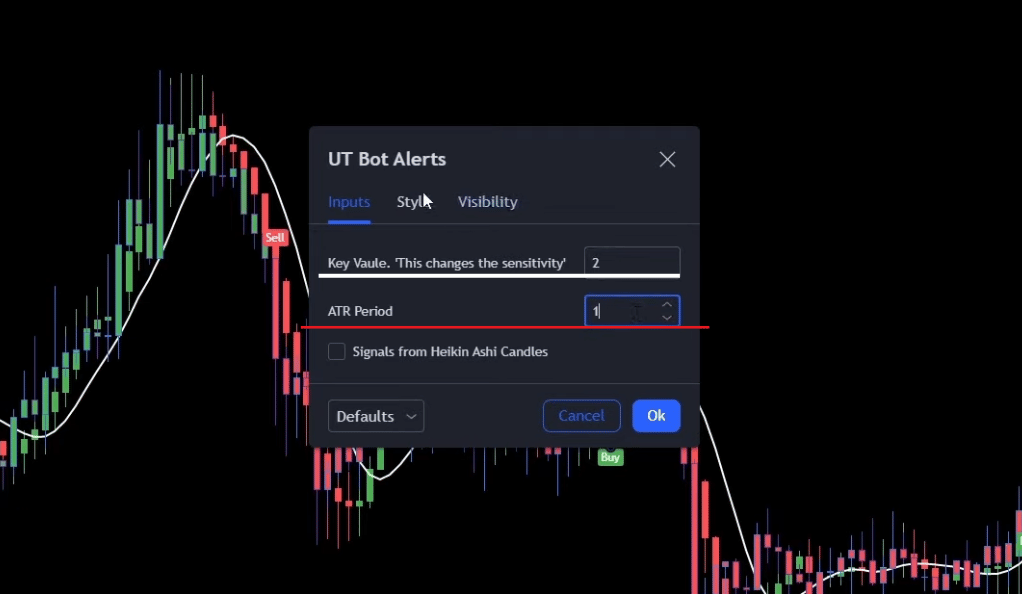
But what does this adjustment mean? The Key Value essentially determines the sensitivity of the indicator. By increasing the Key Value, the indicator becomes less sensitive, reducing the number of signals generated. This can help filter out false signals, making the indicator more reliable. It’s akin to adjusting the focus on a camera lens to get a clearer, sharper image.
ATR Period Adjustment
Another critical adjustment in the UT Bot Alerts indicator is the ATR (Average True Range) Period. The ATR Period is a measure of market volatility. By default, the ATR Period is set at 10. However, for this strategy, the ATR Period is changed from 10 to 1.
This adjustment increases the responsiveness of the indicator to changes in market volatility. With a lower ATR Period, the indicator will react more quickly to volatility changes, potentially leading to earlier signals. It’s like adjusting the sensitivity of a seismograph to detect even the smallest tremors.
Implementing the Strategy
Before diving into the implementation, it’s crucial to understand the role of the two indicators in this strategy: the Linear Regression Candles and the UT Bot Alerts. These indicators are not just tools; they are the eyes and ears of the trader in the market. They provide the necessary signals that guide traders in their decision-making process.
The Linear Regression Candles indicator helps filter out market noise, providing a clearer picture of market trends. On the other hand, the UT Bot Alerts indicator complements the Linear Regression Candles by providing key value and ATR Period adjustments, fine-tuning the alerts to better align with the trader’s goals.
Long Entry
For a long entry, traders need to observe a buy signal followed by a green regression candle printed above the white line. This sequence confirms the entry signal. The stop loss is then placed at the recent swing low, and the trade is exited when a red regression candle appears. It’s like waiting for the perfect wave to surf – timing and positioning are everything.
Short Entry
For a short entry, the process is essentially mirrored. Traders need to see a sell signal followed by a red regression candle printed below the white line. The stop loss is placed at the recent swing high, and the trade is exited when a green regression candle appears. It’s like playing a game of chess, where strategic moves and counter-moves determine the outcome.
Backtesting the Strategy
Backtesting is a vital step in validating any trading strategy. It’s akin to a dress rehearsal before the actual performance. In this case, the strategy was backtested on 100 trades over a 3-month period, starting with an account balance of $1000 and risking 2% per trade.
The results were quite revealing. The strategy achieved a win rate of 39% and a profit and loss (PnL) of 14%. After 100 trades, the account balance increased to $1140. The largest profit trade was 17%, and the largest loss trade was 7%. The strategy had 4 consecutive wins and 10 consecutive losses, ranking 26th out of 36 strategies with 4 points.
The Strategy in the Real World
While backtesting provides a controlled environment to test the effectiveness of a trading strategy, it’s essential to understand how this strategy performs in the unpredictable and often volatile real-world trading scenarios. The Best Free Tradingview Indicator Strategy for 2023 shines in its versatility, allowing it to be applied across different assets and timeframes.
Versatility Across Assets and Timeframes
One of the standout features of this strategy is its adaptability. It can be applied to various assets, from stocks like Apple to cryptocurrencies like Bitcoin. This flexibility is a significant advantage for traders who deal with multiple assets in their portfolio.
For instance, a trader could apply this strategy to the Apple 5-minute chart for quick, short-term trades throughout the day. On the other hand, the same strategy could be used on the Bitcoin 1-hour chart for longer-term trades, capitalizing on larger market movements. This adaptability makes it a potentially valuable tool for a wide range of traders, from day traders to swing traders and even long-term investors.

Adapting to Changing Market Conditions
However, it’s important to remember that no strategy is foolproof. Market conditions can change rapidly due to a multitude of factors, from economic news releases to geopolitical events and even changes in market sentiment. What works today may not work tomorrow, and a strategy that yields profits in one market condition may lead to losses in another.
For instance, during a trending market, this strategy could provide numerous profitable trading opportunities as the market makes consistent moves in one direction. However, in a ranging or volatile market, the same strategy might give false signals, leading to potential losses.
Therefore, traders should always be prepared to adjust their strategies as needed. This could involve tweaking the settings of the indicators, changing the assets or timeframes being traded, or even temporarily sidelining the strategy during certain market conditions.
Risk Management
Moreover, like any trading strategy, the Best Free Tradingview Indicator Strategy for 2023 comes with its risks. Even with a win rate of 39% from backtesting, there will be losing trades. Traders must have a solid risk management plan in place. This includes setting a stop loss for every trade to limit potential losses, risking only a small percentage of the trading account on each trade, and regularly reviewing and adjusting the trading strategy as necessary.
Conclusion
In conclusion, the Best Free Tradingview Indicator Strategy for 2023 is a promising tool for traders seeking a versatile and adaptable approach to trading. Its simplicity belies its effectiveness, offering a unique perspective on trading that can be tailored to suit various assets and timeframes.
However, as with any strategy, it’s not without its risks. Traders should always backtest and adjust the strategy to fit their trading style and risk tolerance. After all, in the world of trading, there’s no one-size-fits-all solution. But with careful application and a deep understanding of its mechanics, this strategy could prove to be a valuable addition to any trader’s toolkit.
Ainu Token aims to offer impartial and trustworthy information on cryptocurrency, finance, trading, and shares. However, we don't provide financial advice and recommend users to conduct their own studies and thorough checks.
Comments (No)