In the ever-evolving, high-stakes world of trading, a robust strategy can be the difference between success and failure. Among the plethora of trading strategies that have emerged, the Trade Beta Strategy has been garnering significant attention. This strategy, with its audacious claim of turning a modest $100 into a staggering $250,000 in just six months, has intrigued traders worldwide. But does it truly deliver on its promise? This comprehensive guide aims to dissect and demystify the Trade Beta Strategy.
The Trade Beta Strategy: A Comprehensive Overview
The Trade Beta Strategy is a trading methodology that has been making waves in the trading community for its simplicity and versatility. It’s a strategy that is not only accessible to beginners but also offers a wide range of applications, from forex and stocks to crypto trading. The strategy is built around two free Tradingview indicators: Bollinger Bands and Squeeze Momentum by LazyBear. But what makes it stand out from the sea of trading strategies available? Let’s dive deeper into its mechanics and understand its unique features.
The Trade Beta Strategy: A Versatile Approach
One of the most appealing aspects of the Trade Beta Strategy is its versatility. It’s not limited to a specific market or type of trading. Whether you’re interested in forex, stocks, or crypto, this strategy can be applied. This flexibility makes it an excellent choice for traders who operate in multiple markets or those who want to diversify their trading portfolio. It’s a one-size-fits-all approach that caters to various trading preferences and styles.
Bollinger Bands: The Core of the Strategy
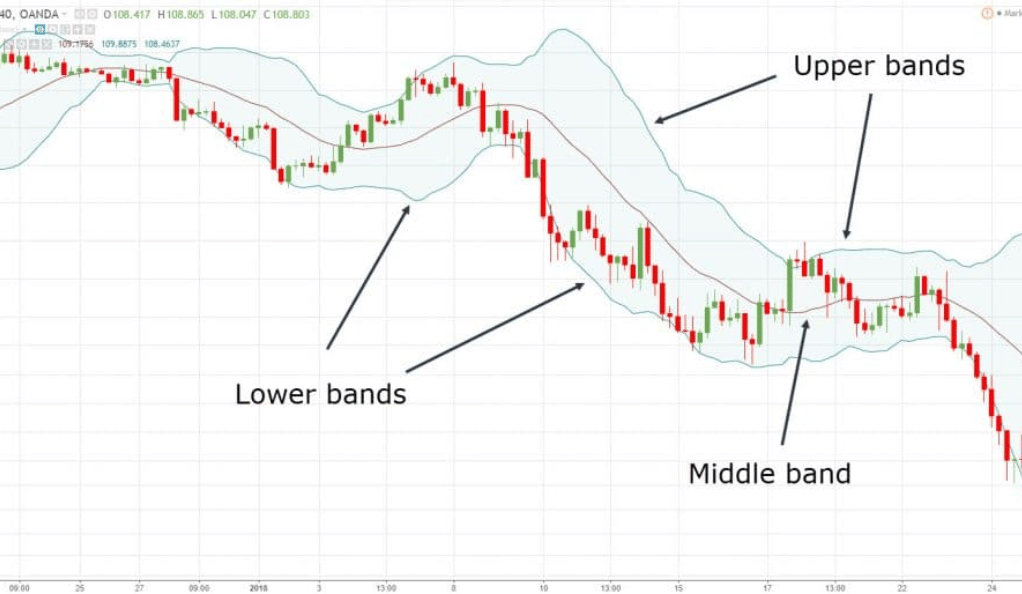
At the heart of the Trade Beta Strategy are the Bollinger Bands. This technical analysis tool, developed by John Bollinger, is designed to provide a relative definition of high and low prices of a market. The bands are a volatility indicator that adapts to changing market conditions. They consist of a middle band (simple moving average) with an upper and lower band that are standard deviations away from the middle band.
In the Trade Beta Strategy, the Bollinger Bands are used to identify potential entry and exit points for trades. When the price of an asset moves closer to the upper band, it’s considered overbought, indicating a potential selling point. Conversely, when the price moves closer to the lower band, it’s considered oversold, signaling a potential buying point.
Squeeze Momentum Indicator: The Strategy’s Secret Weapon
Complementing the Bollinger Bands in the Trade Beta Strategy is the Squeeze Momentum Indicator by LazyBear. This indicator is designed to identify periods of low volatility, or “squeeze,” and high volatility, or “release,” in a market.
In the context of the Trade Beta Strategy, the Squeeze Momentum Indicator is used to confirm the entry signals identified by the Bollinger Bands. When the indicator shows a squeeze, it’s a sign that the market is in a low volatility period and a significant price movement may be on the horizon. When the squeeze ends, or “releases,” it can signal the start of a new price trend, providing a potential entry point for a trade.
The Trade Beta Strategy: A Unique Blend of Indicators
What sets the Trade Beta Strategy apart from other trading strategies is its unique blend of indicators. By combining the Bollinger Bands’ ability to identify potential entry and exit points with the Squeeze Momentum Indicator’s ability to detect periods of low and high volatility, the strategy provides traders with a comprehensive toolkit for navigating the markets.
This combination allows traders to identify potential trading opportunities and confirm these signals with a secondary indicator, increasing the strategy’s reliability. It’s a methodical approach that provides a structured framework for making trading decisions, reducing the reliance on guesswork and intuition.
Applying the Strategy: Short Positions
To grasp the workings of the Trade Beta Strategy, let’s first explore its approach to short positions. On a 5-minute timeframe, a valid short entry signal is spotted when a bullish candle closes above the upper Bollinger Band, accompanied by a green Squeeze Histogram printed above a predetermined level. The exit signal is triggered when the first green histogram falls below this level. This approach allows traders to capitalize on potential downturns in the market, providing opportunities for profit even in bearish conditions.
Applying the Strategy: Long Positions
For long positions, the strategy seeks a bearish candle that has closed below the lower Bollinger Band on the 5-minute timeframe. To affirm the entry signal, a red histogram must be printed below a specific level. The exit signal is signaled when a pink line emerges on the chart. This approach allows traders to take advantage of potential upturns in the market, providing opportunities for profit in bullish conditions.
The Timeframe Switching Technique

One of the unique aspects of the Trade Beta Strategy is the use of a technique known as timeframe switching. This method involves alternating between the 5-minute and 1-minute timeframes during the trading process. While it adds a layer of complexity to the strategy, it also provides traders with a more nuanced control over their trades. Let’s delve deeper into this technique and understand how it enhances the Trade Beta Strategy.
Timeframe Switching: A Two-Pronged Approach
The timeframe switching technique is a two-pronged approach that utilizes different timeframes for different stages of the trading process. The 5-minute timeframe is used for identifying trading signals, while the 1-minute timeframe is used for executing trades.
The 5-minute timeframe is longer and provides a broader view of the market. It’s used to identify potential trading signals as it offers a more reliable picture of the market trends. The signals identified on this timeframe are less likely to be false signals, which can often occur in shorter timeframes due to market noise.
On the other hand, the 1-minute timeframe is shorter and provides a more detailed view of the market. It’s used for executing trades as it allows traders to pinpoint the exact moment to enter or exit a trade. This granularity can potentially lead to better trade execution and improved trading results.
The Benefits of Timeframe Switching
The timeframe switching technique offers several benefits. First, it allows traders to leverage the strengths of both long and short timeframes. The 5-minute timeframe provides a reliable overview of the market trends, reducing the likelihood of false signals. The 1-minute timeframe, on the other hand, offers a detailed view of the market, allowing for precise trade execution.
Second, this technique gives traders more control over their trades. By using different timeframes for signal identification and trade execution, traders can fine-tune their entry and exit points. This level of control can potentially increase the chances of successful trades.
Finally, the timeframe switching technique adds a layer of complexity to the Trade Beta Strategy, making it a more sophisticated trading approach. This complexity can be appealing to traders who are looking for a strategy that goes beyond the basics.
Backtesting the Strategy: A Reality Check
Backtesting is a crucial step in assessing the efficacy of any trading strategy. The results were somewhat sobering. A win rate of 49% and a profit of 1.49% were achieved. The account grew from $1,000 to $1,014 after 100 trades. These results underscore the importance of backtesting any trading strategy before implementing it in live trading.
The Verdict

While the Trade Beta Strategy sounds promising on paper, it’s essential to remember that trading is inherently risky. It ranked 34 out of 43 in their strategy ranking, with a daily gain of a mere 0.08%. These results serve as a reminder that while a strategy may sound promising, its real-world performance may not always live up to the hype.
Conclusion
In conclusion, the Trade Beta Strategy offers a unique approach to trading, amalgamating two popular indicators and employing a switching timeframe technique. However, as with any trading strategy, it’s crucial to conduct thorough research and consider seeking advice from a financial advisor before making any trading decisions. In the world of trading, there’s no such thing as a surefire win. Always remember, due diligence is your best defense in the unpredictable world of trading. It’s not just about finding a strategy that works; it’s about finding a strategy that works for you.
Ainu Token aims to offer impartial and trustworthy information on cryptocurrency, finance, trading, and shares. However, we don't provide financial advice and recommend users to conduct their own studies and thorough checks.
Comments (No)