In the world of Forex trading, success often hinges on the ability to make accurate predictions and strategic decisions. One tool that has proven to be a game-changer for many traders is the Fibonacci retracement strategy. But what exactly is this strategy, and how can it be used to maximize trading success? Let’s dive in and find out.
Understanding the Fibonacci Retracement Strategy
The Fibonacci retracement strategy is a widely used tool in the world of technical analysis, particularly in Forex trading. Named after the Italian mathematician Leonardo Fibonacci, this strategy is based on a sequence of numbers where each number is the sum of the two preceding ones, starting from 0 and 1. The sequence goes as follows: 0, 1, 1, 2, 3, 5, 8, 13, 21, 34, and so forth.
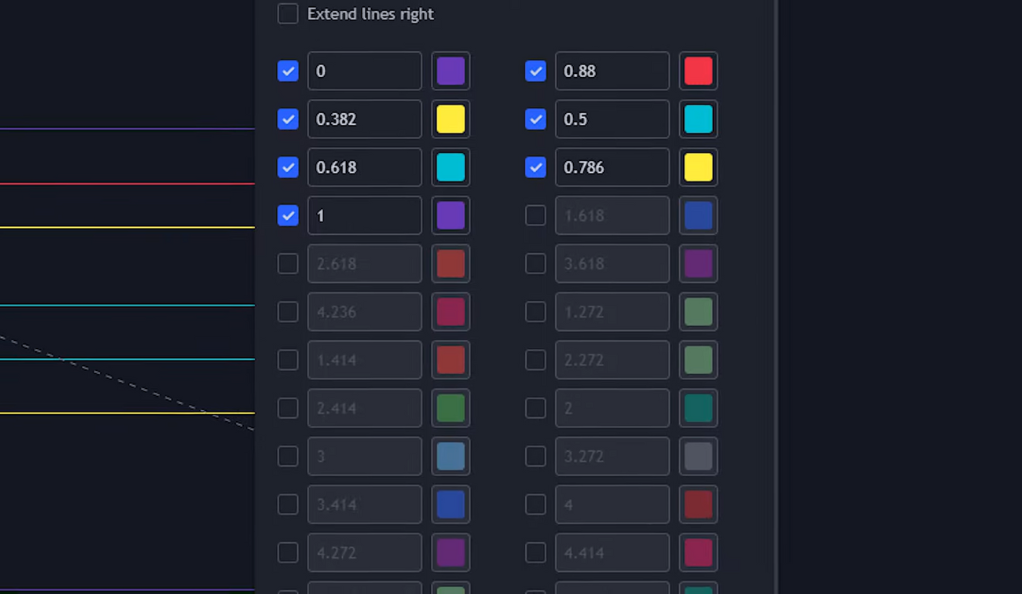
In trading, the Fibonacci retracement levels are derived from this sequence and are used to predict potential price retracement levels. These levels are calculated by taking the vertical distance between an asset’s high and low points, and then dividing this distance by key Fibonacci ratios: 0, 0.382, 0.5, 0.618, 0.786, 0.88, and 1.
The Fibonacci retracement strategy is based on the idea that markets will retrace a predictable portion of a move, after which they will continue to move in the original direction. Traders use these retracement levels as potential support and resistance areas where the price could potentially reverse.
Why Fibonacci?
The Fibonacci sequence is not just a random series of numbers. It has unique properties and appears in many areas of nature, mathematics, and art. For instance, the arrangement of leaves on a stem, the branching of trees, the spirals of a shell, and even the shape of galaxies all follow the Fibonacci sequence.
In trading, the Fibonacci ratios derived from this sequence are used because they are seen to capture human behavior. Traders, whether consciously or subconsciously, tend to react at these levels because they are widely watched and respected. The Fibonacci ratios provide traders with a sense of where the price might potentially find support or resistance in the future.
The Four-Step Fibonacci Trading Strategy
This strategy involves four key steps, labeled A, B, C, and D.
Step A: Identify the Trend
The first step in applying the Fibonacci retracement strategy is to identify a significant price trend on the chart. This could be a bullish (upward) or bearish (downward) trend. Once a trend is identified, the Fibonacci levels are drawn from the bottom to the top of the trend for a bullish trend and from top to bottom for a bearish trend. This forms the foundation for the next steps.
Step B: The First Rectangle
The next step is to draw a rectangle between the 0.5 and 0.618 Fibonacci levels. This area is considered a crucial zone where the price should enter without exceeding it. If the price goes beyond this rectangle, the trade is considered invalid. This rectangle serves as the first potential reversal zone where traders look for price reactions.
Step C: The Second Rectangle
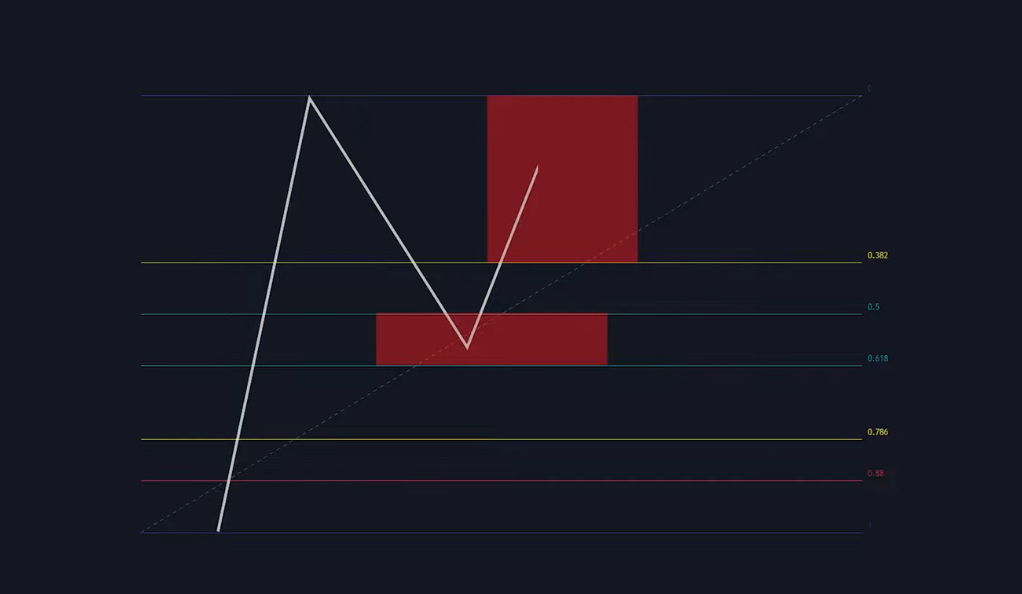
The third step involves drawing another rectangle from the 0.382 to 0 Fibonacci level. Similar to step B, the price should enter this area without surpassing the 0 level. This second rectangle serves as another potential reversal zone where traders look for price reactions.
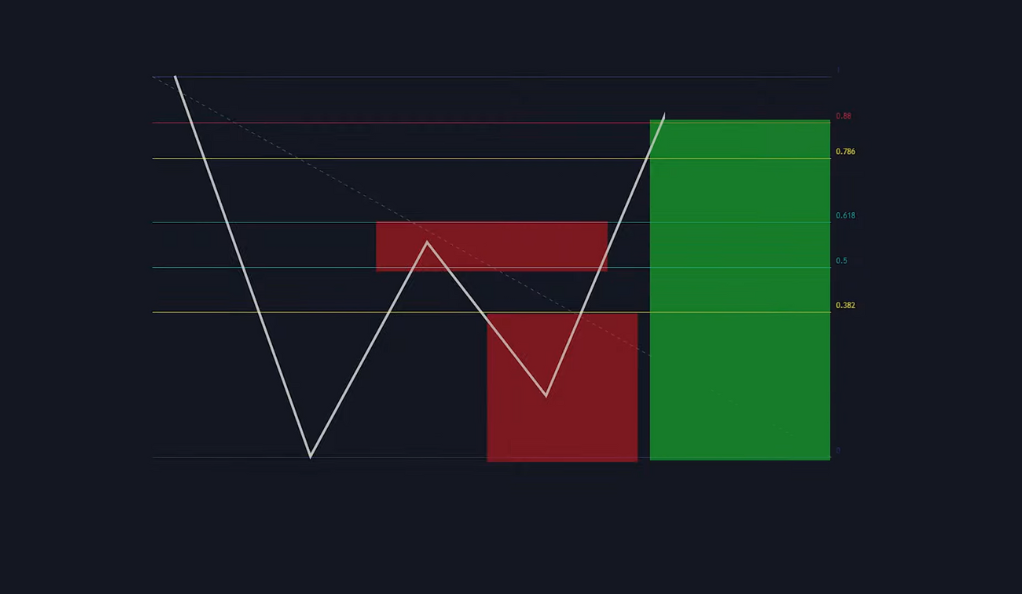
Step D: The Entry Point
If all conditions from the previous steps are met, the final step is to enter the trade once the price reaches the 0.88 Fibonacci level. The take profit is placed at the top of the move for a bullish trend and at the bottom of the move for a bearish trend. The stop loss is set right below the low of the entire move for a bullish trend and above the high for a bearish trend. This final step is where the trade is executed, based on the price reactions at the Fibonacci levels.
Applying the Strategy to Short Trades
The Fibonacci retracement strategy is not only applicable to long trades but also to short trades. The process is similar but executed in reverse. Here’s a detailed breakdown of how to apply this strategy to short trades:
Identifying a Bearish Trend

The first step is to identify a significant bearish trend. A bearish trend, also known as a downtrend, is characterized by a series of lower highs and lower lows. This is a market scenario where prices are falling, and it’s an opportunity for traders to profit from selling or ‘going short’. Once a bearish trend is identified, you draw the Fibonacci levels from the top to the bottom of the trend. This is the opposite of what you do in a bullish trend.
Identifying the Entry Point
If all conditions from the previous steps are met, the final step is to enter the trade once the price reaches the 0.88 Fibonacci level. This is the point where you expect the price to resume its original bearish trend. The take profit is placed at the bottom of the move, and the stop loss is set right above the high of the entire move. This final step is where the short trade is executed, based on the price reactions at the Fibonacci levels.
Backtesting the Strategy
Backtesting is a critical step in validating the effectiveness of any trading strategy. It involves applying the strategy to historical market data to see how it would have performed in the past. Here’s a more detailed look at how to backtest the Fibonacci retracement strategy:
Collecting Historical Data
The first step in backtesting is to gather historical price data for the asset you’re interested in trading. This data should include the opening, closing, high, and low prices for each time period you’re analyzing. The more data you have, the more robust your backtest will be. It’s also important to ensure that the data is clean and free of errors.
Applying the Strategy
Once you have your data, you can start applying the Fibonacci retracement strategy. This involves identifying significant trends, drawing the Fibonacci levels and rectangles, and determining the entry and exit points according to the rules of the strategy. You then record the results of each trade, including whether it was a win or a loss and how much profit or loss it generated.
Analyzing the Results
After applying the strategy to all the data, you can analyze the results. This involves calculating key performance metrics such as the win rate (the percentage of trades that were profitable), the average profit or loss per trade, the maximum drawdown (the largest drop in value from a peak), and the profit factor (the ratio of gross profit to gross loss).
In the case of the Fibonacci retracement strategy, it was backtested with 77 trades, resulting in a 62% win rate and a profit of 1,040%. These results suggest that the strategy has the potential to be profitable.
Refining the Strategy
Backtesting is not a one-time process. It’s something that traders do continuously to refine their strategies and adapt to changing market conditions. If the backtest results are not satisfactory, you might need to adjust the strategy. This could involve changing the Fibonacci levels used, modifying the entry and exit rules, or incorporating additional indicators.
Additional Tips for Success
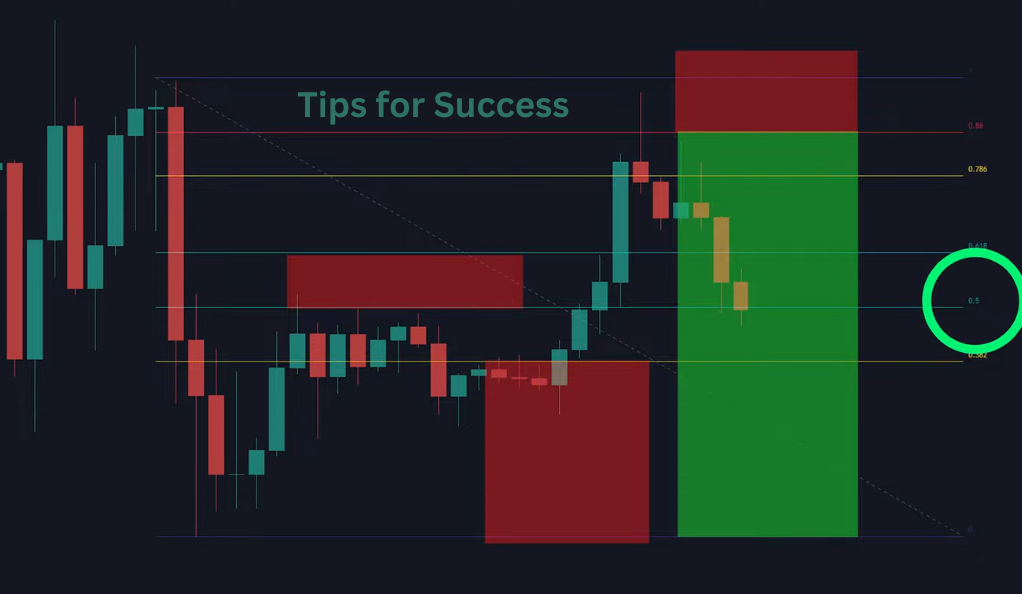
To further enhance the strategy’s effectiveness, consider taking partial profits at the 0.5 Fibonacci level. This can significantly increase the strategy’s win rate and profit rate. Additionally, incorporating a specific stop loss strategy can reduce the number of trades lost. A stop loss is an order placed with a broker to buy or sell once the stock reaches a certain price, designed to limit an investor’s loss on a security position. By setting a stop loss order, traders can limit their losses and manage their investments more effectively.
Conclusion
The Fibonacci retracement strategy is a powerful tool for Forex traders. By understanding and applying this strategy, traders can make more informed decisions and increase their chances of success. However, like any trading strategy, it’s essential to practice and backtest before fully implementing it into your trading routine. Happy trading!
Ainu Token aims to offer impartial and trustworthy information on cryptocurrency, finance, trading, and shares. However, we don't provide financial advice and recommend users to conduct their own studies and thorough checks.
Comments (No)