Trading in the financial markets can indeed be overwhelming, particularly for newcomers. Nevertheless, turning it into a profitable endeavor is possible with the right approach and tools. One effective strategy involves harnessing the power of three key TradingView indicators: the Coral Trend Indicator, the Swing Arm ATR Trend Indicator, and the Angle Attack Follow Line. Combining these indicators can provide valuable insights into market trends and potential entry and exit points, empowering traders to make more informed decisions and optimize their profits.
The Coral Trend Indicator helps identify the prevailing market direction by displaying a color-coded trend line, offering clarity amidst market noise. The Swing Arm ATR Trend Indicator provides essential information about market volatility, enabling traders to gauge potential risks and rewards. Lastly, the Angle Attack Follow Line enhances the strategy by offering dynamic support and resistance levels, allowing traders to adjust their positions in response to changing market conditions. By utilizing these indicators collectively, beginners can build a solid foundation for their trading journey and improve their chances of success in the dynamic and competitive world of financial markets.
The Power of Three: Understanding the Indicators
Before embarking on the trading strategy, a comprehensive grasp of the three key indicators involved is essential. The first is the Coral Trend Indicator, a valuable tool that aids traders in determining the prevailing trend of a market. This indicator presents a color-coded trend line, which serves to filter out market noise and highlight the primary direction of price movement. Armed with this information, traders can better align their positions with the overall market sentiment, increasing the likelihood of profitable trades.
Next is the Swing Arm ATR Trend Indicator, which pinpoints entry and exit points by analyzing market volatility through the Average True Range (ATR). It optimizes risk management and maximizes gains. The final component is the Angle Attack Follow Line, validating signals from the Coral Trend Indicator and Swing Arm ATR Trend Indicator. By providing dynamic support and resistance levels, it confirms trend reversals or continuations, enhancing the overall effectiveness of the strategy.
Coral Trend Indicator
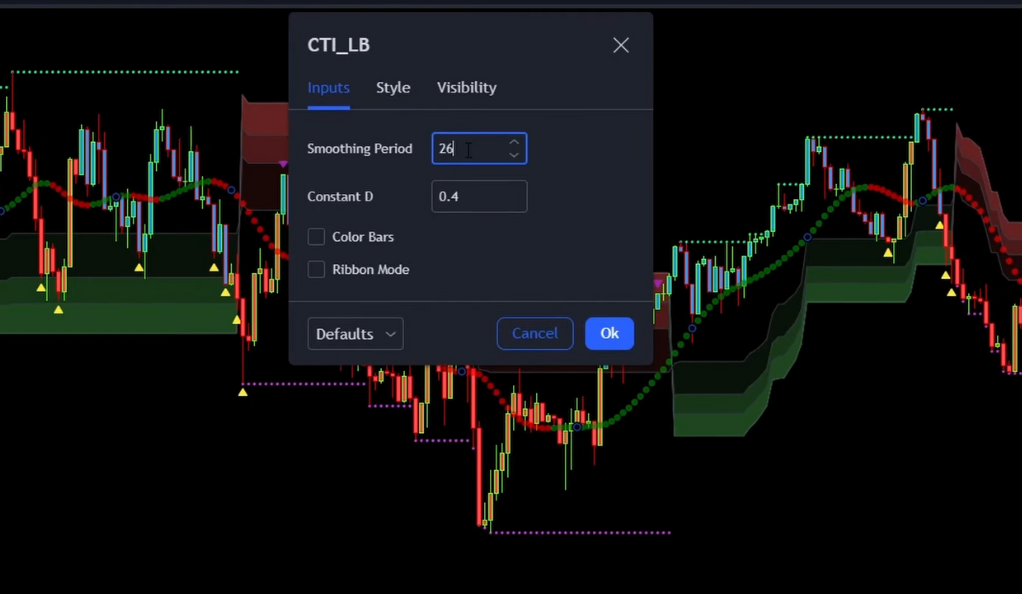
The Coral Trend Indicator is a powerful tool used in financial markets to identify the prevailing trend. It presents a color-coded trend line on price charts, which helps traders filter out noise and gain a clear understanding of the market’s direction. By setting the smoothing period to 26 and enabling the color bars option, the indicator becomes even more effective in providing reliable insights. The green and red bars indicate bullish and bearish trends, respectively, guiding traders in making informed decisions about when to enter or exit positions. With its ability to cut through market fluctuations, the Coral Trend Indicator proves to be a valuable asset for traders seeking to navigate the complexities of financial markets and maximize their profits.
SwingArm ATR trend indicator
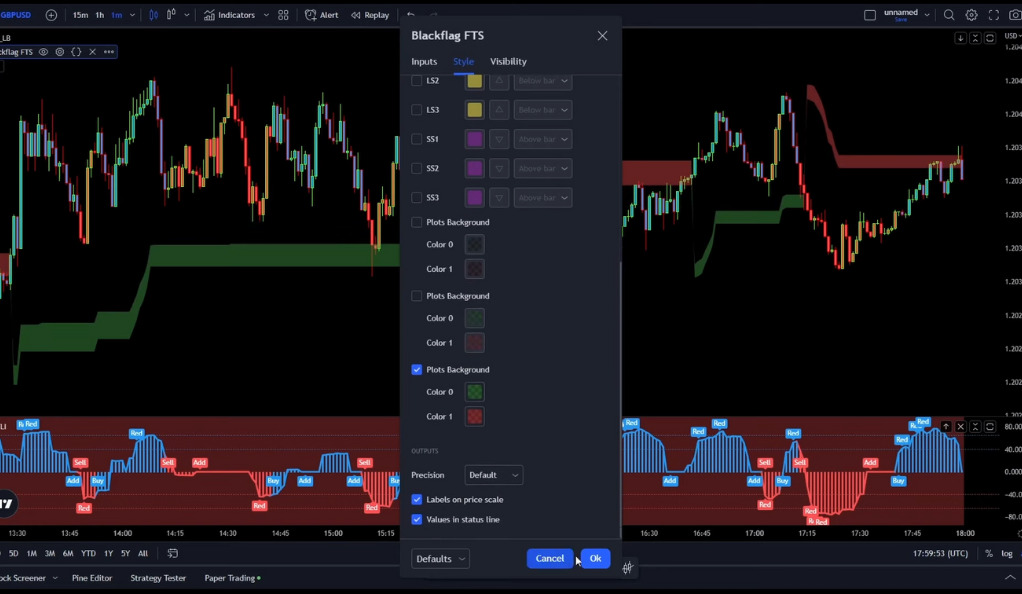
The SwingArm ATR Trend Indicator, also known as the Black Flag plot, is a powerful tool used in financial markets to pinpoint potential entry and exit points for trades. It leverages the Average True Range (ATR) to analyze market volatility, enabling traders to identify opportune moments to enter or exit positions. By adjusting the ATR period to 12 and the ATR factor to 6, traders can fine-tune the indicator’s sensitivity, filtering out noise and identifying more robust trading opportunities. With its ability to optimize risk management and maximize potential gains, the SwingArm ATR Trend Indicator proves to be a valuable asset for traders seeking to enhance their trading strategies and navigate the dynamic world of finance with greater confidence.
Angle Attack Follow line indicator
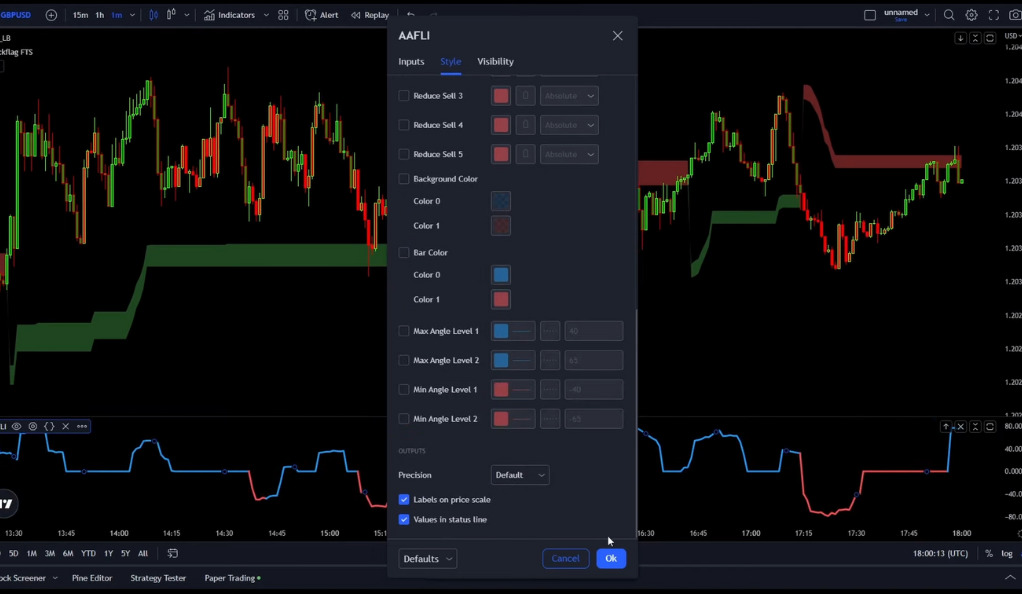
The Angle Attack Follow Line Indicator is a valuable tool used in financial markets to validate signals generated by other indicators, such as the Coral Trend Indicator and the SwingArm ATR Trend Indicator. By offering dynamic support and resistance levels, this indicator aids traders in making well-informed decisions about potential trend reversals or continuations. Setting the period to 50 allows the indicator to encompass a significant amount of historical data, resulting in smoother support and resistance lines for a more reliable analysis of price levels. The Angle Attack Follow Line Indicator plays a crucial role in enhancing the overall effectiveness of trading strategies, empowering traders to make confident decisions and navigate the complexities of financial markets with greater accuracy and precision.
Setting Up the Indicators
To effectively execute this trading strategy, it’s crucial to configure the indicators with the appropriate settings. Beginning with the Coral Trend Indicator, traders should adjust the smoothing period to 26 and enable the color bars option. By setting the smoothing period to 26, the indicator will take into account a more extended timeframe, providing a clearer and more reliable assessment of the market’s overall trend. Enabling the color bars option allows traders to visualize the trend direction easily, making it simpler to identify bullish (green) or bearish (red) market conditions.
To implement the strategy, adjust the Swing Arm ATR Trend Indicator’s ATR period to 12 and the ATR factor to 6. This fine-tunes sensitivity, filtering out noise for better entry and exit points. For the Angle Attack Follow Line, set the period to 50, smoothing support and resistance lines and improving overall analysis. By optimizing these indicators, traders enhance their ability to make well-informed decisions and increase their chances of success in financial markets.
The Strategy: Going Long
The strategy for going long in the financial markets is based on three key conditions that must align. Firstly, the Swing Arm ATR Trend Indicator should display a green signal, indicating a favorable trend direction for long positions. Secondly, traders should look for a change in bar color from red to green, specifically targeting the first green candle after a series of red ones. This change signifies a potential shift in market sentiment towards bullish territory, further supporting the long entry. Lastly, the Angle Attack Follow Line should also display a green signal, confirming the overall positive trend direction and providing additional validation for the long trade entry.
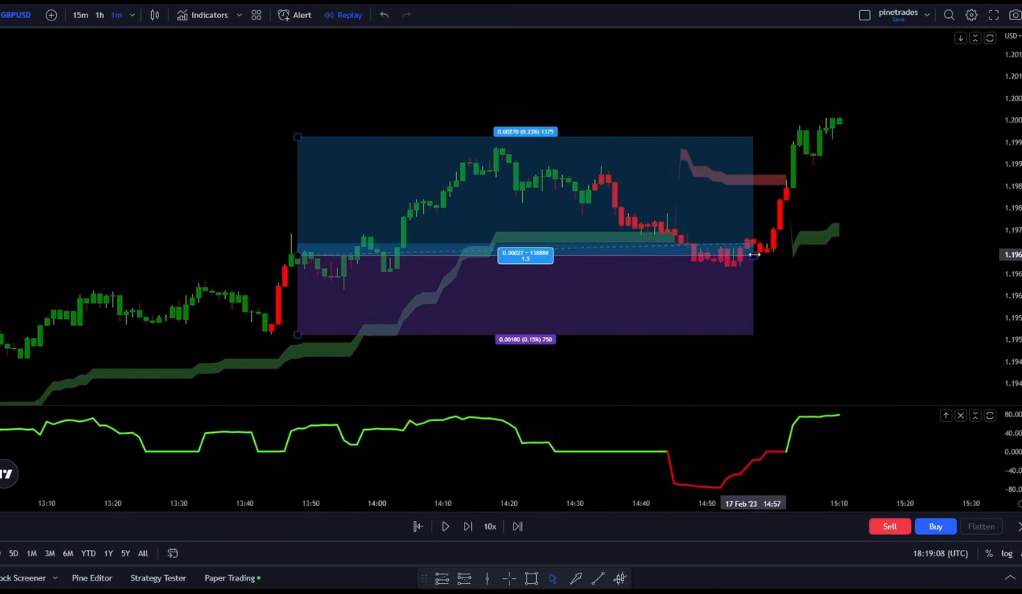
When all three conditions are met, traders can confidently enter a long trade, anticipating potential price appreciation. To manage risk effectively, setting the stop loss at the recent swing low offers protection against adverse market movements. Additionally, targeting a risk to reward ratio from 1 to 1.5 ensures that potential gains outweigh potential losses, providing a balanced approach to profit optimization.
By adhering to this strategy, traders seek to optimize their entry points for long positions and improve their risk management techniques, increasing the likelihood of successful and profitable trades in the dynamic and competitive landscape of financial markets.
The Strategy: Going Short
The strategy for going short in the financial markets is the mirror image of entering a long position. Firstly, the Swing Arm ATR Trend Indicator should indicate a red signal, signaling a bearish trend direction for short positions. Secondly, traders should look for a change in bar color from green to red, specifically targeting the first red candle after a series of green ones. This change indicates a potential shift in market sentiment towards bearish territory, further supporting the short entry. Additionally, the Angle Attack Follow Line should also display a red signal, confirming the overall negative trend direction and providing further validation for the short trade entry.
Once all three conditions are met, traders can confidently enter a short trade, anticipating potential price declines. To manage risk effectively, setting the stop loss at the recent swing high offers protection against adverse market movements. Moreover, targeting a risk to reward ratio from 1 to 1.5 ensures that potential gains outweigh potential losses, maintaining a balanced approach to profit optimization.
Backtesting the Strategy
Backtesting serves as a vital process to assess the effectiveness of a trading strategy. Using the Traders Edge app, the aforementioned strategy was subjected to backtesting with an initial balance of $1,000 and a leverage of 2x. The backtesting involved executing the strategy over 100 trades to evaluate its performance and potential profitability.
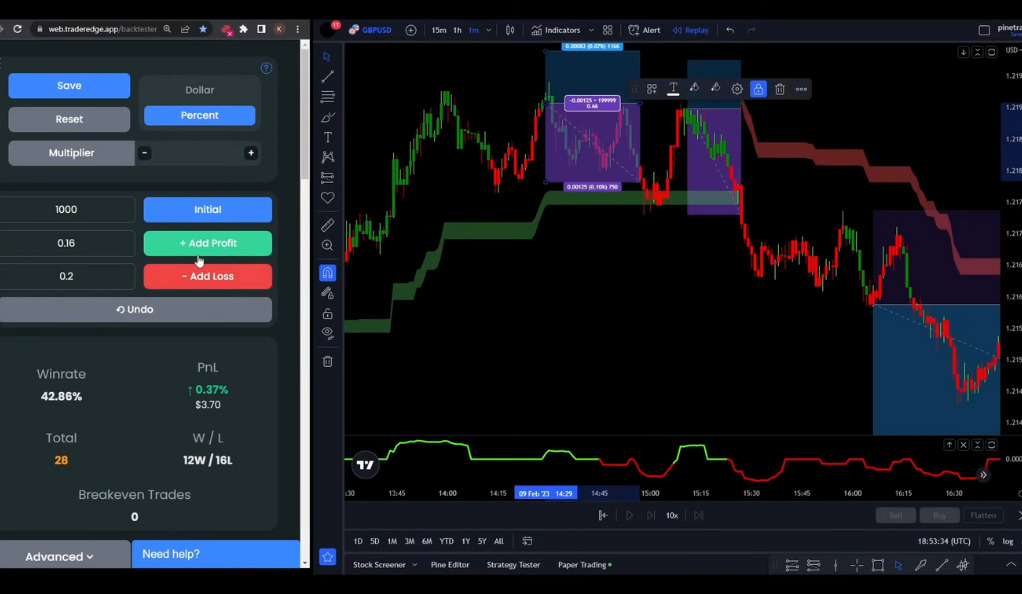
The results of the backtest revealed a win rate of 44%, indicating that the strategy was successful in 44 out of the 100 trades executed. While a win rate of 44% may seem modest, it is crucial to consider the overall context and risk management involved in the strategy. The strategy’s profit after 100 trades was calculated to be 0.26%, which might appear relatively small. However, it is essential to remember that trading success often depends on consistent execution and risk control rather than achieving exceptionally high returns in every single trade.
Despite the relatively modest profit percentage, the backtest provides valuable insights into the strategy’s viability. Traders can use this data to refine and optimize the strategy further, fine-tuning entry and exit points, and adjusting risk management techniques. Additionally, it helps traders set realistic expectations and understand the potential risks associated with the chosen approach. Through continuous backtesting and refinement, traders can improve the strategy’s performance over time, potentially enhancing profitability and achieving long-term success in the challenging and dynamic landscape of financial markets.
Conclusion
Trading is a journey that requires patience, discipline, and the right strategy. The three-indicator strategy discussed here offers a simple yet effective approach to trading. However, like any strategy, it’s not foolproof. Always remember to backtest your strategies, manage your risk, and never stop learning. Happy trading!
Ainu Token aims to offer impartial and trustworthy information on cryptocurrency, finance, trading, and shares. However, we don't provide financial advice and recommend users to conduct their own studies and thorough checks.
Comments (No)