In the dynamic world of trading, backtesting is not just a strategy; it’s a necessity. It’s the compass that guides traders through the unpredictable seas of the market, providing insights into the potential effectiveness of their strategies. Today, we’re going to delve deeper into this fascinating world, focusing on pivot indicators. We’ll explore two specific types: the Pivot Point Super Trend and the Pivot on Pivot Reversal Strategy. We’ll dissect how these indicators work, the process of backtesting them, and the intriguing results obtained. So, buckle up and get ready to uncover some trading secrets that could potentially revolutionize your trading game!
Understanding Pivot Indicators
Before we delve into the specifics, let’s take a moment to understand what pivot indicators are. In the realm of technical analysis, pivot indicators are invaluable tools used by traders to determine potential support and resistance levels. They are calculated using the high, low, and closing prices of the previous trading period. These indicators serve as a roadmap, providing traders with potential points of entry and exit. Now, let’s explore the two types we’re focusing on today.
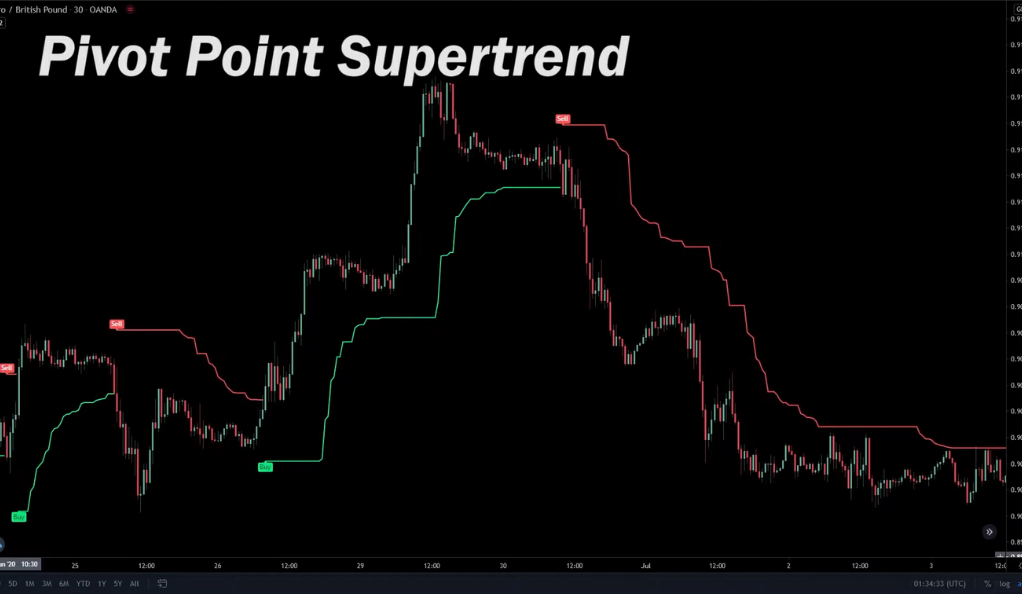
- Pivot Point Super Trend
The Pivot Point Super Trend, a brainchild of Lone Sum, is a unique pivot indicator that stands out from the crowd. It’s similar to the Super Trend indicator but is based on pivot points. Imagine the Super Trend indicator got a pivot point upgrade! This indicator provides signals for both buying and selling, helping traders navigate the market’s twists and turns. - Pivot on Pivot Reversal Strategy
The Pivot on Pivot Reversal Strategy, a creation of Quant Nomad, is another intriguing pivot indicator. This strategy is all about following the signals without setting any take profits or stop loss. It’s like riding a roller coaster without a safety belt, thrilling but risky! This strategy provides traders with signals to enter and exit trades, making it a handy tool for those who prefer to follow the market’s rhythm.
Backtesting the Pivot Point Super Trend
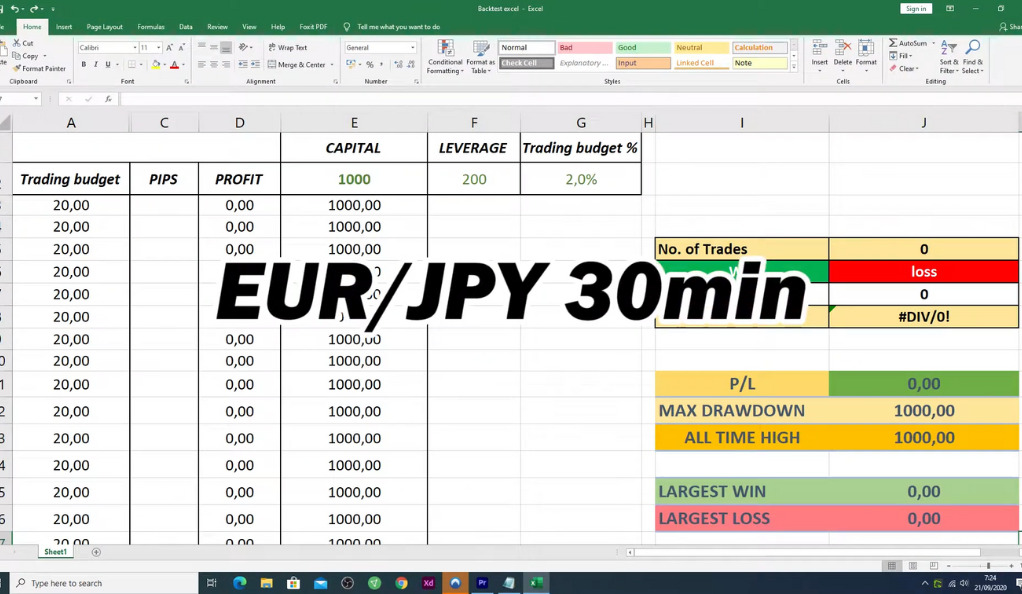
Backtesting the Pivot Point Super Trend was an interesting journey. The backtest was performed on the EUR/JPY 30-minute timeframe with a capital of $1,000 and 200 times leverage per trade. But there was a twist! A rule was added: a max loss of 13 pips per trade. This rule ensured that the loss in this backtest would never exceed 13 pips per trade. This addition was like a safety net, protecting the trader from significant losses.
Backtesting the Pivot on Pivot Reversal Strategy
Backtesting is a common practice in trading that involves using historical data to test a trading strategy. In this scenario, a strategy known as the “Pivot on Pivot Reversal Strategy” was backtested.
The Pivot on Pivot Reversal Strategy is a technical analysis-based trading strategy that leverages pivot points, which are indicators used in market trading to identify potential points of currency price reversals. The main idea is to sell when the price of a currency hits a pivot point from above and buy when the price hits a pivot point from below, assuming that the price will reverse direction.
In the provided scenario, a backtest of this strategy was executed without setting any take profits or stop loss levels.
“Take profit” is a predetermined level at which the trader wants the trade to close in profit. On the other hand, a “stop loss” is a predetermined level at which the trader wants the trade to close if it’s moving against them to limit their loss.
By not setting these levels, the trader allows the position to run indefinitely, only closing when they manually decide to do so. This means that theoretically, the position could run into substantial profit if the market continues to move favorably. However, if the market moves against the trader, the losses could also be substantial because there’s no stop loss to automatically cut the losses at a certain point. Therefore, this approach is risky and can be likened to “walking on a tightrope without a safety net.”
Results of the Backtest
The provided passage is about the results of a backtest, which refers to the process of testing a predictive model or trading system using historical data. Traders, investment firms, and analysts often use backtesting to evaluate the performance of a strategy before it’s implemented in the real market.
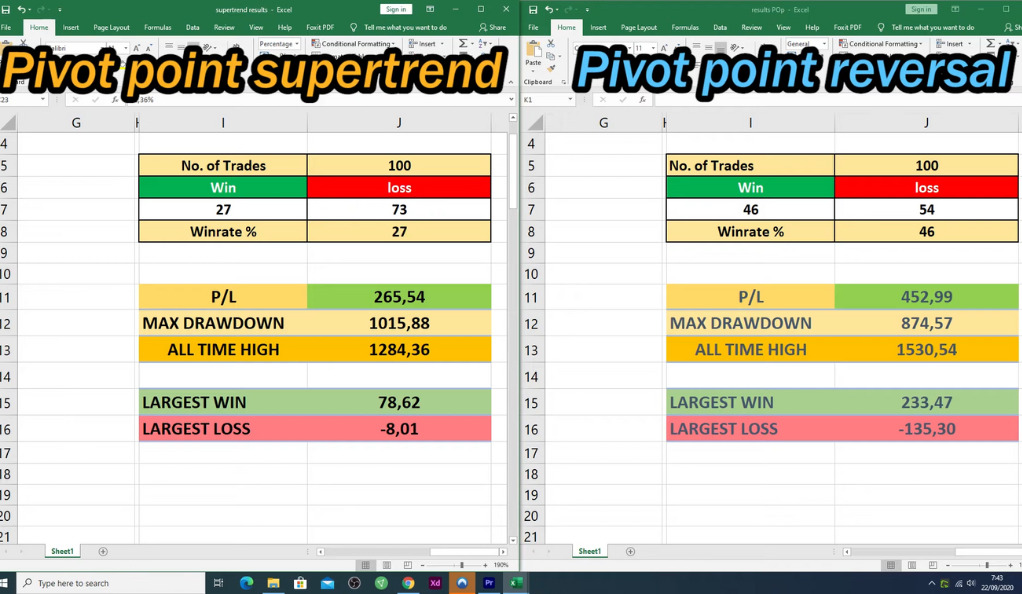
In this case, the backtest demonstrated a surprising outcome. The strategy tested showed a win rate of 46%. This means that almost half the time, the strategy made successful trades or investments. This figure is significant because it helps to assess the strategy’s reliability. A higher win rate usually indicates a more dependable trading strategy, although it’s crucial to consider other factors as well, such as the risk/reward ratio.
The backtest also showed a total profit of $452.99, which means that after all the wins and losses were counted, the strategy was in the green by this amount. This positive figure indicates that the strategy was profitable during the backtesting period.
However, the passage also highlights some downsides of the strategy. The maximum drawdown, or the largest single drop from peak to bottom in the value of a portfolio (before a new peak is achieved), was $874. This is a significant amount and shows the strategy can lead to substantial losses. A high drawdown can be worrying to traders as it indicates potential risk and volatility in the trading system.
Comparing the Two Strategies
The Pivot Point Super Trend and the Pivot on Pivot Reversal Strategy are two different trading strategies used in financial markets. Each strategy has its own unique characteristics and risk-reward profiles, which can make them more or less suitable depending on an individual trader’s risk tolerance and trading goals.
- Pivot Point Super Trend:
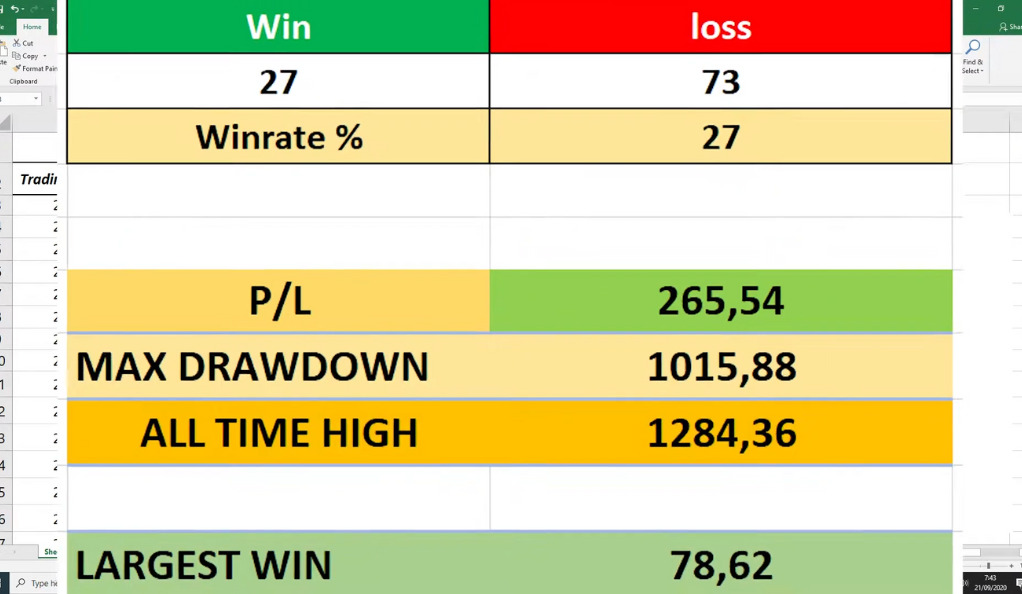
This strategy is characterized by a lower win rate but smaller losses. This means that while the strategy may not result in profitable trades as frequently, when losses do occur, they tend to be smaller. This makes the Pivot Point Super Trend a low risk, medium reward strategy. It’s akin to driving a safe but slow car – you may not reach your destination as quickly, but you’re less likely to encounter a serious accident along the way.
- Pivot on Pivot Reversal Strategy:
This strategy, on the other hand, has a higher win rate but larger losses. This means that while the strategy may result in profitable trades more frequently, when losses do occur, they tend to be larger. This makes the Pivot on Pivot Reversal Strategy a high risk, high reward strategy. It’s like driving a fast but risky sports car – you may reach your destination more quickly, but you’re also more likely to encounter a serious accident along the way.
When deciding between these two strategies, it’s important to consider your own risk tolerance. If you’re more risk-averse, you may prefer the Pivot Point Super Trend strategy, as it offers lower risk but also medium rewards. If you’re more risk-tolerant and are willing to accept larger losses in exchange for the potential for higher rewards, you may prefer the Pivot on Pivot Reversal Strategy.
The Importance of Risk Tolerance in Trading

Risk tolerance is a fundamental aspect of trading that cannot be overlooked. It’s the degree of variability in investment returns that an investor is willing to withstand in their financial planning. Risk tolerance is an integral part of your personal financial landscape, and it’s as unique as your fingerprint. It’s the level of risk you’re willing to accept in pursuit of profit. This concept is crucial because all investments involve some level of risk, including the potential loss of principal, and it’s essential to have a clear understanding of your ability and willingness to endure these ups and downs.
Some traders are thrill-seekers, akin to skydivers or mountain climbers. They’re willing to take on high-risk strategies for the chance of high rewards. They thrive on the adrenaline rush of seeing high returns, and they have the resilience to weather the storms of potential losses. These traders often engage in strategies like day trading or forex trading, where the stakes are high, and so are the potential rewards. They’re the ones who are willing to bet big to win big.
Conclusion
In conclusion, both the Pivot Point Super Trend and the Pivot on Pivot Reversal Strategy have their unique strengths and weaknesses. The key to profitable trading lies in understanding these strategies, backtesting them, and choosing the one that aligns with your risk tolerance. Remember, in the world of trading, there’s no one-size-fits-all strategy. It’s all about finding what works for you. So, are you ready to start backtesting and uncover the strategy that could potentially lead you to trading success? The world of pivot indicators awaits!
Ainu Token aims to offer impartial and trustworthy information on cryptocurrency, finance, trading, and shares. However, we don't provide financial advice and recommend users to conduct their own studies and thorough checks.
Comments (No)