In the world of trading, strategies are the backbone of any successful venture. They provide a roadmap for traders, guiding their decisions and helping them navigate the often unpredictable waters of the financial markets. Among the plethora of strategies that traders employ, one has recently been making waves due to its impressive performance in backtests. This is the TradingView Indicator strategy, which has reportedly made a whopping 658% return.
This strategy is not just a set of rules; it’s a comprehensive approach that combines different elements to maximize potential profits. It involves a specific type of trading, known as scalping, and is applied to a specific market, in this case, the Bitcoin chart. The use of specific indicators, namely the Polynomial Regression Bands + Channel [DW] and the Average Directional Index (ADX), further refines the strategy.
In this article, we aim to delve into the intricacies of the TradingView Indicator strategy. We will explore its key components, the process of its implementation, and the results it has yielded in backtests. By understanding these elements, we can gain insights into why this strategy has been successful and how it might be used effectively in future trading scenarios. So, let’s embark on this journey of discovery and unravel the secrets of the TradingView Indicator strategy.
The Power of Community
The strategy that’s been making waves in the trading community was shared by a YouTuber who recently celebrated a significant milestone. This individual, a beacon of knowledge in the trading world, reached a remarkable 3000 subscribers. This achievement is not just a personal victory, but it also highlights the power of community in the realm of trading.
In trading circles, community plays a pivotal role. It’s a space where traders, both seasoned and novice, come together to share knowledge, experiences, and insights. This collective learning environment can often lead to the discovery of profitable strategies. The success of the TradingView Indicator strategy is a testament to this, having been shared and celebrated within this vibrant community.
The Strategy: A Snapshot
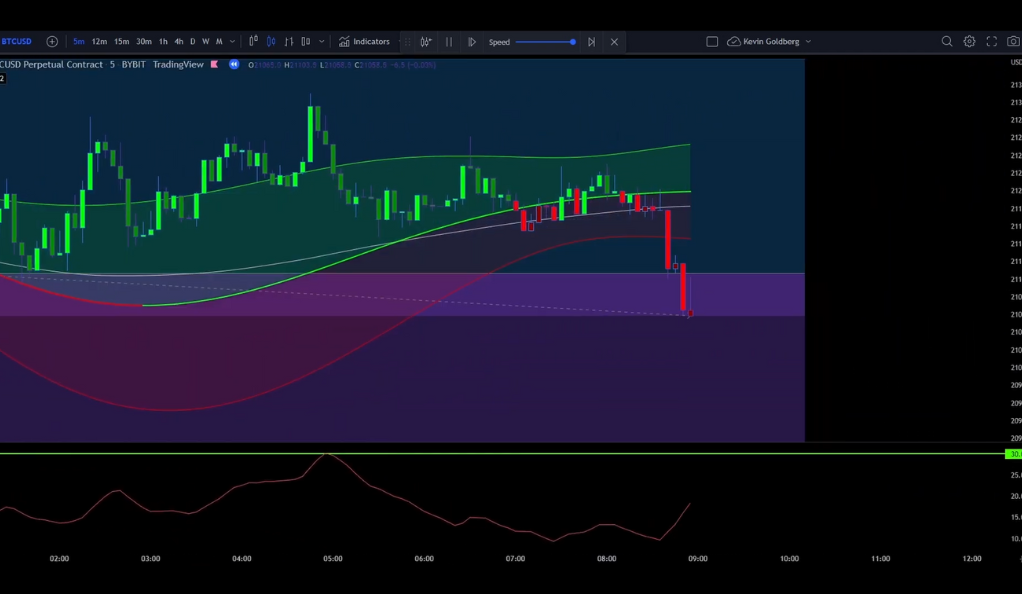
The TradingView Indicator strategy is a unique approach to trading that has been gaining attention in the trading community. At its core, it’s a 5-minute scalping strategy. For those unfamiliar with the term, scalping is a trading style that specializes in profiting off small price changes and making a fast exit from the market. This strategy is particularly applied to the Bitcoin chart, a testament to the growing influence of cryptocurrency in the trading world.
The strategy utilizes two key indicators to guide its implementation. The first is the Polynomial Regression Bands + Channel [DW] by DonovanWall, a tool designed to provide traders with a visual representation of market trends. The second is the Average Directional Index (ADX), a widely used indicator that helps traders determine the strength of a trend. Together, these indicators form the backbone of the TradingView Indicator strategy.
Indicator #1: Polynomial Regression Bands + Channel [DW]
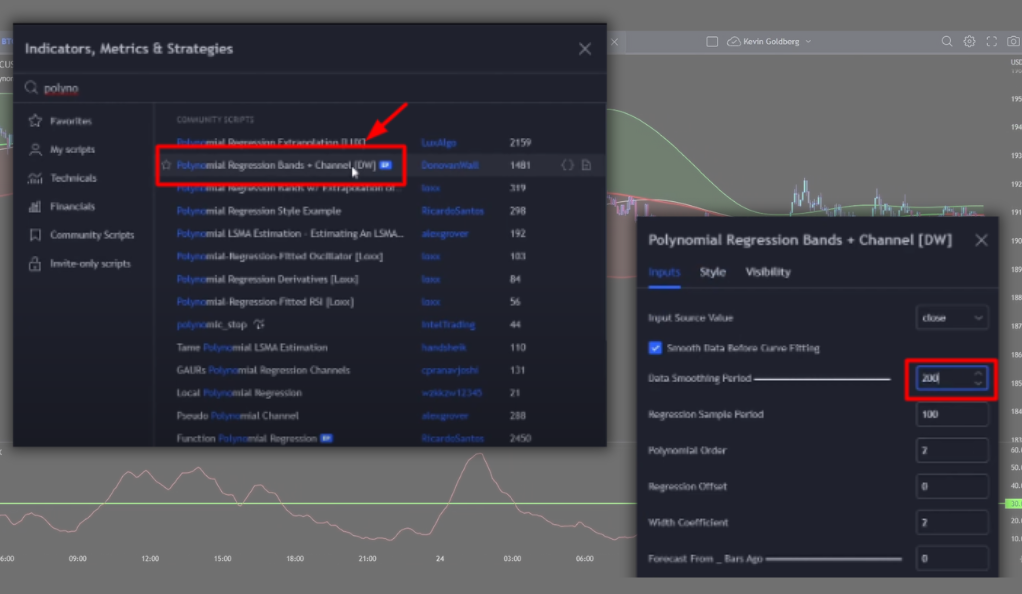
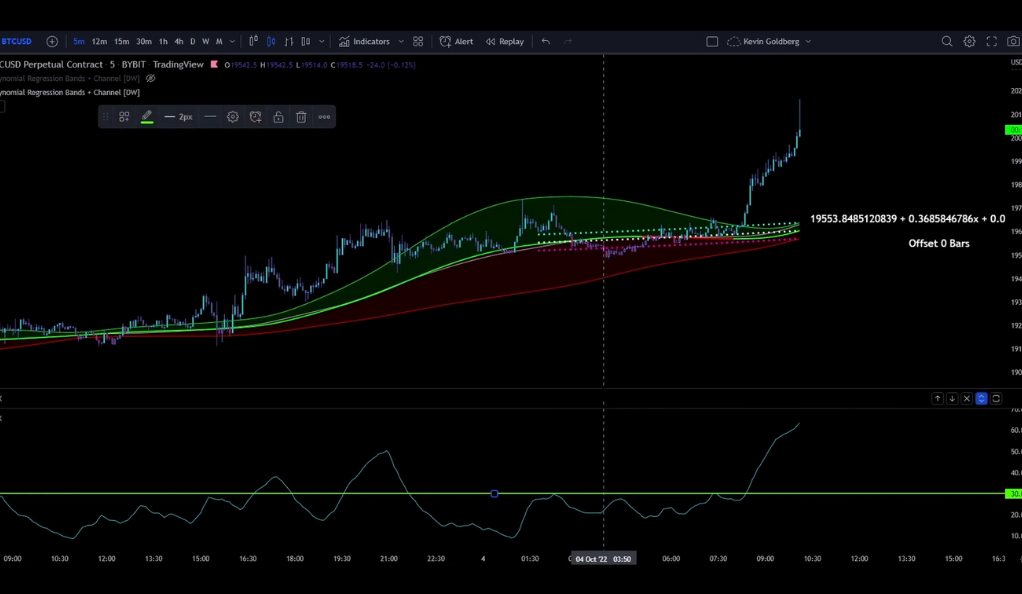
The first key component of the TradingView Indicator strategy is the Polynomial Regression Bands + Channel [DW]. This indicator is a powerful tool in a trader’s arsenal. It’s designed to help traders identify potential price reversals, which are crucial moments in trading where the price direction changes. Recognizing these points can provide traders with valuable opportunities to enter or exit trades.
For the TradingView Indicator strategy, the settings for this indicator were specifically adjusted. The Data Smoothing Period, a parameter that helps reduce noise and improve the clarity of the indicator, was changed from 10 to 200. This adjustment allows the indicator to better capture long-term trends, providing a clearer picture of the market’s direction and potential reversal points.
Indicator #2: Average Directional Index (ADX)
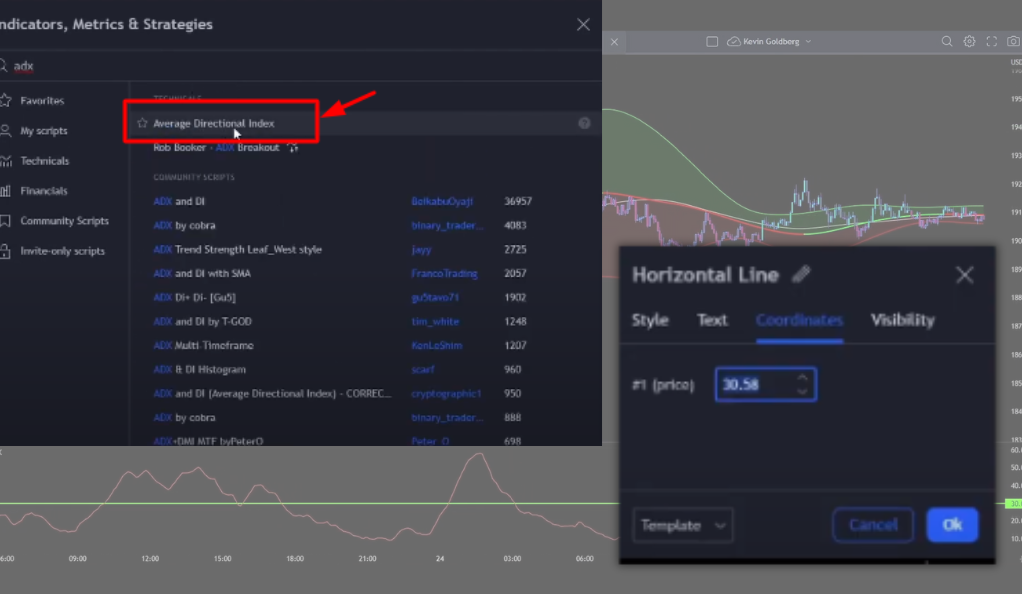
The second pillar of the TradingView Indicator strategy is the Average Directional Index (ADX). This indicator is a staple in many traders’ toolkits and for a good reason. The ADX is designed to measure the strength of a trend, providing traders with insights into whether a market is moving strongly in a particular direction or merely drifting sideways.
In the context of the TradingView Indicator strategy, a unique tweak is applied to the ADX. A horizontal line is added at the ADX Indicator. This line serves as a visual guide for traders, helping them quickly and easily interpret the ADX’s readings. It’s these small, thoughtful adjustments that can often make a significant difference in the effectiveness of a trading strategy.
The Trading Rules: Long and Short Trades
The TradingView Indicator strategy is not just about the indicators it uses; it’s also about the specific rules it follows for entering trades. These rules are designed to maximize the potential for profit and minimize the risk of loss. For a long trade, which is essentially betting that the price will increase, there are two conditions that need to be met. First, the price needs to cross back under the upper band of the Polynomial Regression Bands + Channel [DW] indicator.
The second condition for entering a long trade involves the ADX indicator. The ADX needs to have recently been above the 30 line. This is a critical point as it indicates high market volatility. High volatility often comes with increased risk, but it also comes with the potential for greater rewards. For a short trade, which is a bet that the price will decrease, the rules are the opposite. These carefully crafted rules guide traders in making informed decisions about when to enter and exit trades.
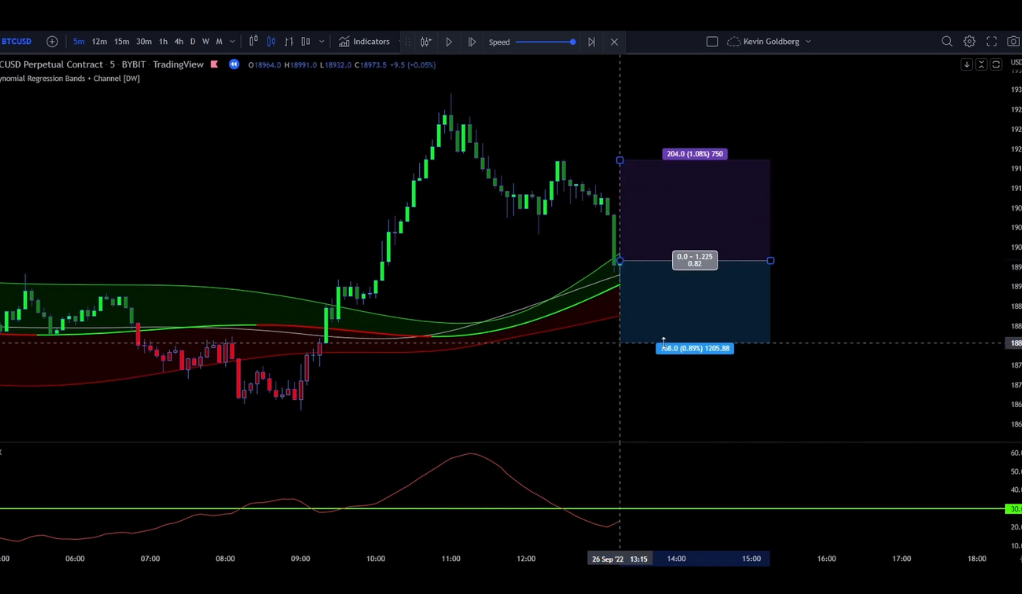
Backtesting: The Proof is in the Pudding
Backtesting is a critical part of validating any trading strategy. It’s the process of testing a strategy or predictive model using historical data to assess its viability. Backtesting allows traders to see how a strategy would have performed in the past, which can provide insights into its potential future performance. It’s a vital step that helps traders gain confidence in a strategy before they risk real money on it.
In the case of the TradingView Indicator strategy, the backtesting process was shared with viewers in an engaging way. The YouTuber invited their audience to watch the backtesting process, which was accompanied by music. This approach not only made the learning experience more enjoyable but also helped to demystify the process of backtesting, making it more accessible to traders of all levels.
The Results: A Closer Look
The results of the backtesting process provided a compelling testament to the potential of the TradingView Indicator strategy. Starting with an initial balance of 1000 USD and risking 2% per trade, a disciplined approach that helps manage risk, the account experienced significant growth. After 100 trades, the account balance had grown to 1250 USD, a clear indication of the strategy’s potential profitability.
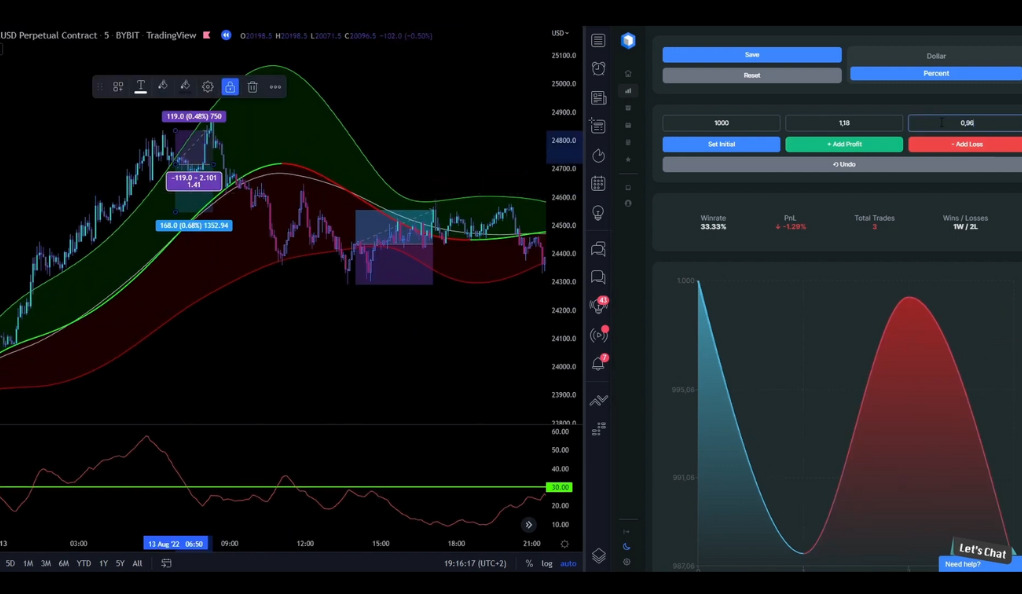
The strategy also demonstrated a solid win rate of 52%. In trading, a win rate refers to the percentage of trades that are profitable, and anything over 50% is generally considered good. The profit and loss (PnL) was 25.18%, another positive sign. The largest profit trade was 3.48%, and the largest loss trade was 3.46%, showing that the strategy can result in significant gains but also reminding traders of the risks involved.
The Strategy: A Critical Evaluation
While the results of the backtesting were promising, it’s important to conduct a critical evaluation of the TradingView Indicator strategy. One of the key points to note is that the strategy did not achieve the 70% win rate that was initially anticipated. This shortfall may lead some to question the strategy’s effectiveness. However, it’s crucial to remember that while a high win rate is desirable, it’s not the only measure of a strategy’s success.
Despite falling short of the anticipated win rate, the strategy still achieved a win rate of over 50%. This is a commendable figure in the world of trading, where the markets are often unpredictable and volatile. It indicates that the strategy has potential and could be a valuable tool for traders. As with any strategy, it’s important to use it as part of a balanced trading approach that includes risk management and diversification.
Conclusion
The TradingView Indicator strategy, which employs a distinct blend of indicators and trading rules, has shown encouraging outcomes in its backtesting phase. This strategy is unique in its approach, utilizing a combination of technical analysis tools to identify potential trading opportunities. These tools may include trend indicators, momentum oscillators, volume indicators, and others, each contributing to the overall decision-making process in the strategy.
Despite not reaching the initially projected success rate of 70%, the strategy still managed to achieve a respectable win rate of over 50%. This is a significant achievement, considering the inherent unpredictability and volatility of the financial markets. It’s important to note that a 50% win rate in trading does not necessarily mean a break-even scenario, as the profitability of a strategy also depends on other factors such as the risk-reward ratio and the management of losses.
Ainu Token aims to offer impartial and trustworthy information on cryptocurrency, finance, trading, and shares. However, we don't provide financial advice and recommend users to conduct their own studies and thorough checks.
Comments (No)