In the fast-paced world of trading, successful traders rely on well-defined strategies to navigate the markets. One such strategy that has gained attention in the trading community is the “Vumanchu 5 Minutes Best Scalping Strategy.” This strategy, designed for short-term trades, incorporates three key indicators: the Exponential Moving Average (EMA), the Relative Strength Index (RSI), and the Stochastic Oscillator.
The Vumanchu 5 Minutes Best Scalping Strategy aims to capitalize on small price movements by identifying trends and potential entry points. Traders using this strategy first identify assets exhibiting clear trends, relying on the EMA to determine the trend direction. Once a trend is established, traders wait for a retracement within the trend and use the RSI and Stochastic Oscillator to confirm potential entry opportunities. If the indicators indicate oversold conditions during an uptrend or overbought conditions during a downtrend, traders consider it a signal to enter the trade. The strategy focuses on short-term trades to quickly take advantage of the anticipated continuation of the trend.
It is important to note that successful implementation of the Vumanchu 5 Minutes Best Scalping Strategy requires thorough analysis, risk management, and ongoing market monitoring. Traders should also consider additional factors such as market volatility, news events, and overall market conditions. As with any trading strategy, it is advisable to test and adapt the strategy to individual trading styles and risk tolerance levels, using demo accounts or backtesting techniques before applying it with real capital.
Understanding the Vumanchu Scalping Strategy
The Vumanchu Scalping Strategy is a popular trading approach that combines three key indicators to assist traders in identifying potential trading opportunities. The first indicator is the Exponential Moving Average (EMA), which helps determine the trend direction. Traders typically use shorter-term EMAs to capture short-lived trends and make quick trades.
The Vumanchu Scalping Strategy utilizes the VuManChu Cipher B + Divergences as a custom indicator designed to combine trend analysis, momentum, and divergences for generating trading signals. It helps identify entry and exit points based on patterns and divergences. Additionally, the strategy incorporates the blue Wavetrend indicator to confirm trend strength and identify overbought or oversold conditions. Traders should carefully analyze, practice, and manage risks when implementing this strategy, adapting it to their trading style and considering market conditions and other factors like volatility and news events.
The Role of EMA in the Strategy
In the Vumanchu Scalping Strategy, the Exponential Moving Average (EMA) plays a significant role in determining the trend direction. The EMA is a type of moving average that assigns more weight to recent data, making it more responsive to current price movements. This characteristic makes it particularly suitable for short-term trading approaches like scalping.
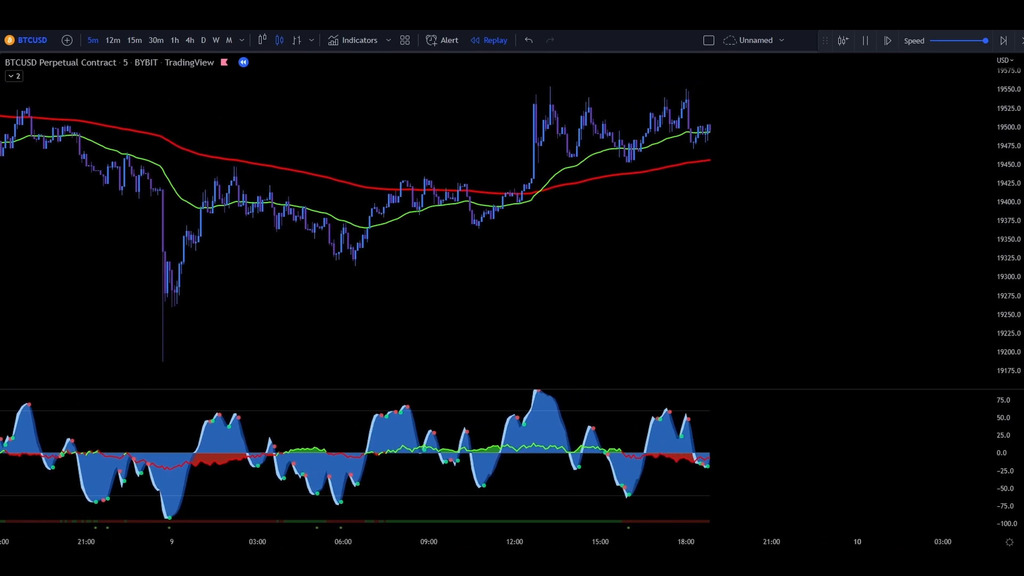
The Vumanchu strategy utilizes two EMA lines: a green line and a red line. These lines represent different time periods or lengths of the moving averages. The position and relationship between these two lines serve as crucial signals for traders. When the green EMA line is above the red EMA line, it indicates an uptrend, suggesting a potential opportunity to go long or enter a buy trade. Conversely, when the green EMA line is below the red EMA line, it signifies a downtrend, indicating a possible opportunity to go short or enter a sell trade. Traders often wait for a clear crossover or separation between the two EMA lines before considering a trade entry or exit.
VuManChu Cipher B + Divergences: The Heart of the Strategy
The VuManChu Cipher B + Divergences indicator is a critical component of the Vumanchu Scalping Strategy, serving as the core of the approach. This custom indicator is specifically designed to evaluate trend strength and detect potential reversals in the market. It combines various elements such as trend analysis, momentum, and divergences to generate essential signals for traders.
The VuManChu Cipher B + Divergences indicator provides valuable insights into the strength of trends, allowing traders to identify favorable trading opportunities. By analyzing the indicator’s signals, traders can determine potential entry and exit points with greater precision. The indicator’s ability to detect divergences, where the price movement differs from the indicator’s reading, is particularly useful for identifying potential trend reversals. Traders can capitalize on these signals to adjust their trading positions accordingly.
The Blue Wavetrend: A Key Confirmation Indicator
The blue Wavetrend is a crucial confirmation indicator in the Vumanchu Scalping Strategy. This indicator is primarily used to validate the signals generated by the Exponential Moving Average (EMA) and VuManChu Cipher B + Divergences. It provides traders with additional insights into the momentum of the price movement, further supporting their trading decisions.
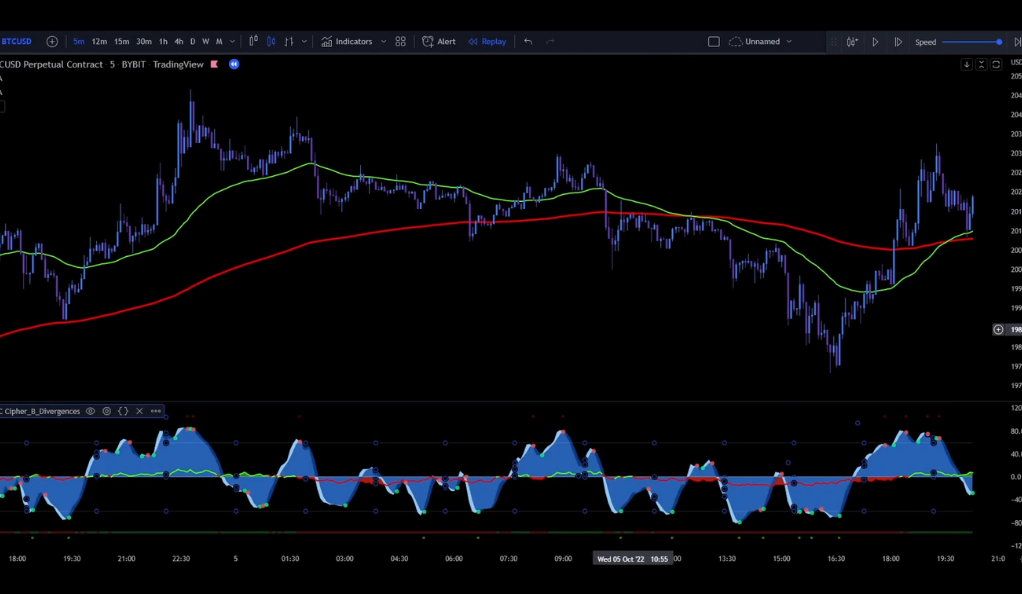
The blue Wavetrend indicator presents dots and waves on the price chart, which traders analyze to confirm the strength of the identified trend and identify potential overbought or oversold conditions. The dots indicate short-term reversals within the prevailing trend, while the waves represent the momentum and intensity of the price movement. Traders often look for alignment or synchronization between the signals from the EMA, VuManChu Cipher B + Divergences, and the blue Wavetrend to increase their confidence in their trading decisions.
Entering a Long Position: The Perfect Setup
The Vumanchu Scalping Strategy provides a specific setup for entering a long position, signaling a potential upward trend. Traders carefully observe several key conditions before initiating the trade. Firstly, they look for the green Exponential Moving Average (EMA) line to be positioned above the red EMA line, indicating a bullish trend in the market.
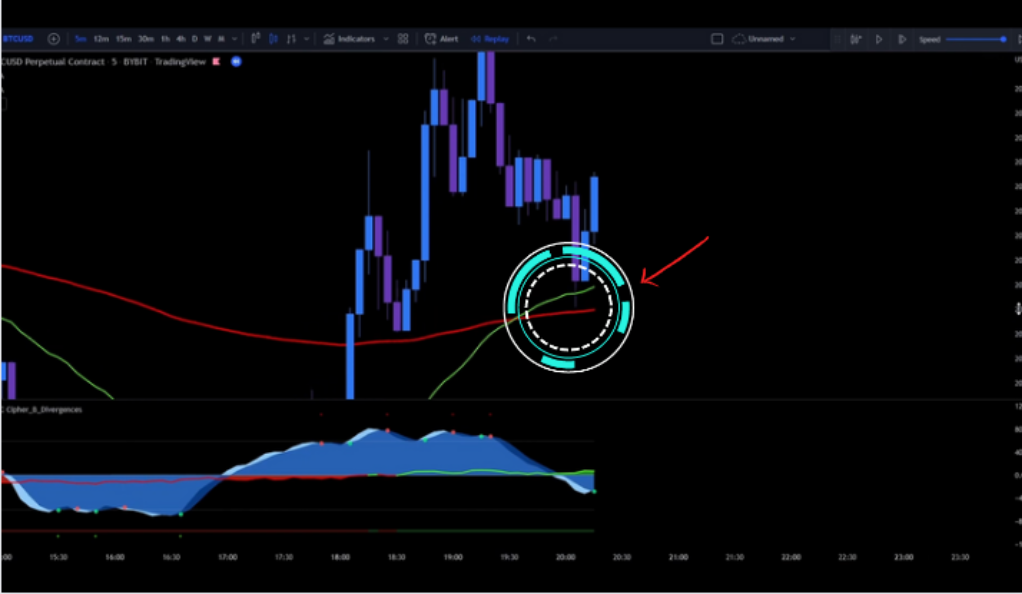
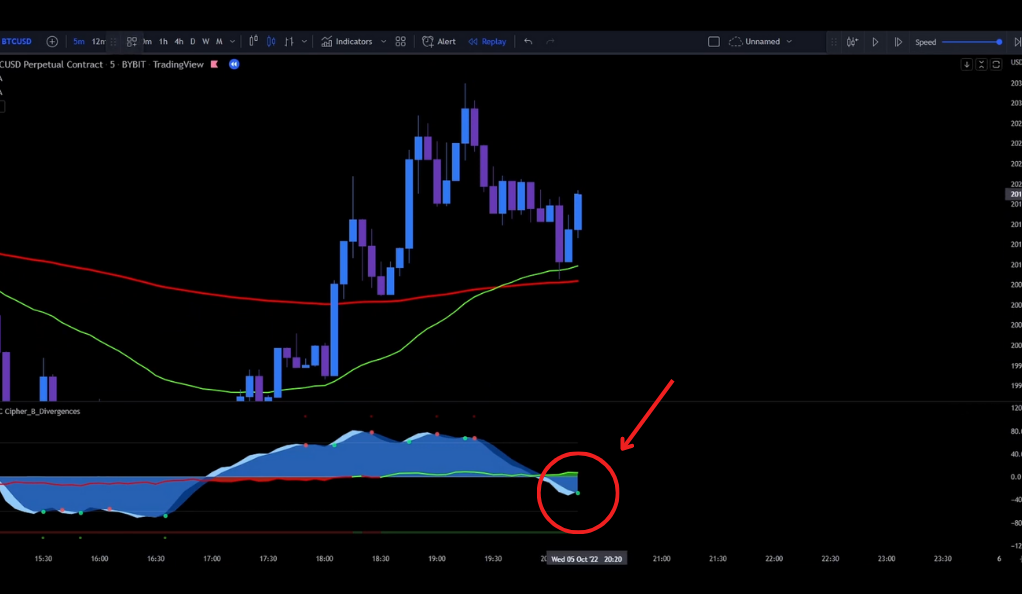
To enter a long position in the Vumanchu Scalping Strategy, traders wait for a pullback into the green EMA line, indicating a temporary retracement. They also consider the Moneyflow indicator in the green zone, indicating positive money flow. Additionally, they confirm the setup with a green dot on the blue Wavetrend, indicating a short-term reversal, and a blue wave below the zero line, suggesting upward momentum. When all conditions align, traders may consider entering a long position. Risk management should be applied, as no strategy guarantees successful trades. Traders should adapt the strategy to their preferences and market conditions while monitoring for necessary adjustments.
Entering a Short Position: Spotting the Downtrend
Traders then wait for a pullback into the green EMA line, indicating a temporary retracement within the overall trend. This pullback provides an opportunity to enter the trade at a potentially advantageous price level. Additionally, they keep an eye out for a red dot printed on the blue Wavetrend indicator, which signifies a short-term reversal to the downside. Furthermore, they note that the blue wave on the Wavetrend is printed above the zero line, suggesting the presence of potential downward momentum.
Once these conditions align, traders may consider entering a short position, as the setup indicates a favorable environment for a potential downward trend. However, it is important to remember that no strategy guarantees successful trades, and risk management techniques should always be applied to mitigate potential losses. Traders should also adapt the strategy to their own trading preferences and the prevailing market conditions while continuously monitoring the trade for any necessary adjustments.
Valid and Invalid Trades: Knowing the Difference
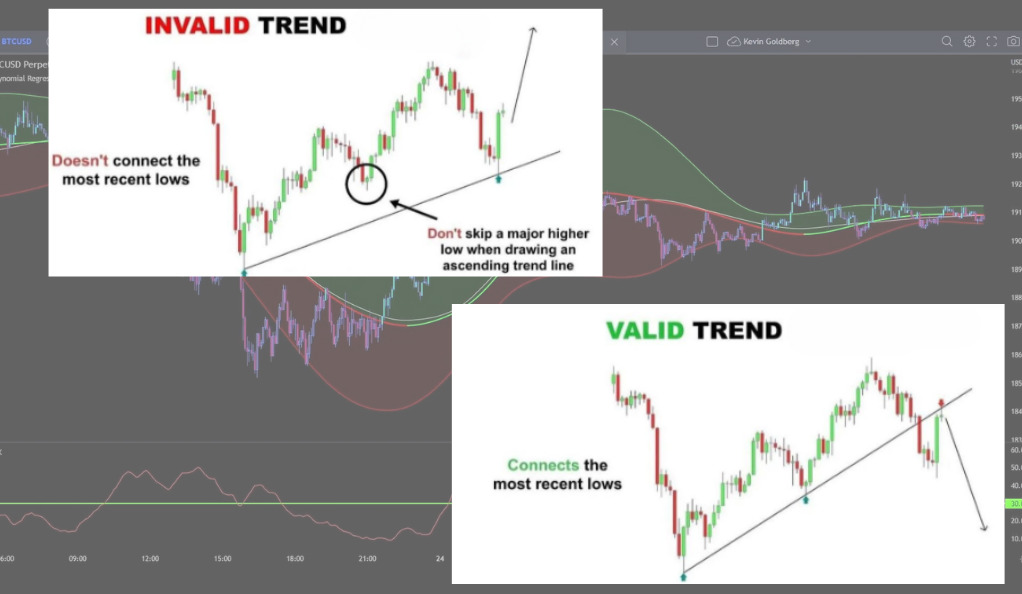
Differentiating between valid and invalid trades is crucial for traders to make informed decisions and avoid costly mistakes. In the Vumanchu Scalping Strategy, examples of both valid and invalid trades to help traders understand the difference and improve their trading outcomes.
By understanding the setup criteria and the specific conditions required for entering a trade, traders can identify valid trading opportunities. For example, a valid long trade would involve the green Exponential Moving Average (EMA) line positioned above the red EMA line, a pullback into the green EMA line, positive Moneyflow, a green dot on the blue Wavetrend, and a blue wave below the zero line. On the other hand, invalid trades would occur when the setup criteria are not met or when the conditions for a particular trade signal are not in alignment.
Recognizing and avoiding invalid trades is equally important for traders. Invalid trades can occur when the setup criteria are not fulfilled, indicating a lack of favorable conditions for a potential trade. Trading based on invalid signals can lead to unnecessary losses. By comprehending the examples provided by the author and practicing sound risk management, traders can enhance their ability to identify valid trades and avoid taking unnecessary risks.
The Results: A Promising Backtest
The backtest results reported by the author of the Vumanchu Scalping Strategy show promising outcomes for traders. Over the course of 100 trades conducted within a span of 5 weeks, the strategy achieved a win rate of 59% and a Profit and Loss (PnL) of 37.12%. These results indicate that the Vumanchu strategy has the potential to be a powerful tool for traders seeking to capitalize on short-term trading opportunities.
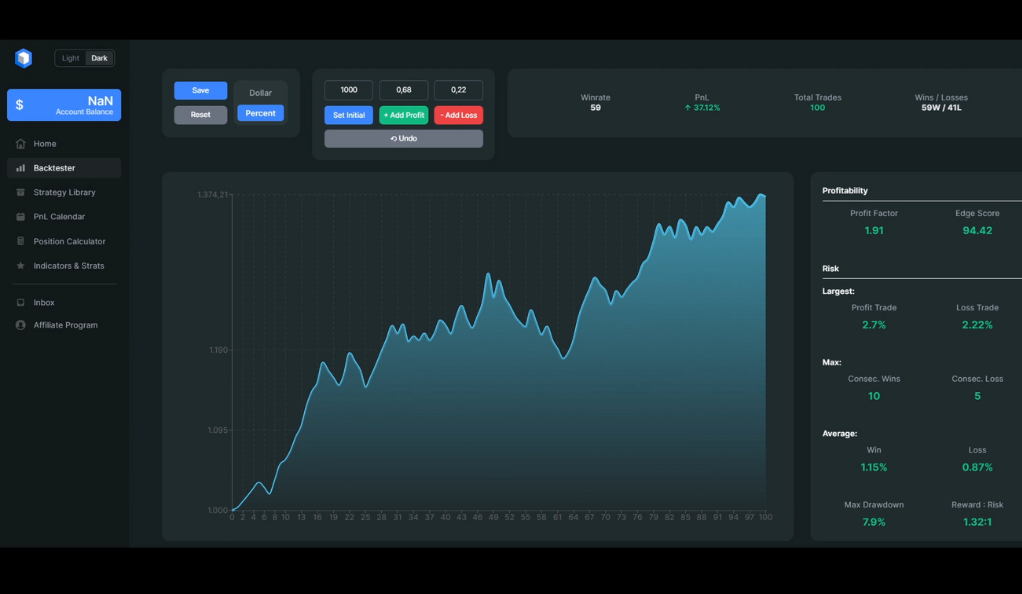
The reported win rate of 59% suggests that the strategy generated profitable trades more often than not, indicating a favorable probability of success. Furthermore, the PnL of 37.12% demonstrates a substantial overall gain achieved over the 100 trades conducted during the backtesting period. While backtesting results provide insights into the strategy’s historical performance, it is important for traders to remember that past performance does not guarantee future success.
Conclusion
The Vumanchu 5 Minutes Best Scalping Strategy, with its unique combination of indicators and clear entry and exit rules, offers a promising approach for traders. Its backtest results are encouraging, and its detailed guidelines for valid and invalid trades provide valuable insights for traders. As with any strategy, it’s essential to practice and understand it fully before implementing it in live trading. Happy trading!
Ainu Token aims to offer impartial and trustworthy information on cryptocurrency, finance, trading, and shares. However, we don't provide financial advice and recommend users to conduct their own studies and thorough checks.
Comments (No)