In the fast-paced world of trading, the importance of a dependable strategy cannot be overstated. Today, we conduct a comprehensive backtesting analysis of the “ULTIMATE TradingView BUY and SELL Indicator for Crypto, Forex, and Stocks Scalping” to determine if it lives up to its captivating name by delivering precise signals for buying and selling. The strategy’s alluring promise of accurately pinpointing entry and exit points has piqued the interest of many traders seeking an edge in the market. Through meticulous historical data analysis and simulation, we aim to assess the indicator’s performance and evaluate whether it possesses the potential to deliver on its claims of success. By critically examining its results and comparing them with real-world market conditions, we can draw an objective conclusion about its effectiveness and its ability to stand the test of time.
As we embark on this evaluation, it is essential to recognize the importance of being discerning and cautious when dealing with trading strategies that make bold claims. The world of trading is complex and ever-evolving, and while indicators and algorithms can provide valuable insights, no strategy is infallible. Past performance is not a guarantee of future success, and it is crucial to consider various factors such as risk management, market conditions, and personal trading preferences before incorporating any strategy into a live trading environment. Our aim is to provide an unbiased and data-driven assessment of this “ULTIMATE” indicator, shedding light on its potential strengths and limitations, enabling traders to make informed decisions in pursuit of their trading goals.
Backtesting: A Reality Check
Backtesting serves as a reality check for any trading strategy, providing valuable insights into its potential performance under historical market conditions. The backtesting results raise significant concerns. With an initial balance of 1000 USD and a conservative risk of 2% per trade, the strategy was put through a rigorous examination over a span of three and a half months, involving 100 trades. Unfortunately, the outcomes were far from impressive. The account balance plummeted to 590 USD, indicating a substantial loss of 40.8%.
The modest win rate of 39% casts further doubt on the strategy’s reliability, as successful trades accounted for less than half of the total. The largest profit trade at 8.5% and the largest loss trade at 7.26% suggest that the strategy experienced significant fluctuations in performance, with the potential for gains being outweighed by the risk of substantial losses. Moreover, the presence of 16 consecutive losses highlights a concerning lack of consistency in the strategy’s ability to generate positive results. Although there were 7 consecutive wins, they were overshadowed by the extended losing streak, questioning the strategy’s ability to deliver sustained profitability.
In light of these results, it is evident that the “ULTIMATE TradingView BUY and SELL Indicator for Crypto, Forex, and Stocks Scalping” did not live up to the hype surrounding its name. While backtesting provides valuable insights, it is crucial to exercise caution and consider multiple factors before adopting any strategy in live trading. It is imperative to thoroughly analyze risk management techniques, market conditions, and other potential influencing factors. Trading always carries inherent risks, and no single indicator or strategy can guarantee constant success. Traders should approach such bold claims with skepticism and always conduct their due diligence before making any financial decisions.
Backtesting Final Result
The backtesting results of the “ULTIMATE TradingView BUY and SELL Indicator for Crypto, Forex, and Stocks Scalping” strategy provide valuable insights into its historical performance. During the three and a half months of testing, the strategy executed a total of 100 trades. However, the overall outcome was less than satisfactory, as the account balance experienced a significant decline, dropping from an initial 1000 USD to 590 USD. This represents a substantial loss of 40.8% over the testing period, raising concerns about the strategy’s effectiveness and reliability.
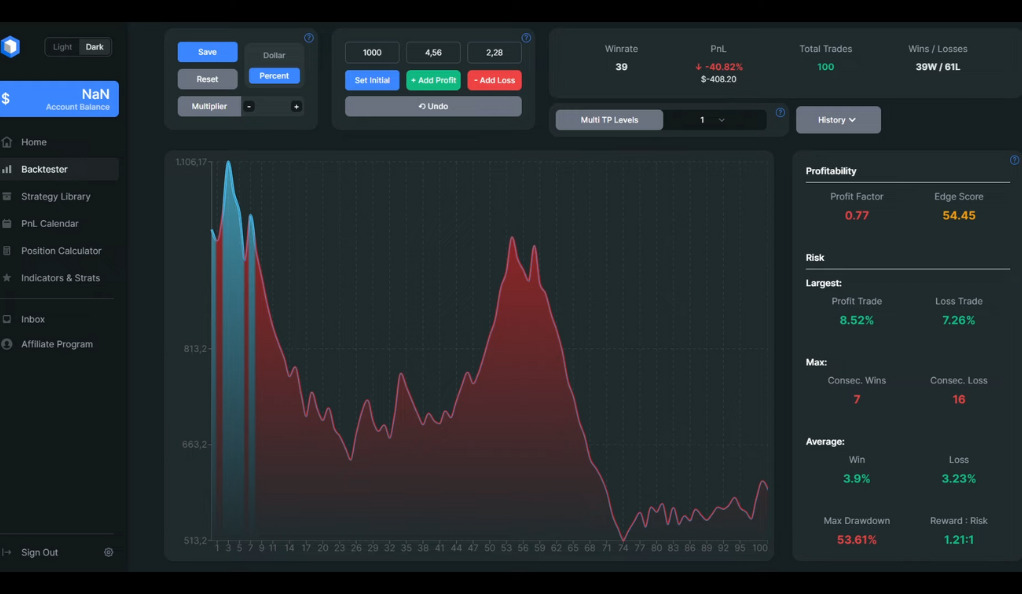
The backtesting analysis also revealed a modest win rate of 39%. While there were seven consecutive winning trades, they were outweighed by 16 consecutive losing trades, indicating a lack of consistency in the strategy’s performance. The largest profit trade stood at 8.5%, while the largest loss trade was at 7.26%, showcasing significant fluctuations in outcomes. These results highlight the importance of cautious optimism when evaluating trading strategies that promise exceptional performance. While backtesting can provide valuable insights into a strategy’s potential, traders should exercise prudence and consider additional factors, such as risk management and market conditions, before incorporating any strategy into live trading.
The Indicators: The Strategy’s Backbone
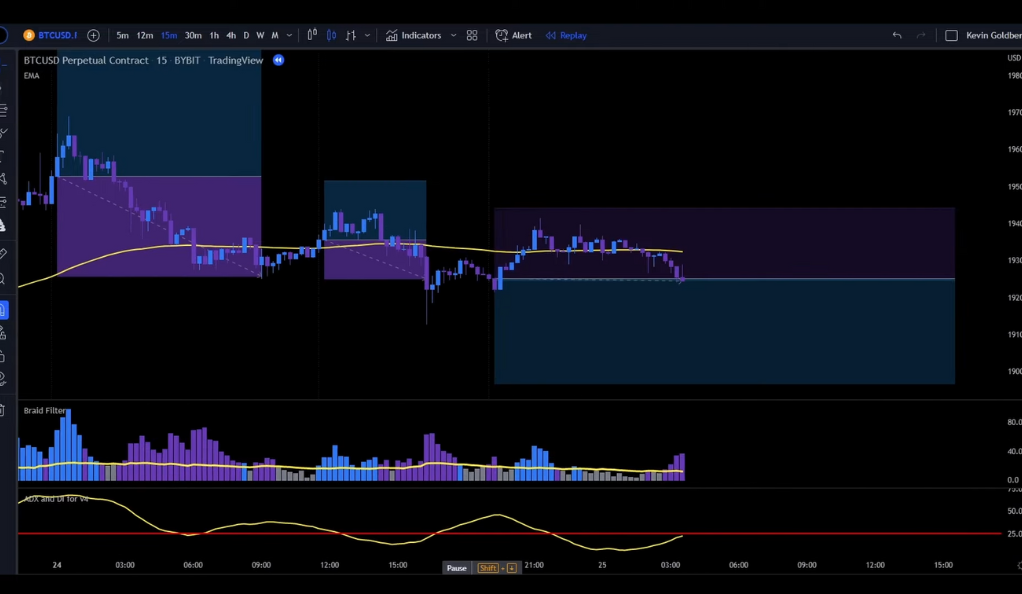
The EMA Indicator is a widely used technical tool that calculates the average price of an asset over a specified period, giving more weight to recent prices. By focusing on recent data points, the EMA becomes more responsive to the latest market developments, which can aid in identifying potential entry and exit points. Its ability to adapt quickly to changing market conditions is particularly valuable for traders engaging in scalping, where swift decision-making is crucial.
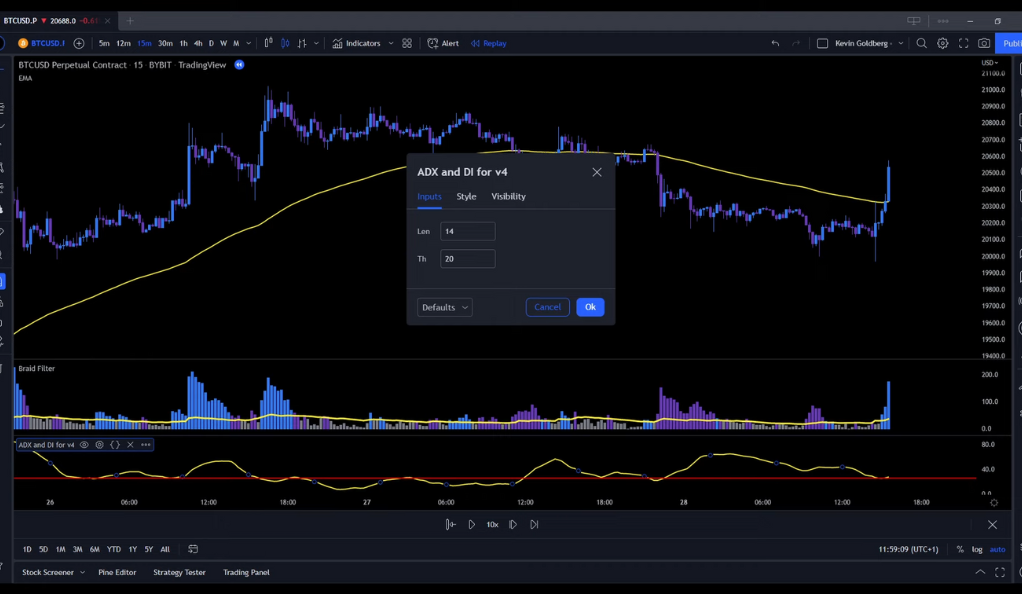
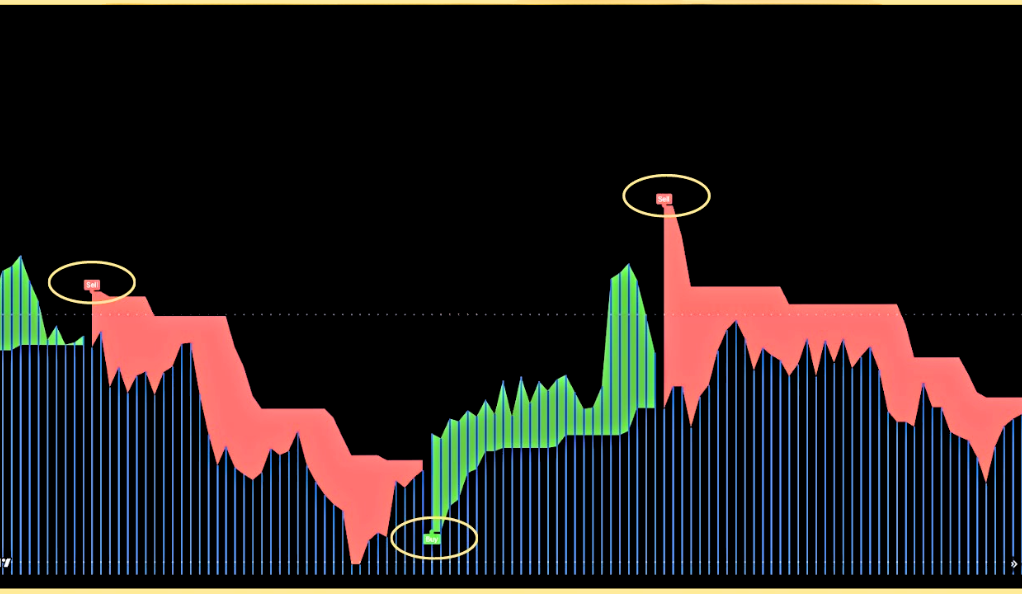
The braid filter by mango2juice and the ADX and DI by BeikabuOyaji add further sophistication to the strategy’s signal generation process. The braid filter, created by mango2juice, likely aims to filter out noise and provide a clearer view of the underlying trend. Noise in the market can lead to false signals, so such filtering techniques can help reduce the risk of making erroneous trading decisions. On the other hand, the Average Directional Index (ADX) and Directional Indicator (DI) by BeikabuOyaji are indicators used to assess the strength of a trend. They help traders gauge whether the market is trending or ranging and can be valuable in confirming potential trade setups based on the EMA signals.
When appropriately utilized, this combination of indicators can offer traders valuable perspectives on market movements and potential entry and exit points. However, it is important to remember that no set of indicators can guarantee profitable trades, and careful consideration of risk management and other market factors is essential when applying any strategy in real-world trading. As traders continue to explore and refine their approaches, incorporating multiple indicators and techniques can enhance their decision-making processes and potentially contribute to overall trading success.
Entry Rules: The Green Light

The ULTIMATE TradingView BUY and SELL Indicator strategy’s entry rules for long positions require three specific conditions: the candle closing above the EMA line, the braid filter changing to blue and closing above the yellow filter line, and the yellow line from the ADX indicator being above the red 25 line. Once all these conditions align, traders receive the signal to enter a long trade. To manage risk, a stop-loss is placed slightly below the EMA line or at the recent swing low, while the target is set at a risk-to-reward ratio of 1 to 1.5, aiming for a favorable balance between potential gains and losses. For short positions, the rules are applied in reverse, with the candle closing below the EMA line, the braid filter indicating a bearish trend, and the yellow line from the ADX indicator being below the red 25 line before considering a short trade. Following these entry rules diligently and incorporating prudent risk management practices is vital for traders seeking to navigate the challenges of the market and optimize their trading outcomes.
Invalid Signals: The Red Flags
In the dynamic world of trading, not every signal generated by the ULTIMATE TradingView BUY and SELL Indicator strategy is reliable. Some signals may turn out to be false alarms, leading to unnecessary losses if acted upon. For instance, a long signal is considered invalid if the line from the ADX and DI indicator is below the 25 level, indicating a lack of sufficient bullish momentum in the market. Similarly, if the price is trading below the 100 Exponential Moving Average (EMA) line, it may suggest a bearish trend and render the long signal unreliable. Likewise, for short signals, these rules are applied in reverse, with an invalid signal occurring if the ADX and DI line remains above 25, or if the price is trading above the 100 EMA line. Being able to recognize these red flags is crucial for traders as it can help them avoid making costly mistakes and improve the overall accuracy of their trading decisions.
As traders employ the Ultimate indicator in their strategies, it is essential to exercise prudence and not blindly follow every signal it generates. Analyzing additional factors, conducting thorough technical and fundamental analysis, and considering the broader market context are vital for validating signals and making informed trading choices. By being aware of these invalid signals and implementing a comprehensive approach to trading, traders can enhance their ability to navigate the complexities of the market and increase their chances of achieving long-term success.
Conclusion
The Ultimate TradingView BUY and SELL Indicator is a complex strategy with a unique set of indicators and rules. However, the backtesting results suggest that it may not be the golden ticket to trading success.
While it’s important to remember that past performance is not indicative of future results, these findings serve as a reminder to approach every strategy with a healthy dose of skepticism. After all, in the world of trading, there’s no such thing as a sure thing.
Ainu Token aims to offer impartial and trustworthy information on cryptocurrency, finance, trading, and shares. However, we don't provide financial advice and recommend users to conduct their own studies and thorough checks.

Comments (No)