In the dynamic and often unpredictable world of trading, strategies promising high win rates are frequently met with a healthy dose of skepticism. One such strategy, claiming a staggering 96% win rate, has been causing quite a stir in the trading community. This strategy, created by Back Test TV, has piqued the curiosity of traders worldwide, leading many to question its validity and effectiveness. But does it truly live up to its promise? Let’s delve deeper into the details and unravel the mystery.
Understanding the Trading Strategy
The Core Indicators
- Machine Learning K N Based Indicator
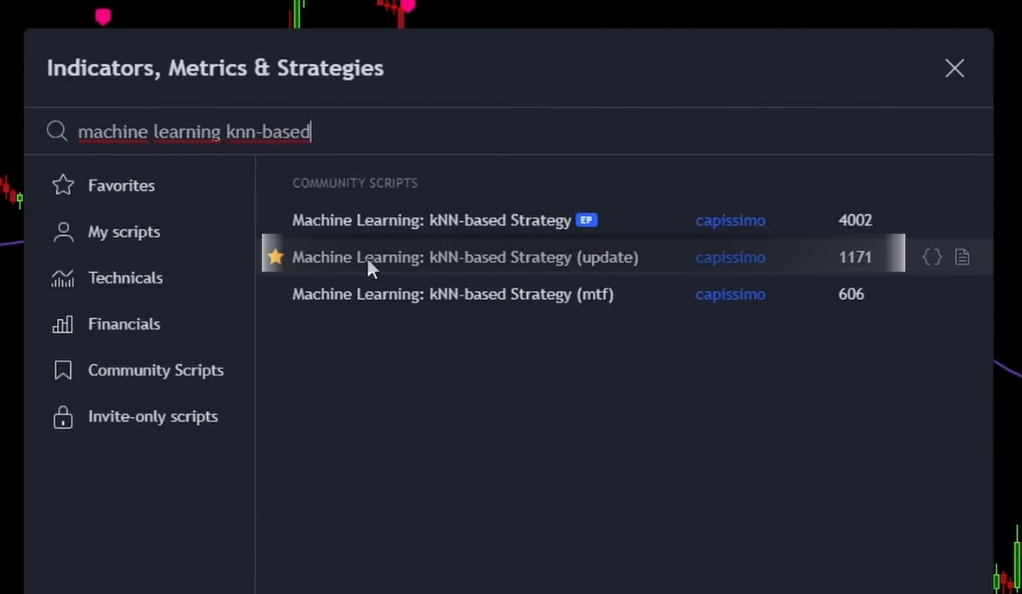
The Machine Learning K N Based indicator, updated by a user named Capissimo, is a unique tool that employs machine learning to predict market movements. It uses a K-Nearest Neighbors (KNN) algorithm, which classifies a data point based on the classification of its ‘neighbors’ or similar price patterns. This indicator is especially useful in volatile markets, where it can adapt to changing conditions.
- Smooth Moving Average (SMA)
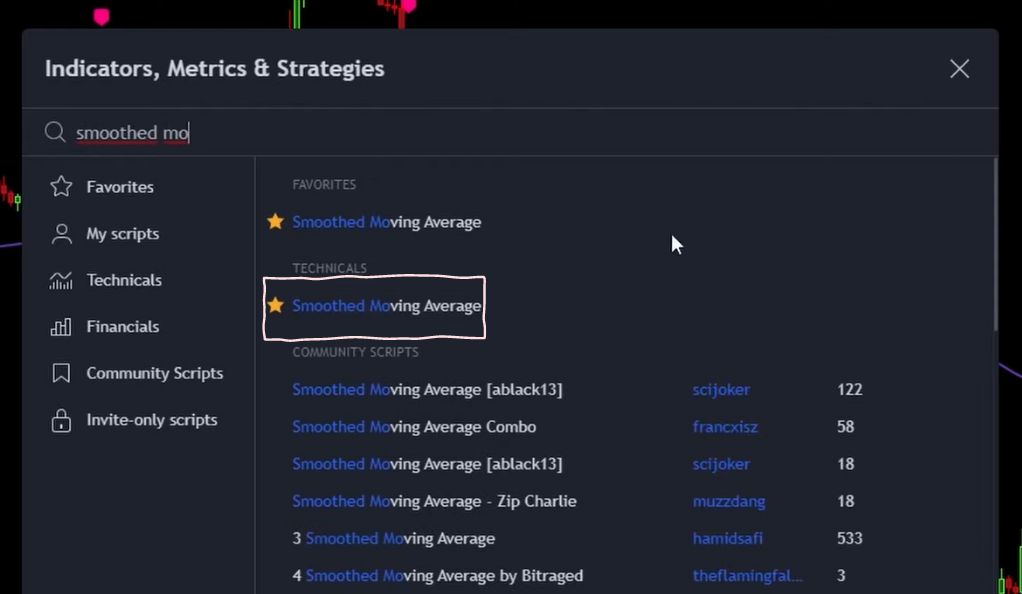
The Smooth Moving Average (SMA) is a widely-used technical analysis tool. It helps traders identify potential market trends by smoothing out price data. The SMA is calculated by averaging the most recent ‘N’ data points, creating a single line that indicates the overall trend. It’s a lagging indicator, making it useful for confirming existing trends rather than predicting future movements.
In the 96% win rate trading strategy, these two indicators are used together, combining the predictive power of machine learning with the trend-confirming strength of the SMA.
Fine-Tuning the Settings
- Adjusting the Machine Learning Indicator
The Machine Learning K N Based indicator’s settings are crucial to its effectiveness. The fast period and slow period settings determine the sensitivity of the indicator to market movements.
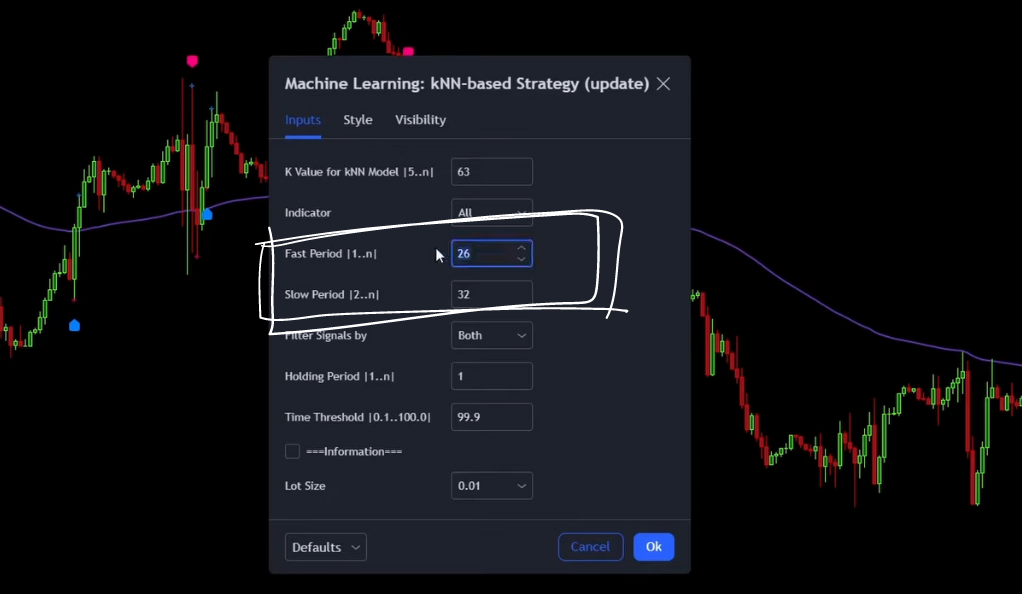
The fast period is set to 26, and the slow period to 32. These specific settings are chosen to balance sensitivity and stability. A shorter fast period would make the indicator more sensitive to recent price changes, while a longer slow period provides a more stable signal that’s less influenced by short-term fluctuations. This balance helps to capture market trends more accurately, reducing the risk of false signals.
- Modifying the Smooth Moving Average (SMA)
The SMA’s settings are also adjusted to optimize its performance. The line thickness is increased to improve visibility, making it easier for traders to identify and follow the SMA line on their charts.
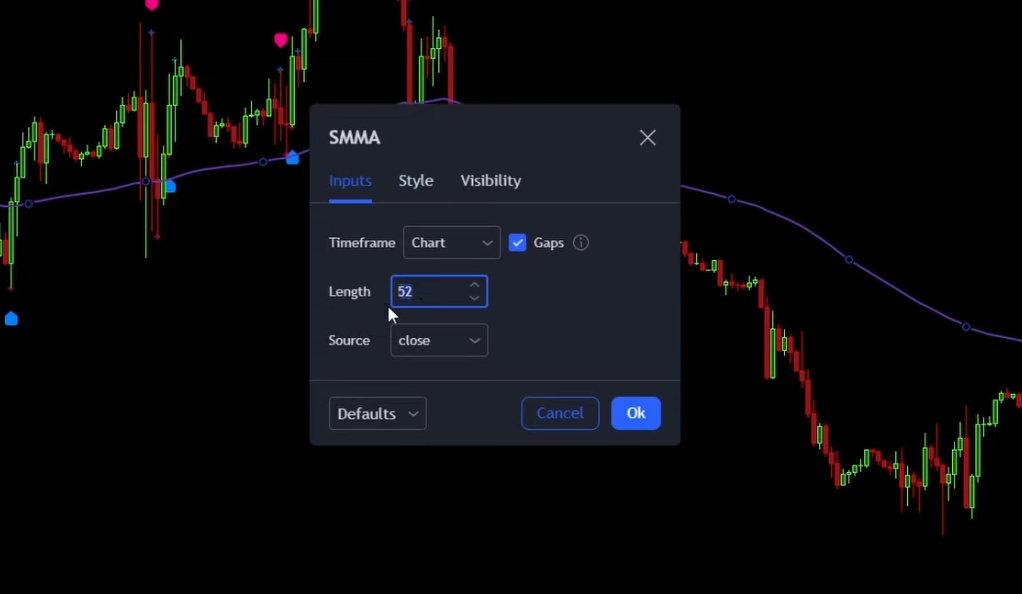
The length of the SMA is set to 52. This setting determines the number of data points used in the calculation of the SMA. A length of 52 means that the SMA is calculated based on the last 52 data points. This longer length provides a more comprehensive view of the market’s direction, smoothing out short-term fluctuations and highlighting longer-term trends.
These adjustments to the Machine Learning indicator and the SMA are designed to enhance the strategy’s effectiveness. By fine-tuning the settings, traders can potentially increase their chances of identifying profitable trading opportunities.
The Trading Rules Unveiled
Going Long: The Rules
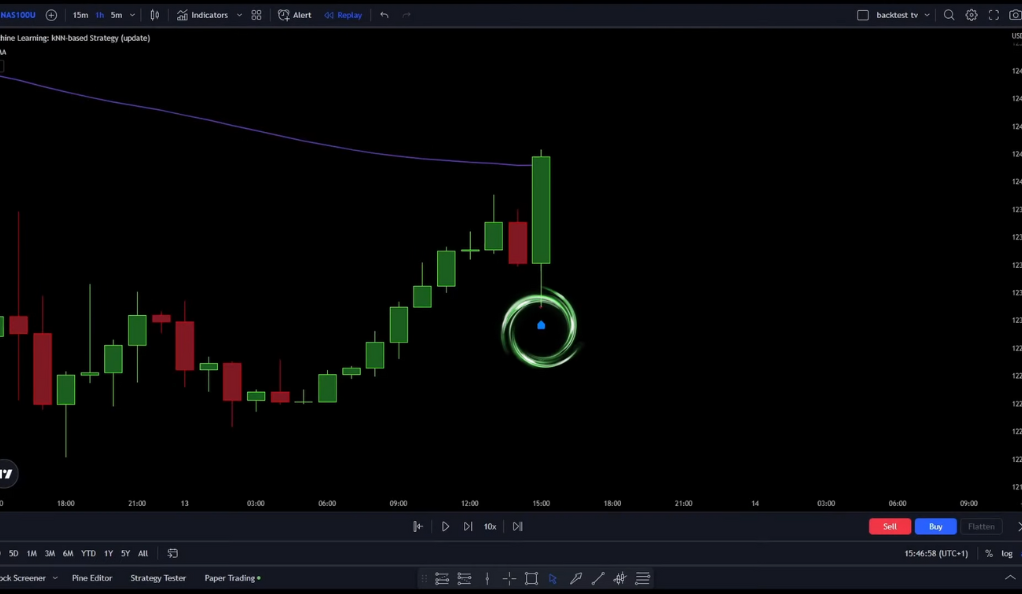
The rules for entering a long position are straightforward but crucial. First, a blue Buy Signal must be printed by the Machine Learning Indicator. This signal indicates a potential upward trend in the market. Second, the candlestick must close bullish above the SMA line. This condition confirms the upward trend. If these conditions are met, a long trade is entered, anticipating a rise in the market.
Going Short: The Flip Side
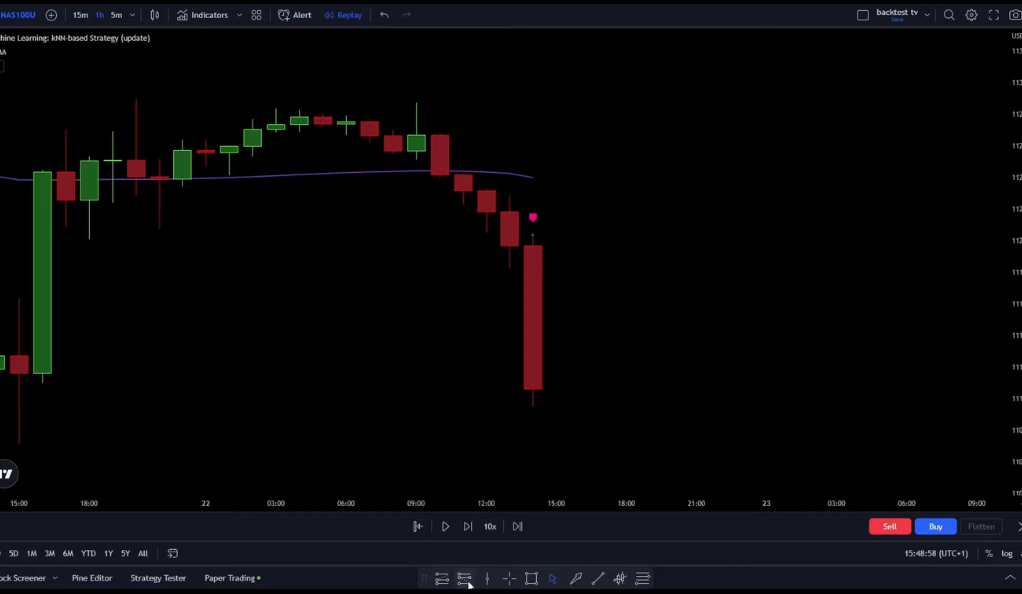
For short trades, the rules are the mirror image. A pink Sell Signal must be printed by the Machine Learning Indicator, indicating a potential downward trend. Additionally, the candlestick must close bearish below the SMA line, confirming the downward trend. If these conditions are met, a short trade is entered, anticipating a market drop.
Risk Management: The Key to Survival
For both long and short trades, the stop loss is set at the recent swing low or high, respectively. This approach helps limit potential losses if the market moves against the trade. The target risk to reward ratio is set from 1 to 1.5. This ratio ensures a balanced approach to risk management, aiming to achieve a higher reward compared to the risk taken.
Backtesting the Strategy: The Moment of Truth
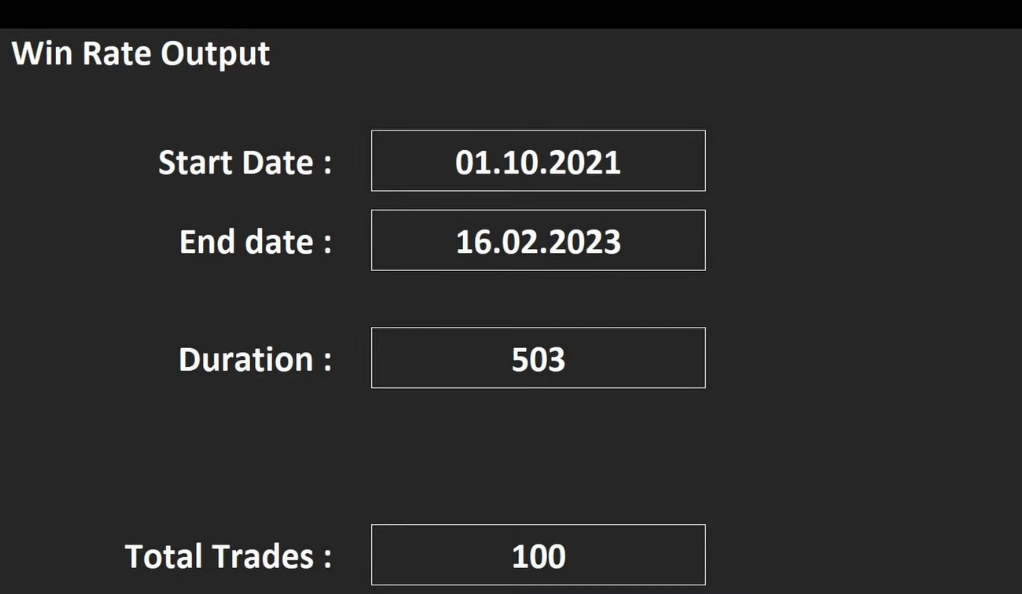
Backtesting is a critical step in validating any trading strategy. It involves applying the strategy to historical market data to assess its performance. For this strategy, backtesting was conducted using an initial balance of $1,000 and 2x leverage. After 100 trades, the results were surprising and somewhat disappointing.
The Reality Check: Facing the Facts
The Win Rate: Expectation vs. Reality
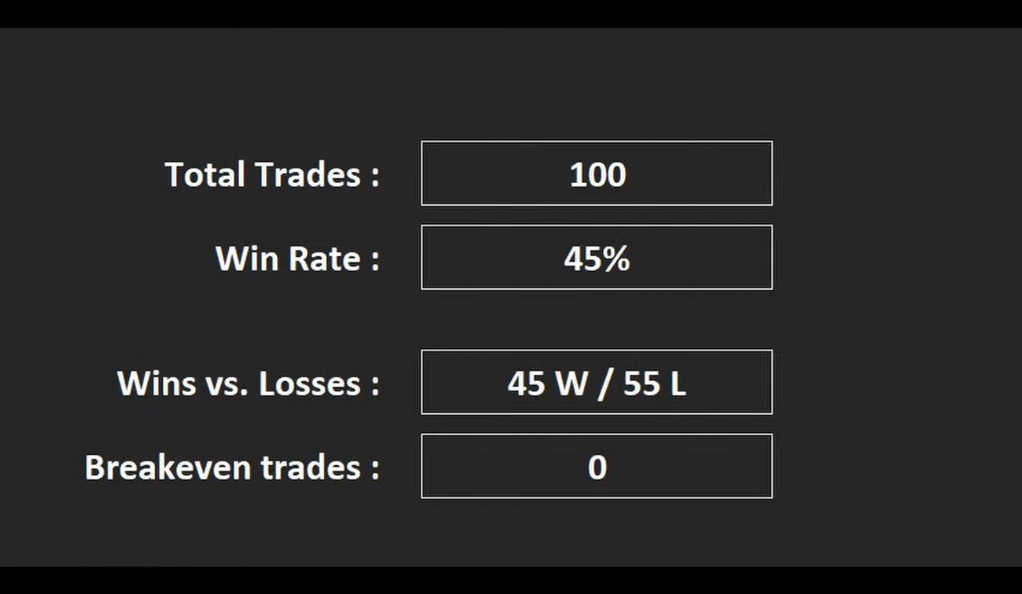
The strategy, which promised a 96% win rate, only managed to achieve a 45% win rate during backtesting. This significant discrepancy raises questions about the strategy’s effectiveness and the validity of the initial claim. It’s a stark reminder that in trading, promises of high win rates should always be taken with a grain of salt.
The Profit: A Silver Lining?
- Profitability Despite Lower Win Rate
While the strategy’s win rate fell short of the promised 96%, achieving only 45% in backtesting, it still managed to generate a profit of 28%. This is a significant observation as it underscores the fact that a high win rate is not the sole determinant of a successful trading strategy.
The profit margin is a crucial metric in trading. It represents the net returns a trader makes after accounting for all costs and losses. In this case, despite winning less than half of the trades, the strategy was still profitable. This could be attributed to effective risk management, where the profits from successful trades significantly outweighed the losses from unsuccessful ones.
- The Importance of Profitability
Profitability is arguably more important than the win rate in trading. A strategy can have a high win rate but still be unprofitable if the losses from unsuccessful trades are larger than the gains from successful ones. Conversely, a strategy can have a lower win rate but still be profitable if the profits from successful trades outweigh the losses.
This scenario is a testament to the fact that trading is not just about winning as many trades as possible, but about maximizing profits and minimizing losses. It’s about the quality of trades, not just the quantity.
The Verdict: Making Sense of the Results
This is likely the title or heading of the section. It suggests that the following text will provide an interpretation or analysis of some results, likely from a trading strategy that has been backtested.
The equity curve of the backtesting results resembled a “wild mountain landscape”, indicating significant fluctuations in performance.
An equity curve is a graphical representation of the change in value of a trading account over a time period. The curve is plotted with the account value on the y-axis and the time on the x-axis. In this case, the equity curve is described as resembling a “wild mountain landscape”. This is a metaphorical way of saying that the equity curve has significant ups and downs, much like the peaks and valleys of a mountain landscape. This indicates that the trading strategy has periods of high returns (the peaks) and periods of losses (the valleys), suggesting significant fluctuations in performance.
The strategy had periods of profit generation, but these were often followed by periods of losses.
This sentence further emphasizes the point made above. The trading strategy being discussed has periods where it generates profit, but these are often followed by periods where it incurs losses. This could mean that the strategy is not consistently profitable, or that it has a high level of risk associated with it.
This volatility suggests that while the strategy can be profitable, it may not be suitable for risk-averse traders.
Volatility in this context refers to the degree of variation in the trading results. A high level of volatility means there’s a significant range between the high and low returns of the strategy. This suggests that while the strategy can generate profits, it can also lead to substantial losses. Therefore, this strategy may not be suitable for risk-averse traders, i.e., traders who prefer strategies with more predictable, steady returns and are not comfortable with the possibility of significant losses.
Conclusion: The Final Word
In conclusion, the 96% win rate trading strategy does not seem to live up to its promise. While it may have some potential for profit, the significantly lower win rate observed during backtesting suggests that traders should approach this strategy with caution. As always, it’s crucial to conduct your own research and testing before adopting any new trading strategy. Remember, in the world of trading, there’s no such thing as a sure thing. It’s a realm where risk and reward walk hand in hand, and success often lies in finding the right balance between the two.
Ainu Token aims to offer impartial and trustworthy information on cryptocurrency, finance, trading, and shares. However, we don't provide financial advice and recommend users to conduct their own studies and thorough checks.
Comments (No)