In the dynamic and ever-evolving world of trading, success lies not only in mastering the basics but also in uncovering advanced strategies that provide an edge. Traders are constantly seeking innovative approaches to grow their accounts quickly while minimizing risks. In this article, we delve into an advanced trading strategy that combines three powerful indicators: the McGinley Dynamic, the Larry Williams proxy index, and the Trend Direction Force index. By leveraging the unique characteristics of each indicator and integrating them harmoniously, traders can enhance their decision-making process and significantly improve their trading outcomes. Join us as we explore the mechanics, rules, backtesting results, and additional insights of this comprehensive and highly effective strategy.
Understanding the McGinley Dynamic
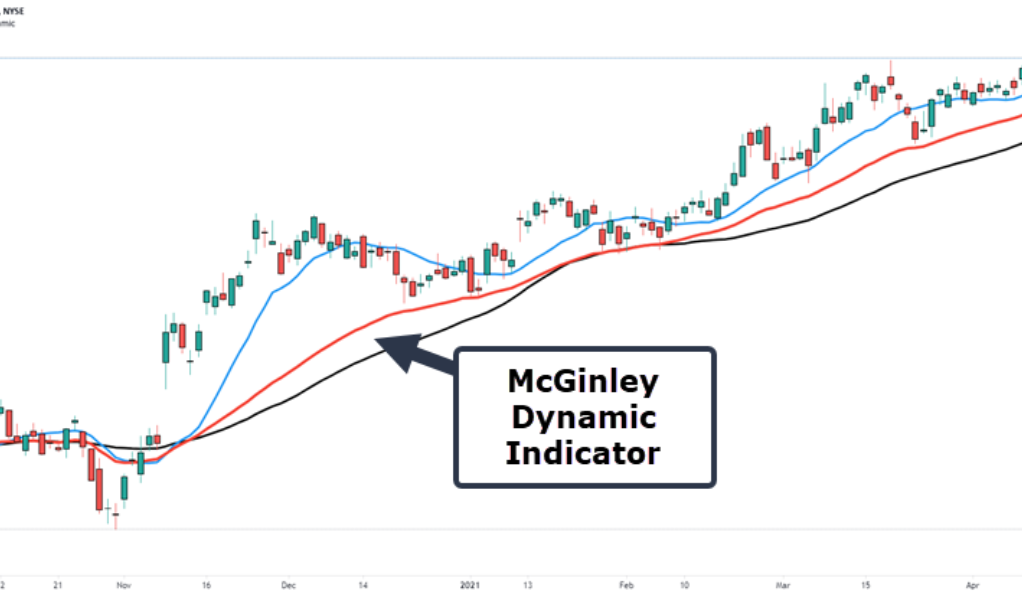
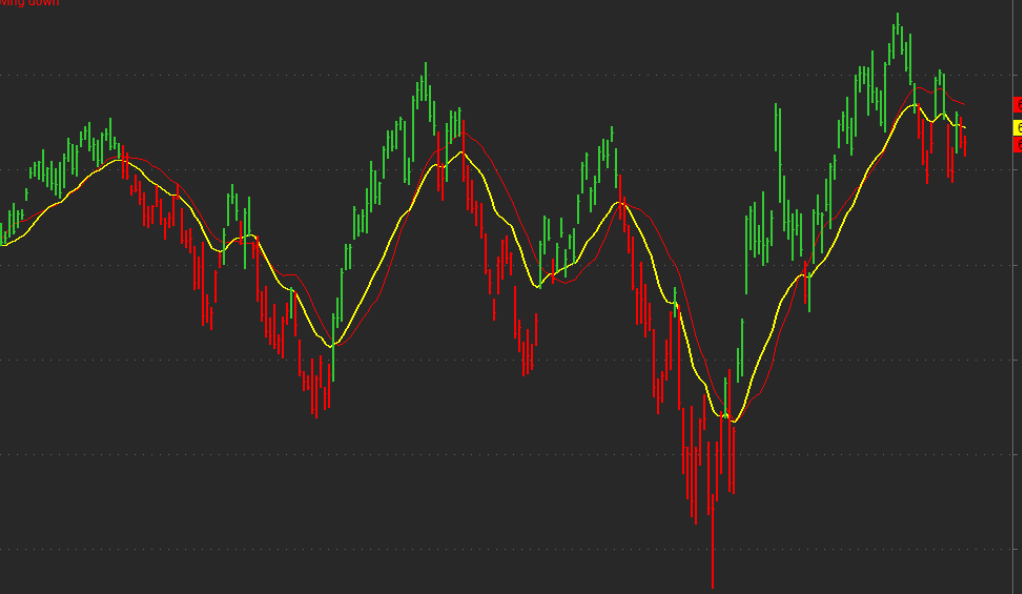
The McGinley Dynamic is a dynamic moving average developed by John McGinley, a renowned technician and market analyst. Unlike traditional moving averages, which are based on fixed time periods, the McGinley Dynamic adjusts its speed according to market conditions. This dynamic nature makes it more responsive and reliable, as it takes into account changes in volatility and price action. By smoothing out price fluctuations and adapting to market dynamics, this indicator aids traders in identifying key support and resistance levels more accurately.
The McGinley Dynamic achieves its adaptability by incorporating a formula that automatically adjusts the moving average’s time period. When the market is trending strongly, the moving average speeds up, providing traders with a more responsive indicator. Conversely, during periods of low volatility or consolidation, the moving average slows down, minimizing false signals and noise. This adaptive feature makes the McGinley Dynamic an excellent tool for capturing trends and filtering out market noise.
Unveiling the Larry Williams Proxy Index
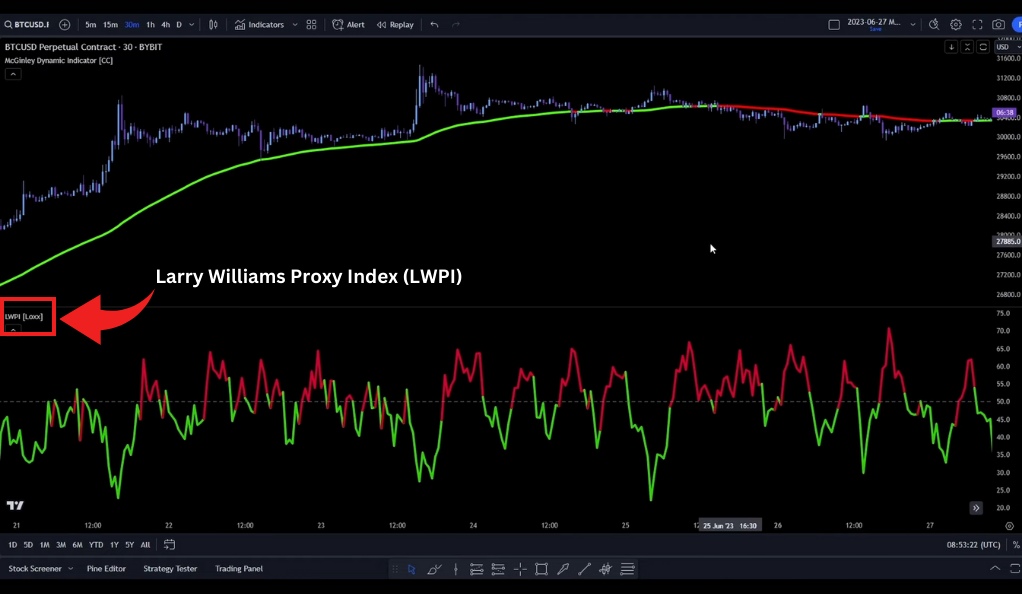
Developed by the legendary trader Larry Williams, the Larry Williams proxy index is a momentum oscillator designed to measure the speed and change of price movements. This indicator helps traders identify overbought and oversold conditions, providing valuable insights into market sentiment. By incorporating the Larry Williams proxy index into our trading strategy, we can enhance our understanding of trend reversals and potential entry and exit points.
The Larry Williams proxy index calculates its values by analyzing the relationship between the current closing price and the range of prices over a given time period. By comparing the current price to the highest and lowest prices within that timeframe, the indicator determines whether the market is experiencing overbought or oversold conditions. Traders can use these signals to identify potential reversals or exhaustion in the market, allowing them to make informed decisions regarding their trades.
Harnessing the Trend Direction Force Index
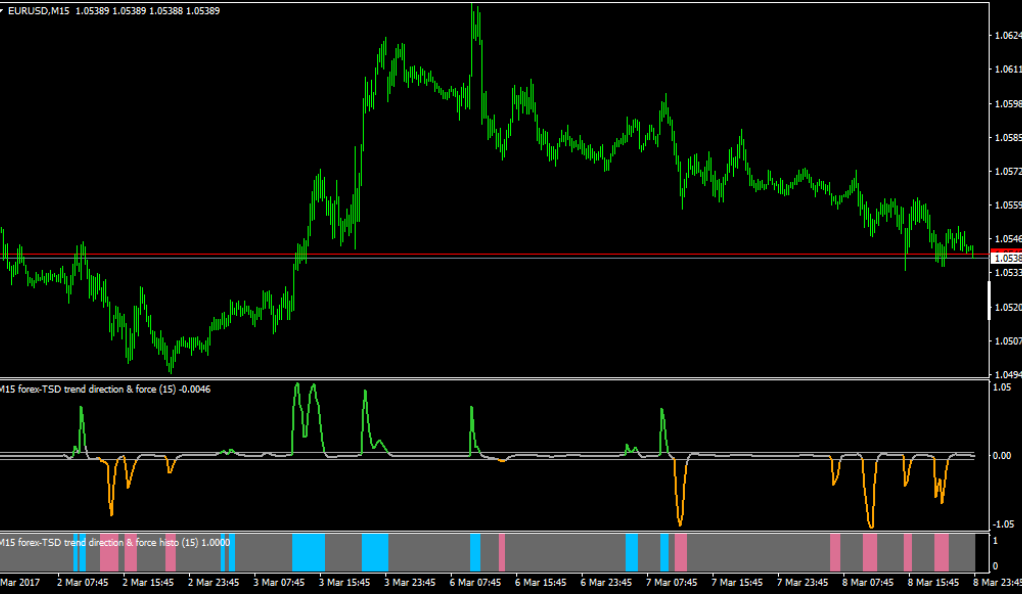
The Trend Direction Force (TDF) index, developed by Alexander Elder, is a powerful tool that quantifies the strength and direction of a trend. By combining price and volume data, the TDF index measures the conviction of market participants and provides traders with crucial insights into the underlying forces driving the trend.
The TDF index calculates its values by considering the relationship between price and volume. When the index value is positive, it suggests that buyers are dominant in the market, indicating a bullish trend. Conversely, negative values indicate that sellers are in control, signaling a bearish trend. By monitoring the TDF index, traders can confirm the strength of a trend and make more informed decisions about entering or exiting trades.
The Synergy of Indicators
Now that we have examined each indicator individually, let’s explore how they synergize to form a robust trading strategy. The McGinley Dynamic, with its adaptive nature, provides us with a moving average that accurately reflects current market conditions. This helps us identify trends and significant support and resistance levels more effectively. By incorporating the Larry Williams proxy index, we add a momentum analysis component to our strategy, allowing us to spot potential reversals and overbought/oversold conditions. Finally, the TDF index provides us with insights into the strength and conviction behind a trend, further validating our trading decisions.
These three indicators work in harmony to provide a comprehensive and reliable framework for traders to base their decisions on. By combining the adaptive moving average, the momentum oscillator, and the trend strength indicator, we can significantly improve our trading outcomes and increase the probability of success.
The Rules of the Strategy
To implement this advanced trading strategy effectively, it is crucial to follow clear rules. Traders should first identify the prevailing trend by analyzing price action and the position of the McGinley Dynamic. Additionally, adding filters such as candlestick patterns or technical indicators can help confirm signals generated by the indicators. These rules ensure alignment with market sentiment and increase the accuracy of trades.
- Identifying the Trend
In the world of trading, accurately identifying the prevailing trend is a fundamental aspect of any successful strategy. Before entering a trade, traders must assess whether the market is exhibiting a bullish or bearish trend. This crucial step enables traders to align their trades with the broader market sentiment, significantly enhancing their probability of success.
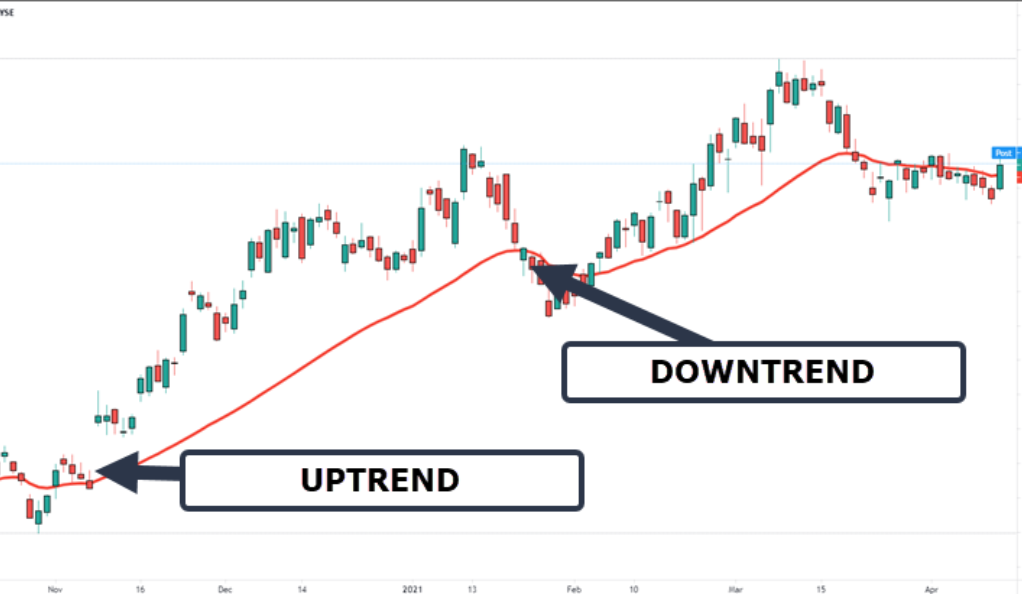
To determine the trend direction, traders employ various techniques, with price action analysis and the McGinley Dynamic playing pivotal roles. Price action analysis involves studying the patterns and movements of price on charts, seeking clues and insights into the market’s overall sentiment. Traders look for higher highs and higher lows in an uptrend, indicating a bullish bias, or lower highs and lower lows in a downtrend, signaling a bearish bias.
Complementing price action analysis, the McGinley Dynamic adds an additional layer of confirmation to identify the trend direction accurately. Unlike traditional moving averages that use fixed time periods, the McGinley Dynamic adjusts its speed based on market conditions. This dynamic nature allows it to respond more effectively to changes in volatility and price action. Traders often observe the relationship between the price and the position of the McGinley Dynamic to determine whether the trend is bullish or bearish.
- Adding Filters
In addition to the core indicators of the strategy, incorporating additional filters can significantly enhance the accuracy of trades. These filters act as a safety net, helping traders confirm signals generated by the McGinley Dynamic, the Larry Williams proxy index, and the Trend Direction Force (TDF) index. By reducing the likelihood of false signals, these filters contribute to increased profitability and more reliable trading decisions.
One popular filter used by traders is the analysis of candlestick patterns. Candlestick patterns provide valuable insights into market sentiment and potential trend reversals. Traders can look for patterns such as doji, hammer, engulfing, or spinning tops to confirm the signals generated by the core indicators. For example, if the McGinley Dynamic indicates a bullish trend and a bullish engulfing pattern forms, it reinforces the bullish bias and adds confidence to the trade setup.
Another essential filter is the use of support and resistance levels. These levels represent areas where the price tends to find support or encounter resistance, resulting in potential reversals or continuation of the trend. By considering support and resistance levels alongside the signals from the core indicators, traders can validate their trading decisions. For instance, if the Larry Williams proxy index indicates an overbought condition and the price approaches a strong resistance level, it strengthens the case for a potential price reversal and offers an opportunity to take profits or consider a short position.
Backtesting Results
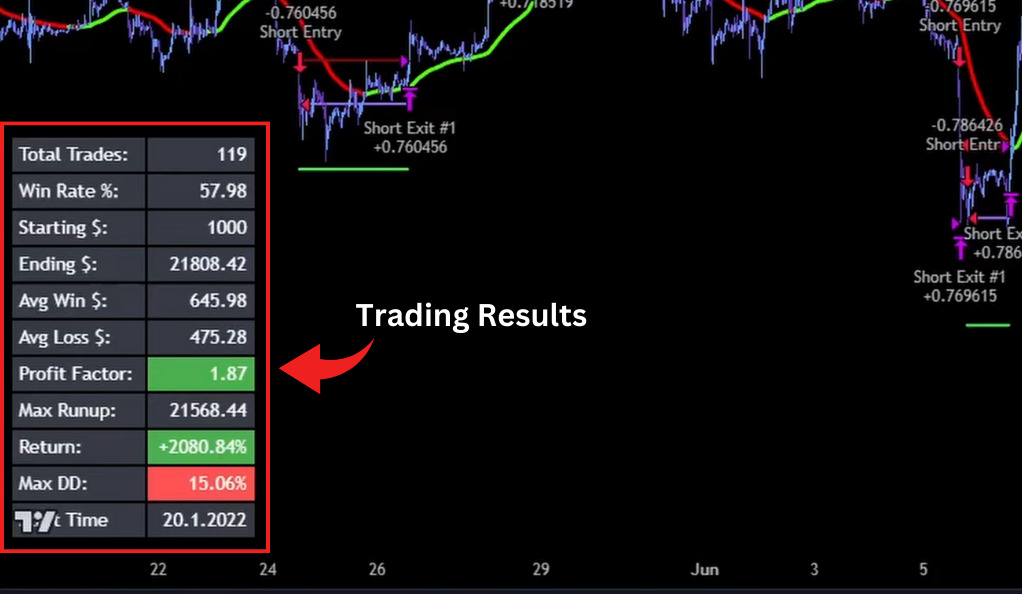
To assess the effectiveness of the strategy, thorough backtesting is crucial. By applying the rules to historical market data, we can gain insights into the strategy’s performance and validate its potential. In our backtesting, we analyzed various markets and timeframes, and the results showed a win rate of 57% and a remarkable return of over 2,000%. These findings highlight the strategy’s potential profitability when implemented correctly.
It is important to note that backtesting provides valuable information about historical performance, but it does not guarantee future results. Traders should always exercise caution and adapt their strategies based on current market conditions and risk management principles.
Conclusion
In conclusion, mastering the art of advanced trading strategies requires a deep understanding of indicators and their synergistic effects. By combining the McGinley Dynamic, the Larry Williams proxy index, and the Trend Direction Force index, traders can unlock a unique approach that offers valuable insights into market trends, momentum, and trend strength. The seamless integration of these indicators, coupled with additional filters, empowers traders to make informed decisions and significantly increase their chances of success.
However, it is important to remember that no trading strategy is foolproof, and success in trading ultimately depends on sound risk management, discipline, and continuous evaluation. Traders must practice their strategies diligently, adapt to changing market conditions, and remain flexible in their approach. Embrace the power of indicators, refine your skills, and unleash the potential for profitable trading.
Ainu Token aims to offer impartial and trustworthy information on cryptocurrency, finance, trading, and shares. However, we don't provide financial advice and recommend users to conduct their own studies and thorough checks.
Comments (No)