In the fast-paced world of trading, strategies play a vital role in providing a structured approach to capitalize on market opportunities. The scalping trading strategy, known for its short-term and rapid execution of trades to profit from small price movements, has garnered popularity among traders. However, its effectiveness hinges on several factors, and backtesting serves as a crucial tool to assess its performance. During the backtesting process, historical market data is used to simulate the strategy’s performance, helping traders evaluate its potential under various market conditions. This analysis allows traders to identify strengths and weaknesses, refine the strategy, and gain insights into its overall profitability and risk management capabilities. Nevertheless, it’s important to remember that past performance does not guarantee future results, and real-time implementation of the scalping strategy demands discipline, precision, and adaptability to succeed in the ever-changing financial markets.
What is Backtesting?
Backtesting is a crucial analytical tool employed by traders to assess the effectiveness of a trading strategy. By applying the strategy to historical market data, traders can simulate how it would have performed in past market conditions. This allows them to gain valuable insights into the strategy’s strengths and weaknesses, as well as its potential risks and profitability. During backtesting, traders can analyze the strategy’s performance under various market scenarios, helping them to refine and optimize the approach before implementing it in real-time. However, it’s important to note that while backtesting provides historical performance data, it does not guarantee future results, as market conditions are constantly evolving, and unforeseen events can impact trading outcomes.
In conclusion, backtesting is a powerful tool that allows traders to evaluate the viability of a trading strategy by testing it against historical market data. By understanding how the strategy would have performed in the past, traders can make more informed decisions and better tailor their approach to suit prevailing market conditions. While backtesting offers valuable insights, traders should always exercise caution and combine it with other forms of analysis to adapt their strategies and stay responsive to the ever-changing financial landscape.
The Scalping Trading Strategy
During the backtesting process, historical market data would be used to simulate the application of the claimed strategy over a significant period. The analysis would help determine whether the strategy consistently delivered the claimed results across various market conditions or if the high-profit and win rate figures were merely the result of selective data mining or chance occurrences in the past. Additionally, transaction costs, slippage, and other real-world factors should be considered during backtesting to ensure a more accurate representation of the strategy’s performance.
While impressive results in backtesting may indicate a strategy’s potential, real-time trading involves a dynamic and unpredictable market environment. Traders should be cautious about solely relying on past performance and should consider factors like risk management, adaptability, and psychological discipline to ensure long-term success. Moreover, it is crucial to remember that trading always carries inherent risks, and no strategy can guarantee consistent profits in the volatile and ever-changing world of cryptocurrencies or any other financial markets.
The Backtesting Process
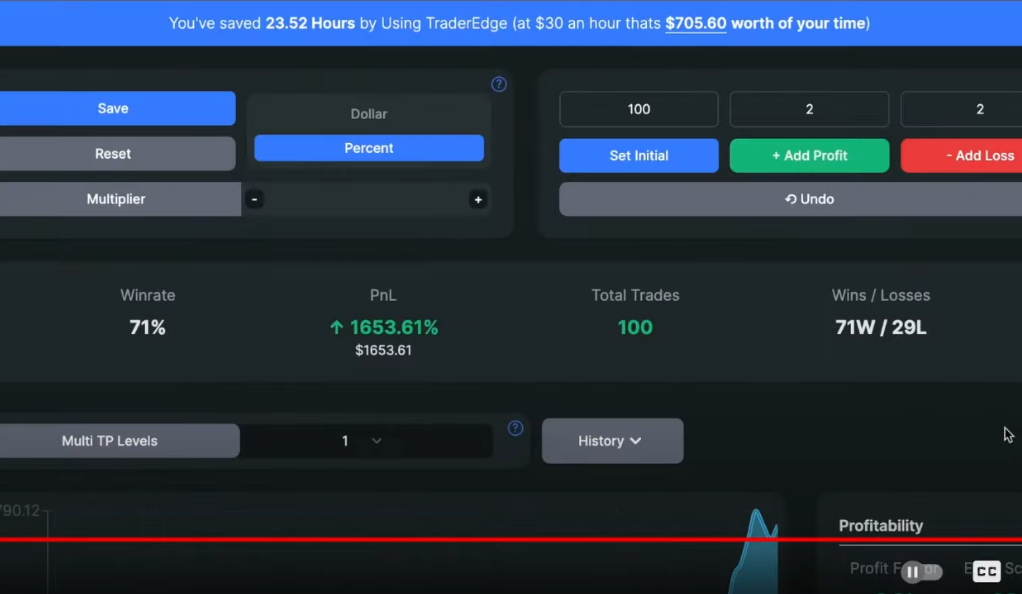
In the backtesting process conducted the trading strategy was subjected to 100 simulated trades using an initial balance of $1000 and a risk per trade set at 2%. The results indicated that after the 100 trades, the account balance had grown to $1043, representing a profit and loss (PnL) of 4.3%. The strategy achieved a win rate of 53%, meaning that slightly more than half of the trades resulted in profitable outcomes. These backtesting results provide valuable insights into the strategy’s performance over the tested period, allowing traders to assess its potential effectiveness and risk management capabilities.
While the backtesting results offer some understanding of the strategy’s historical performance, it is essential to interpret them cautiously. A win rate of 53% suggests that the strategy generated more winning trades than losing ones during the backtesting period. However, traders should consider additional factors such as transaction costs, slippage, and market conditions that may significantly impact real-world trading results. Moreover, the relatively modest PnL of 4.3% over 100 trades highlights the importance of managing risk and setting realistic profit expectations when employing any trading strategy. To validate the strategy further, it would be beneficial to continue monitoring its performance in real-time trading and potentially conduct additional backtests with different parameters or time periods. Additionally, traders should continuously adapt and refine their strategies based on new market data and changing conditions to stay ahead in the competitive world of trading.
The Trading Strategy Explained
The trading strategy outlined involves a specific approach to managing stop losses and targets. Initially, when a trade is opened, the trader sets a stop loss level to limit potential losses if the market moves against their position. Once the price reaches the first target, which is set at a distance equal to the initial risk taken in the trade (1:1 risk to reward ratio), the stop loss is adjusted to the trade’s entry point, effectively moving it to break even. This adjustment is intended to protect the trader from any potential losses in the trade and eliminates the risk of losing capital if the market reverses after hitting the first target.
The trading strategy involves adjusting the stop loss to break even when the price reaches the first target (1:1 risk to reward ratio) and then moving it to the first target level when the price reaches the second target (2:1 risk to reward ratio). This allows traders to secure profits equal to their initial risk if the market reverses from the second target level. While this strategy can be effective, traders should exercise caution, adapt to changing market conditions, and consider other analysis techniques to maximize its potential success in real-time trading.
The Indicators Used
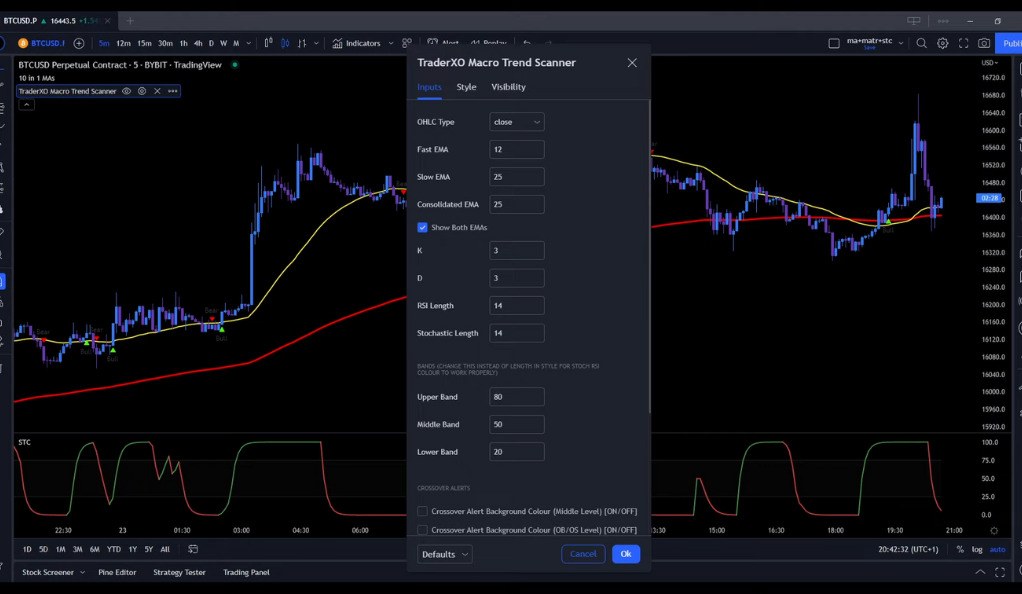
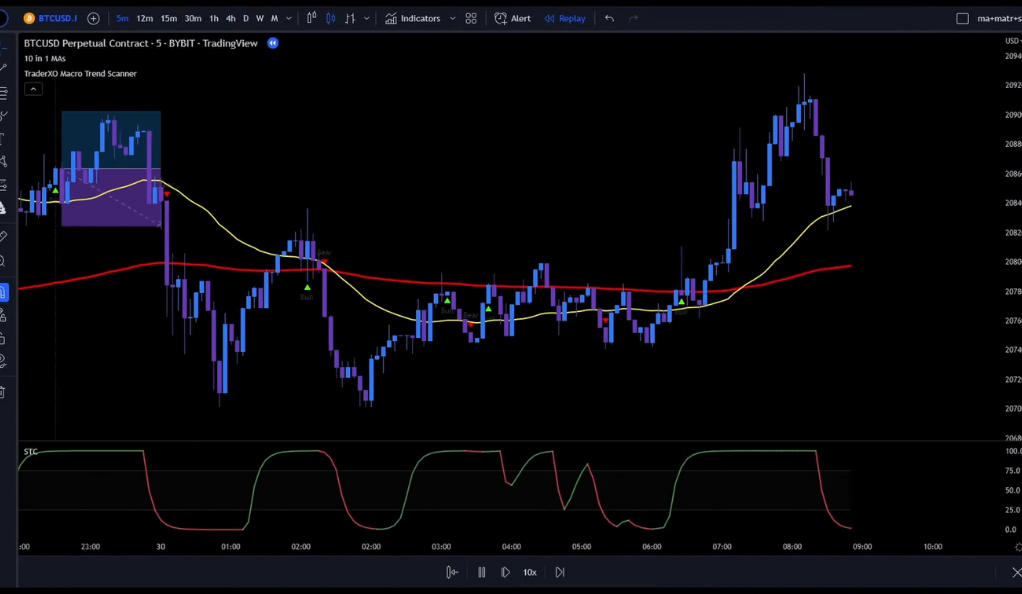
In this trading strategy, three indicators were used to aid decision-making. The first indicator, “10 in 1 Different Moving Averages” by hiimannshu, likely combines various moving averages with different time periods to identify trends and potential entry and exit points. The second indicator, “Trader XO Macro Trend Scanner” by btc charlie, is designed to spot significant market trends and potential reversal points, helping traders align their trades with the prevailing market direction. These indicators aim to provide traders with valuable insights into market momentum, direction, and trend strength, assisting them in making informed trading choices.
Lastly, the strategy includes the “STC Indicator, a better MACD” by shayankm, an enhanced version of the traditional MACD. This indicator aims to identify overbought/oversold conditions and potential trend changes, offering more accurate and timely signals compared to the standard MACD. By combining these three indicators, the trading strategy aims to increase the likelihood of successful trades. However, traders should remember that no set of indicators guarantees profitability, and they must carefully assess each indicator’s performance and suitability within their overall trading approach. Regularly reviewing and optimizing indicator choices based on market dynamics and individual trading goals can be beneficial.
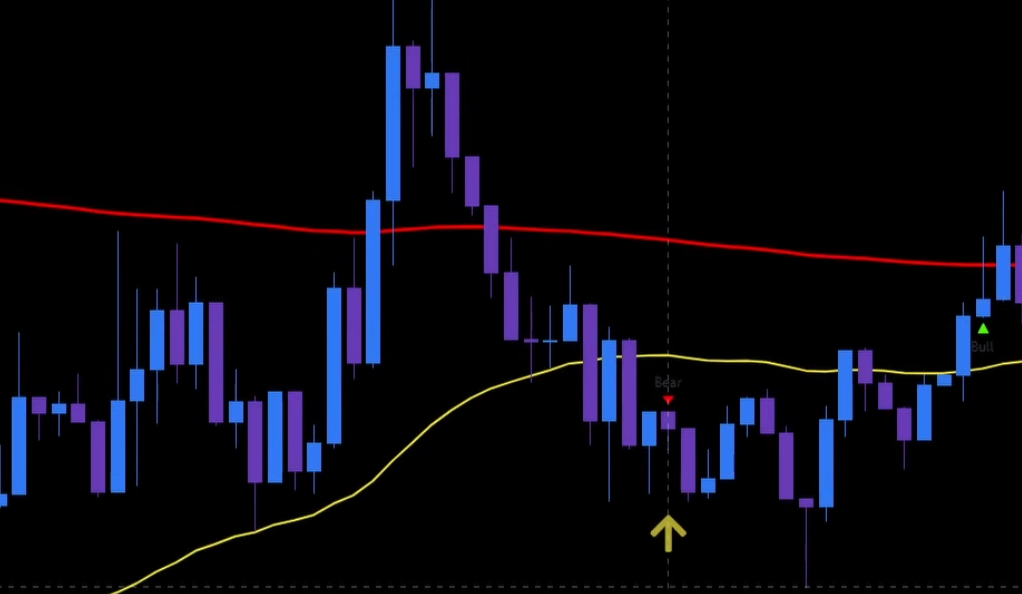
Entry Rules for a Long Position
To enter a long position, the trading strategy requires several conditions to be met. Firstly, the price action must be moving above the moving averages. Additionally, the 50-week moving average (50-WMA) should be positioned above the 200-exponential moving average (200-EMA). Furthermore, the price action needs to undergo a pullback into the 50-WMA. A bull signal, indicated by a green triangle, must also be present. Moreover, the STC-Line should be printed in green and pointing upwards above the 75-Level. To manage risk, the stop loss is placed at the recent swing low, while the target is set at a risk to reward ratio of 1:1. Following these criteria, the trading strategy seeks to identify potential long entry points with the aim of maximizing gains and minimizing losses.
Entry Rules for a Short Position
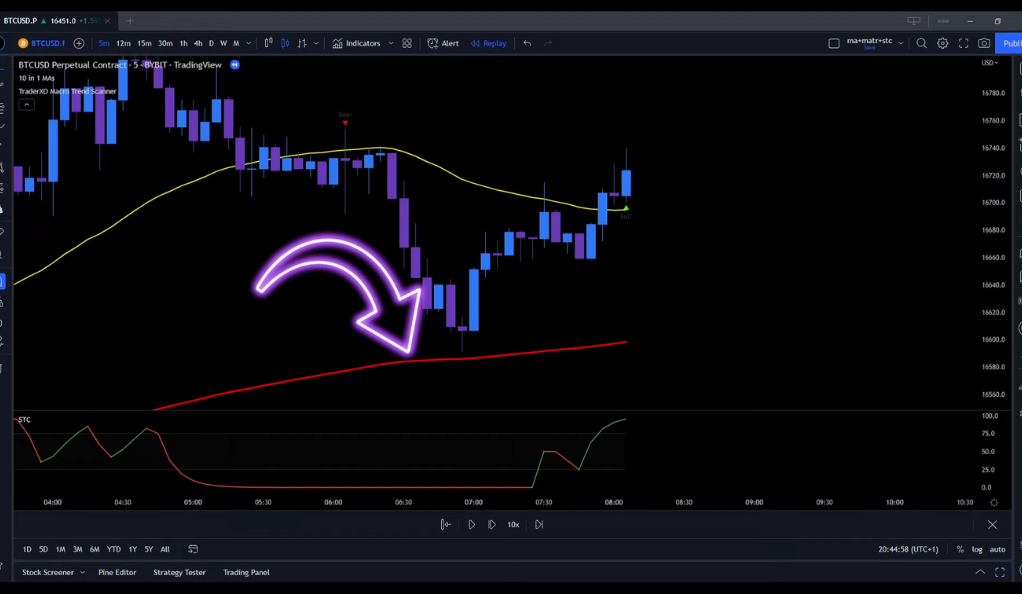
For a short position, the entry rules are essentially the opposite of the long position rules. The price action must be moving below the moving averages, and the 50-week moving average (50-WMA) should be positioned below the 200-exponential moving average (200-EMA). Additionally, the price action needs to experience a pullback below the 50-WMA. A bear signal, indicated by a specific signal such as a red triangle or any other predetermined criteria, must also be present. Furthermore, the STC-Line should be printed in red and pointing downwards below the 25-Level. To manage risk, the stop loss is placed at the recent swing high, and the target is set at a risk to reward ratio of 1:1. These criteria guide the trading strategy in identifying potential short entry points, aiming to profit from downward price movements while minimizing potential losses.
Invalid Signals
In this trading strategy, it’s important to note that not all signals are valid. For a long position, the signal is not valid if the STC-Line is printed in red or if the 50-week moving average (50-WMA) is below the 200-exponential moving average (200-EMA). Likewise, for a short position, the signal is not valid if the 50-WMA is not below the 200-EMA or if the STC-Line is not printed in red. These criteria help filter out potential false signals and ensure that only appropriate entry points are considered, increasing the strategy’s accuracy and effectiveness in identifying profitable trading opportunities.
Conclusion
Backtesting is a crucial step in validating a trading strategy. It provides a glimpse into the potential performance of the strategy, helping traders make informed decisions. The scalping trading strategy, as backtested, showed promising results, but like all trading strategies, it’s not without risks. Always remember, the key to successful trading lies not just in the strategy, but also in the discipline and risk management of the trader.
Ainu Token aims to offer impartial and trustworthy information on cryptocurrency, finance, trading, and shares. However, we don't provide financial advice and recommend users to conduct their own studies and thorough checks.
Comments (No)