In the dynamic and often unpredictable world of trading, having a robust strategy is the cornerstone of success. Among the myriad of strategies available, one that has been making waves in the trading community is the Smart Money Concepts strategy. This strategy, which leverages the ICT SM Trades indicator on the TradingView platform, claims to give traders an edge over 95% of their peers. But what makes this strategy so special? Let’s embark on a journey to unravel the secrets of this intriguing trading approach.
The ICT SM Trades Indicator: A Powerful Tool for Traders
In the intricate world of trading, having the right tools at your disposal can make all the difference. One such tool that has been making waves in the trading community is the ICT SM Trades indicator. This powerful tool, which forms the backbone of the Smart Money Concepts strategy, is freely available on the TradingView platform and is designed to give traders a significant edge in the market.
A Visual Guide to Market Dynamics
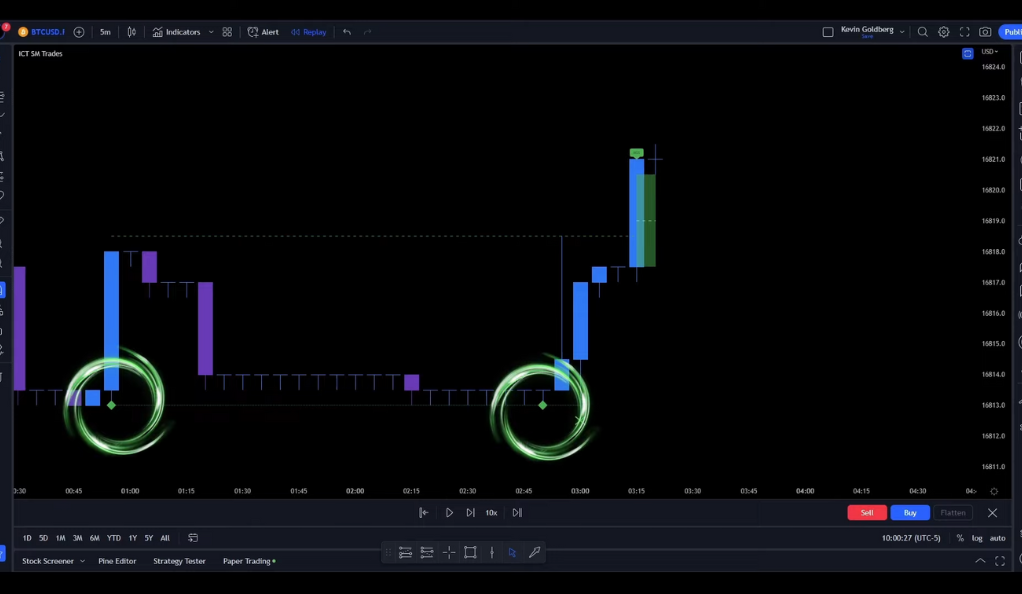
The ICT SM Trades indicator is not just a tool, but a visual guide that helps traders navigate the often turbulent waters of the trading world. It uses a system of color-coded rectangles and crosses to signal market shifts and liquidity fills. These visual cues provide traders with a clear picture of market conditions, enabling them to make informed decisions.
Identifying Trading Opportunities
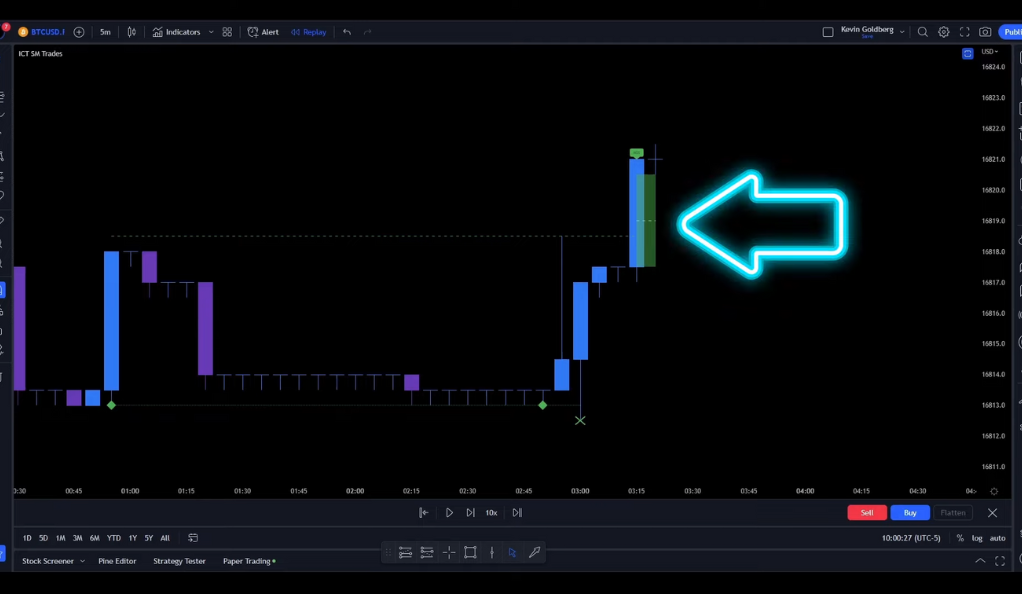
One of the key features of the ICT SM Trades indicator is its ability to identify potential trading opportunities. By analyzing specific market conditions, the indicator can signal when the market may be ripe for a trade. This can help traders seize opportunities that they might otherwise miss, potentially leading to more profitable trades.
Navigating Market Shifts and Liquidity Fills
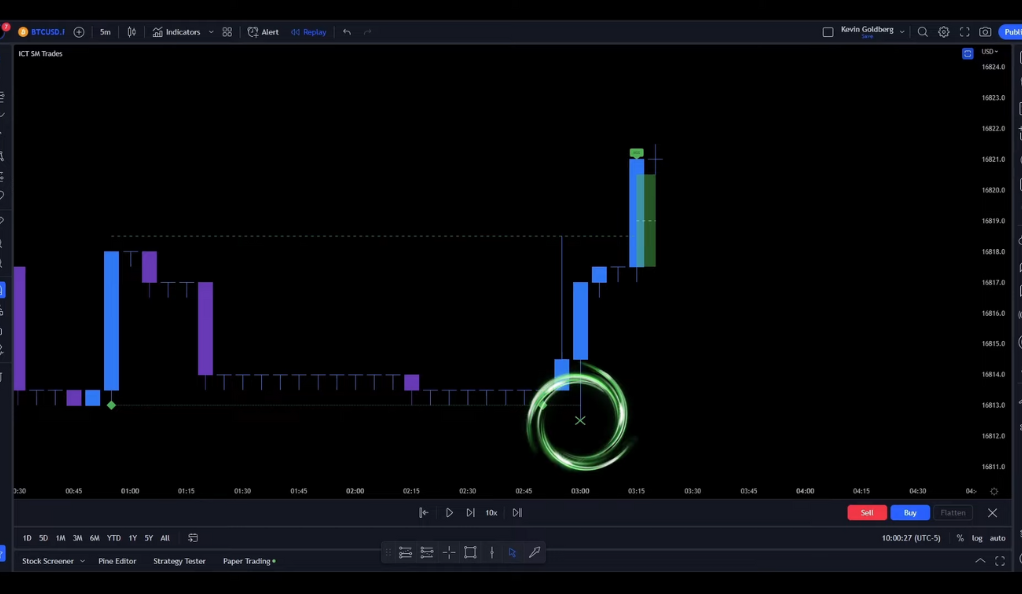
The ICT SM Trades indicator uses color-coded rectangles and crosses to signal market shifts and liquidity fills. A market shift, represented by a change in the color of the rectangles, indicates a potential change in market direction. On the other hand, a liquidity fill, represented by a cross, suggests that there is a significant amount of buying or selling activity in the market. By keeping an eye on these signals, traders can stay one step ahead of the market, positioning themselves to profit from these shifts.
Entering a Long Position: A Step-by-Step Guide
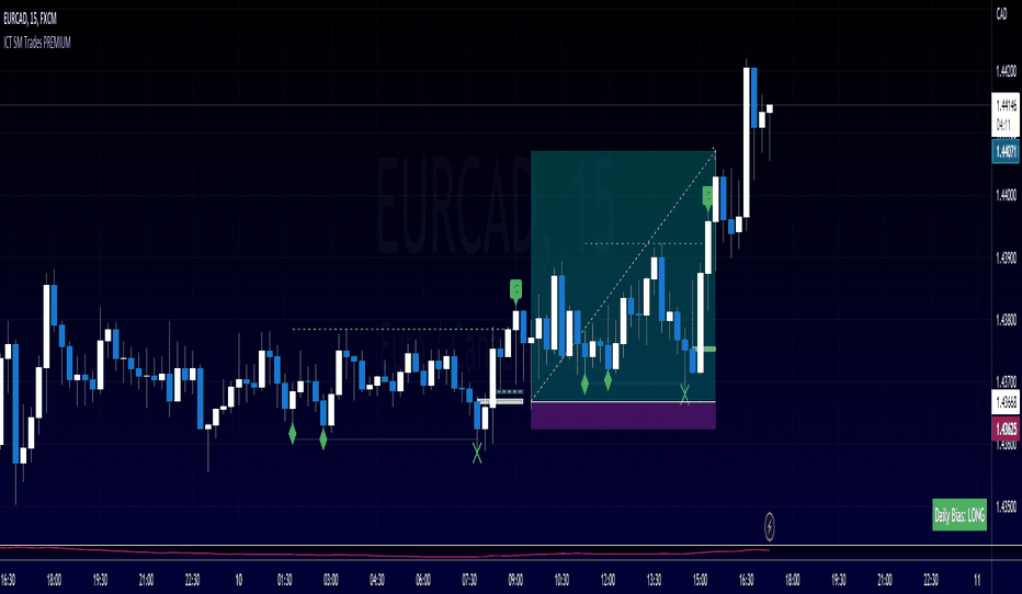
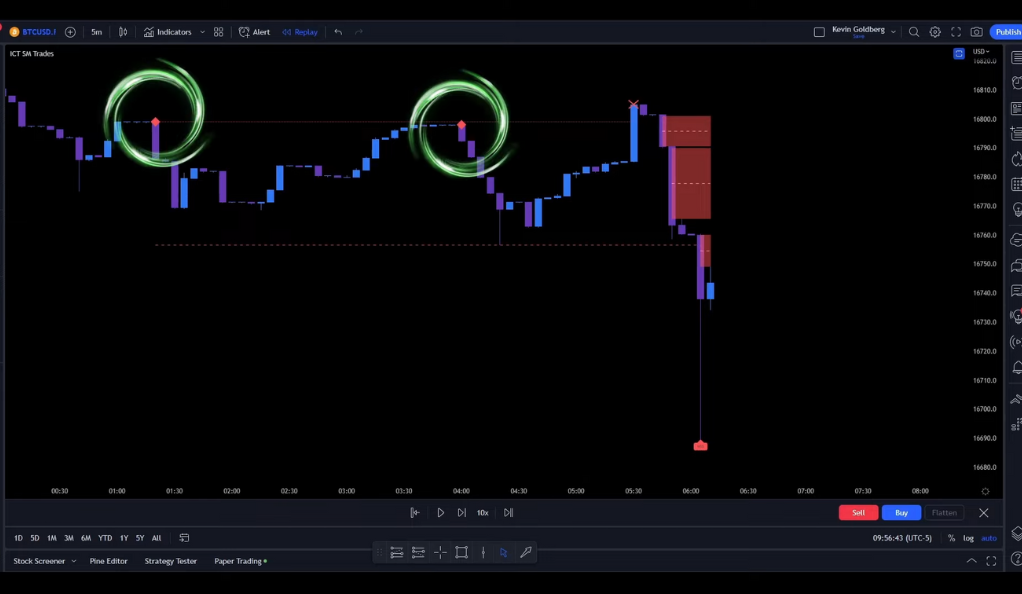
Step 1: Spotting Two Equal Lows
The journey to entering a long position using the Smart Money Concepts strategy begins with the identification of two equal lows in the market. These are represented by two green rectangles on the ICT SM Trades indicator. This pattern suggests a potential upward trend, laying the groundwork for a long position.
Step 2: Waiting for the Green Cross
Once the two equal lows have been identified, the next step is to patiently wait for a Green Cross to be printed below this price. This Green Cross is a crucial signal, indicating a liquidity fill and suggesting that the market could be gearing up for an upward move.
Step 3: Observing the Bullish ICT Fair Value Gap
The third step in this process involves observing a bullish ICT fair value gap, which should be accompanied by a shift in market structure. This is represented by a green box and a green Market Structure Shift (MSS) label on the indicator. This shift is a strong indication that the market dynamics are changing, potentially favoring a long position.
Step 4: The Retest
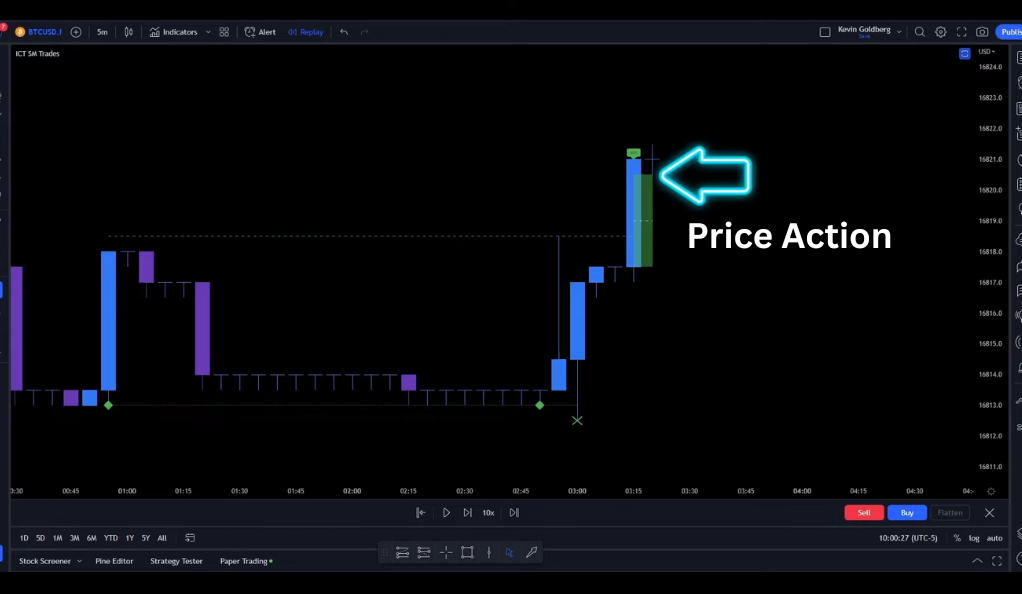
The final step before entering a long position is to wait for the price action to retest the level and get rejected off of it. This rejection is a key confirmation that the market is ready to move upwards. However, if the next candle after the MSS label is not the one that gets rejected, the signal is ignored, demonstrating the strategy’s emphasis on precision and timing.
Entering a Short Position: The Flip Side of the Coin
The process for entering a short position is a mirror image of the long position process, but with a bearish perspective. Instead of looking for two equal lows, traders should be on the lookout for two equal highs, represented by two red rectangles. A Red Cross above this price indicates a liquidity fill, while a bearish ICT fair value gap signals a shift in market structure. Just like with the long position, the price action must then retest the level and get rejected off of it, confirming the potential for a downward move.
Backtesting the Strategy: The Proof is in the Pudding
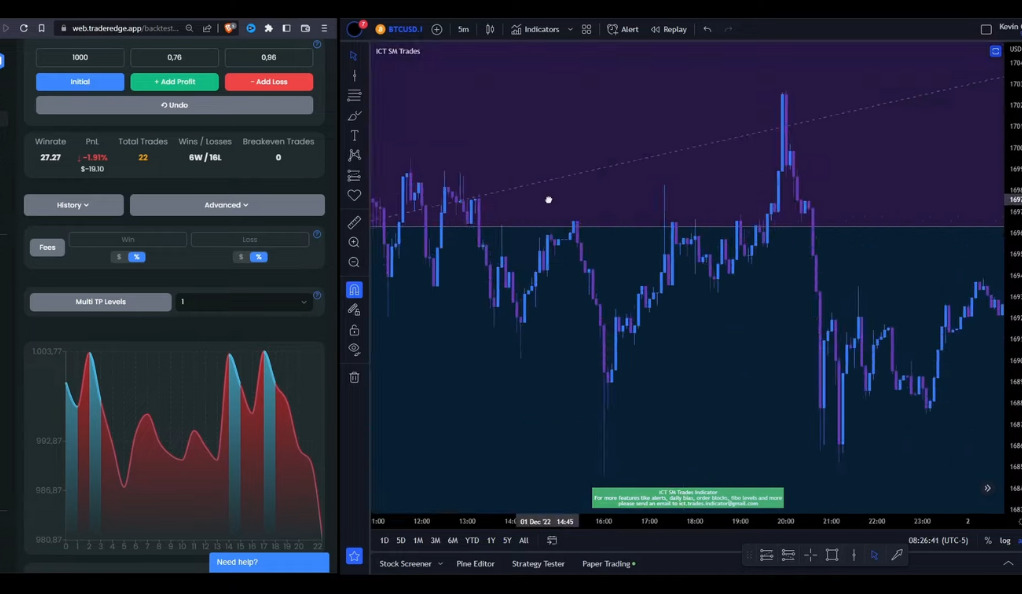
Backtesting is a critical component of any trading strategy. It allows traders to test their strategy using historical data to evaluate its effectiveness. In this case, the Smart Money Concepts strategy was backtested 100 times using the Trader Edge application. The initial balance was 1000 USD, and a leverage of 2x was used. The results were illuminating: a win rate of 39% and a profit of 4.36%. The account grew from 1000 USD to 1143 USD after 100 trades, demonstrating the potential profitability of this strategy.
Interpreting the Results: Beyond the Numbers
While a win rate of 39% might not seem impressive at first glance, it’s important to remember that trading is not about winning every trade. Instead, it’s about effectively managing risk and reward. The profit of 4.36% indicates that the strategy can be profitable over time, even with a lower win rate. This highlights the importance of patience and consistency in trading.
Refining the Strategy: The Role of Confluence
In the world of trading, a single indicator can sometimes provide a skewed perspective of the market. This is where the concept of confluence comes into play. Confluence, in the context of trading, refers to the alignment of multiple indicators or analysis techniques, providing a more robust and comprehensive view of market conditions. By incorporating confluence into the Smart Money Concepts strategy, traders can potentially enhance their decision-making process and increase the effectiveness of their trades.
Understanding Confluence

Confluence is like having a team of experts at your disposal, each providing their unique insights. When these insights align, they form a stronger, more reliable signal. In the case of the Smart Money Concepts strategy, the ICT SM Trades indicator is the primary expert. However, by adding another indicator into the mix, traders can gain additional insights, creating a confluence of signals.
Choosing the Right Indicator
The choice of the additional indicator depends largely on the trader’s personal preference and trading style. Some may opt for a simple moving average to identify the overall trend, while others may prefer a relative strength index to gauge the momentum. The key is to choose an indicator that complements the ICT SM Trades indicator and aligns with the trader’s understanding of the market.
Filtering Out False Signals
One of the main advantages of using confluence in trading is its ability to filter out false signals. For instance, the ICT SM Trades indicator might signal a potential long position, but the additional indicator might suggest that the market is in a downtrend. This divergence could help the trader avoid a potentially unsuccessful trade, demonstrating the power of confluence in refining trading strategies.
Enhancing Decision-Making Process
By providing a more comprehensive view of the market, confluence can significantly enhance the trader’s decision-making process. Instead of relying on a single indicator, traders can consider multiple perspectives, leading to more informed and confident trading decisions. This, in turn, can lead to improved trading performance and increased profitability.
Conclusion
The Smart Money Concepts strategy, underpinned by the ICT SM Trades indicator, offers a unique and nuanced approach to trading. While it doesn’t promise a win every time, its emphasis on risk management, market structure shifts, and precise timing can provide a solid foundation for traders. Like any strategy, it’s crucial to backtest and adjust it to suit your trading style and risk tolerance. So, are you ready to delve into the world of smart money concepts and potentially outsmart 95% of traders? The journey begins now.
Ainu Token aims to offer impartial and trustworthy information on cryptocurrency, finance, trading, and shares. However, we don't provide financial advice and recommend users to conduct their own studies and thorough checks.
Comments (No)