In the dynamic world of cryptocurrency trading, having effective strategies is crucial for achieving success. One popular strategy involves backtesting a trading method on the Bitcoin chart. Backtesting allows traders to simulate their trading rules on historical Bitcoin price data to evaluate their potential profitability.
The process of backtesting entails applying a set of predefined trading rules, such as entry and exit signals based on technical indicators or price patterns, to past Bitcoin market conditions. By replaying historical data, traders can assess how their strategy would have performed in the past and gain insights into its effectiveness. Backtesting provides an opportunity to identify strengths and weaknesses in the strategy, enabling traders to refine their methods before implementing them in real-time trading.
The results obtained from backtesting can be used to evaluate the profitability and risk associated with the trading strategy. Traders can analyze various metrics, including the number of trades executed, the percentage of winning trades, the average profit or loss per trade, and the overall profitability over the tested period. Additionally, backtesting allows traders to conduct scenario analysis by applying different parameters or variations of the trading strategy to observe their impact on performance.
It is important to note that while backtesting is a valuable tool, it does not guarantee future success. The cryptocurrency market is highly volatile, and market conditions can change rapidly. Traders should continuously adapt their strategies to account for evolving trends and conditions in the market. Nonetheless, backtesting provides traders with a means to gain confidence in their strategies, make informed decisions, and increase their chances of success in the ever-changing landscape of cryptocurrency trading.
The Strategy: An Overview
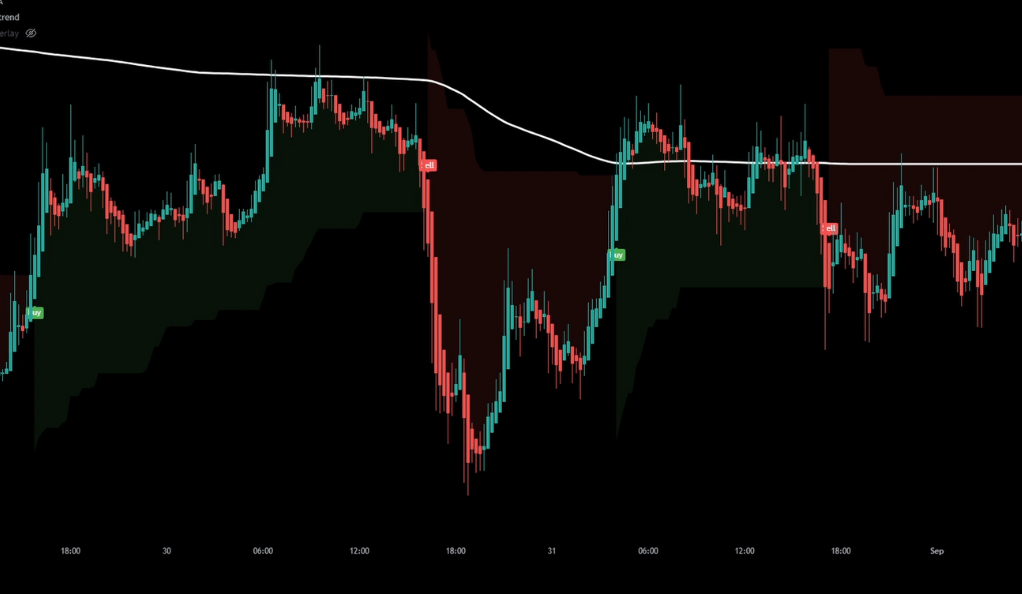
The strategy being discussed focuses on using the 15-minute timeframe on the Bitcoin chart while incorporating two specific indicators: the Trend Regularity Adaptive Moving Average (TRAMA) developed by Lux Algo and the Supertrend indicator.
The TRAMA indicator is designed to assess the strength and regularity of trends by dynamically adjusting its sensitivity based on the prevailing market conditions. It adapts its parameters to accurately capture trends, providing traders with valuable insights into the robustness of the ongoing trend. On the other hand, the Supertrend indicator combines the concepts of volatility and moving averages to generate signals indicating potential entry and exit points. It is commonly employed to determine favorable trading opportunities by signaling whether to buy or sell an asset.
By implementing these two indicators on the 15-minute timeframe using Haikin Ashi Candles, the strategy aims to identify advantageous trading prospects within the Bitcoin market. Traders can leverage the adaptive nature of the TRAMA indicator to gauge the strength of the trend, while the Supertrend indicator helps determine optimal entry and exit points. It is important to note that thoroughly backtesting and validating the strategy’s performance is essential before deploying it in live trading situations.
Setting Up the TRAMA Indicator
To begin implementing the strategy, the first step is to set up the TRAMA indicator. This involves configuring the indicator parameters to suit the specific trading requirements. Typically, the length parameter is set to 100, although it can be adjusted based on the trader’s preference and the market conditions being analyzed. Additionally, the line color and thickness can be customized to enhance visibility and make it easier to interpret the indicator’s signals.
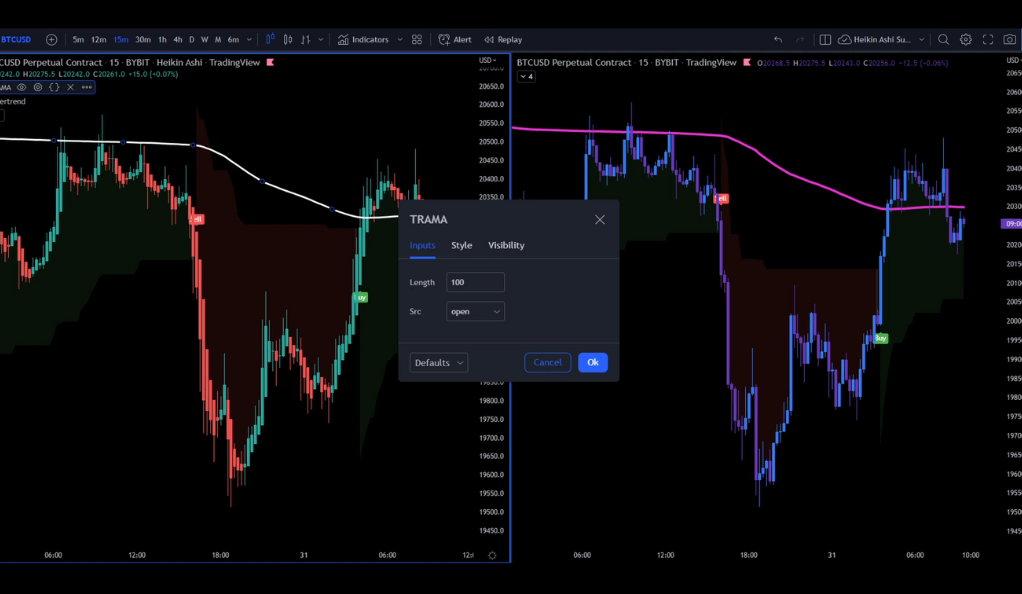
The TRAMA indicator plays a crucial role in the strategy by aiding in the identification of trends and assisting in determining optimal entry and exit points. By analyzing the movement of the TRAMA line in relation to the price action, traders can gain insights into the strength and direction of the prevailing trend. This information can be used to make informed trading decisions, such as entering a trade when the trend is strong and confirming an exit signal when the trend shows signs of weakening. Properly setting up the TRAMA indicator is essential for effectively implementing the strategy and maximizing its potential for successful trading outcomes.
Configuring the Supertrend Indicator
The next step in implementing the strategy is configuring the Supertrend indicator. This involves adjusting specific parameters to align with the desired trading approach. Firstly, the ATR (Average True Range) Period is typically set to 10, which determines the calculation period for the indicator’s volatility component. Traders may choose to modify this value based on their trading preferences and the market conditions being analyzed. Secondly, the Source parameter is set to HL2, which represents the average of the high and low prices. This choice considers both price extremes to calculate the Supertrend values. Lastly, the ATR Multiplier is set to 4.5, which determines the extent of volatility considered when generating the Supertrend signals. Traders can experiment with different multiplier values to suit their risk tolerance and market conditions. Additionally, certain options like Up Trend, UpTrend Begins, Down Trend, and DownTrendBegins can be checked or unchecked based on specific trading requirements.
The Supertrend indicator plays a vital role in the strategy by generating buy and sell signals. It combines the concepts of volatility and moving averages to identify potential trend reversals and entry/exit points. When the Supertrend line is below the price, it suggests a bullish signal or a potential buying opportunity. Conversely, when the Supertrend line is above the price, it indicates a bearish signal or a potential selling opportunity. Configuring the Supertrend indicator according to the specified parameters ensures accurate signal generation, enabling traders to make informed trading decisions based on the prevailing market conditions.
The Trading Rules
The trading rules for this strategy encompass utilizing the signals generated by the TRAMA and Supertrend indicators to make informed trading decisions. When the TRAMA indicator confirms a strong and consistent trend, traders may consider entering a trade in the direction of the trend. The Supertrend indicator complements this by providing buy signals when the Supertrend line is below the price and sell signals when it is above the price. Traders should follow these signals to initiate trades and exit positions when the opposite signals are generated. Adhering to these trading rules allows traders to capitalize on potential market trends and optimize their trading outcomes.
Entering Long Positions
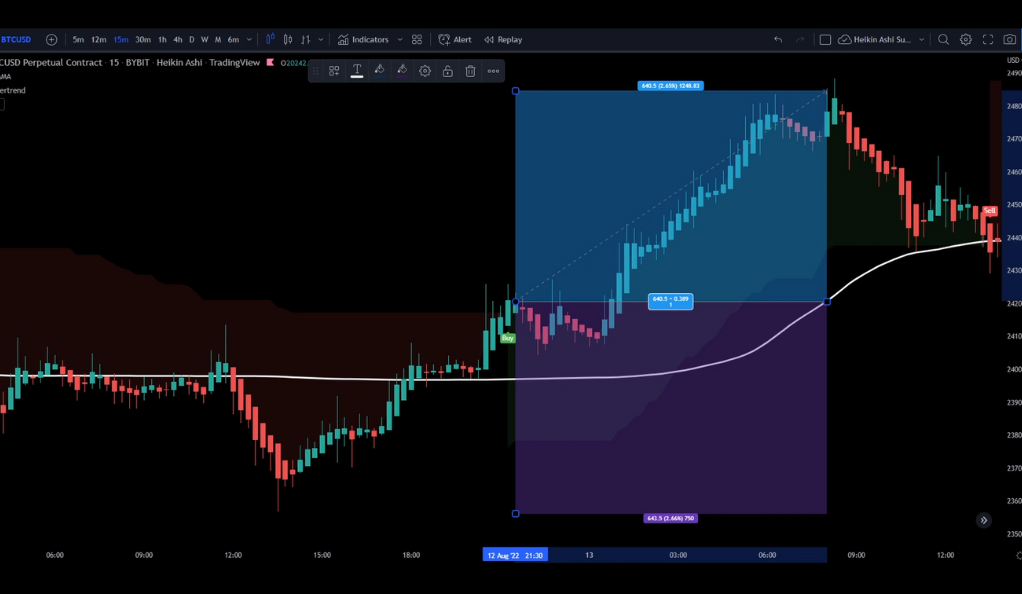
Long positions are entered when the price action is above the TRAMA line and a Buy signal is received from the Supertrend indicator. The stop loss is set at the recent swing low, and the target is a risk to reward ratio of 1 to 1. This rule ensures that traders take advantage of upward trends in the market.
Entering Short Positions
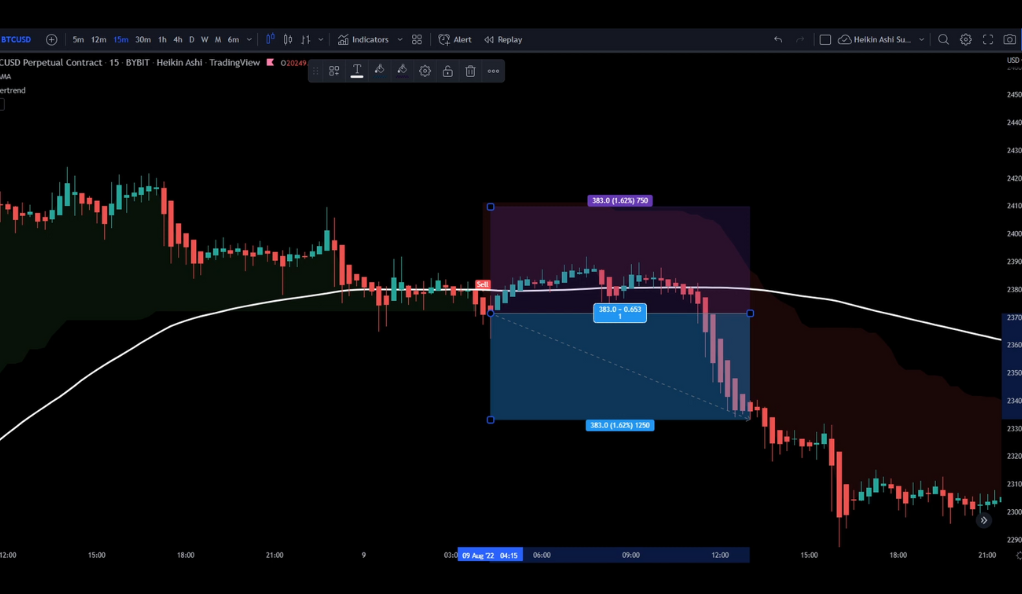
Conversely, short positions are entered when the price action is below the TRAMA line and a Sell signal is received from the Supertrend indicator. The stop loss is set at the recent swing high, and the target is a risk to reward ratio of 1 to 1. This rule is designed to profit from downward trends.
Limitations of the Strategy
While the strategy discussed above can be effective, it is important to acknowledge its limitations. One limitation is that bar replay, a common technique for backtesting strategies, cannot be directly applied to Haikin Ashi Candles. Bar replay allows traders to simulate trading on historical data, but since Haikin Ashi Candles have different calculations and construction compared to regular candles, the process becomes challenging. Additionally, the strategy may yield different entry signals when using regular candles versus Haikin Ashi Candles due to the unique characteristics of Haikin Ashi Candles.
This overlay indicator allows traders to observe the real entries and exits based on Haikin Ashi calculations while still using a regular candle chart for analysis. However, it is important to note that using this approach may not fully capture the precise signals generated by the Supertrend Indicator on Haikin Ashi Candles, as there is no Supertrend Indicator specifically calculated for Haikin Ashi Candles.
Backtesting Results
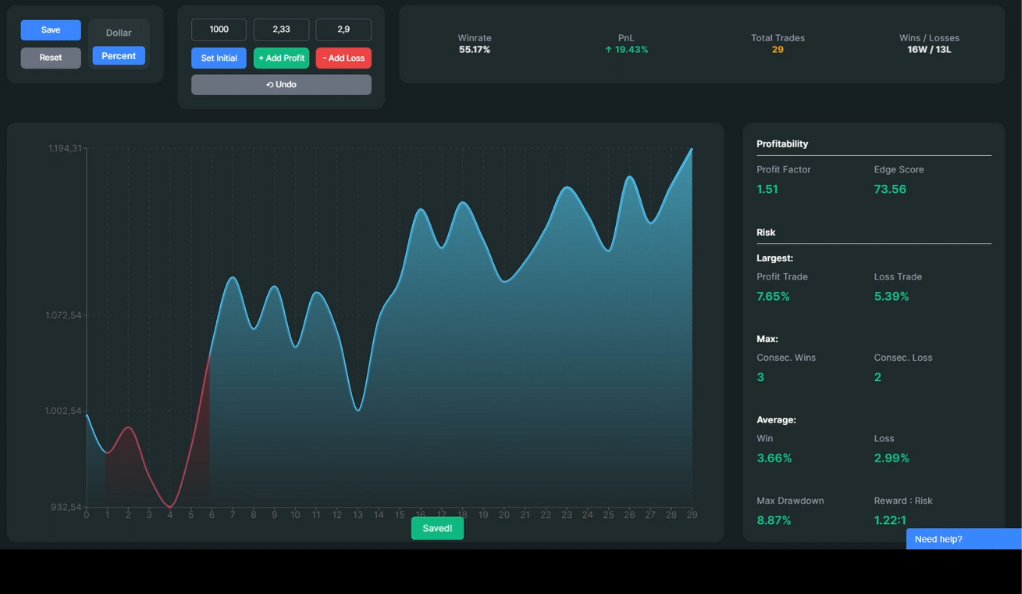
With an initial balance of 1000 USD and a risk management approach of 1% per trade, the strategy showed promising outcomes. The win rate of 55% indicates that more than half of the executed trades were profitable. Moreover, the strategy generated a profit and loss (PnL) of 19%, resulting in the account balance growing to 1190 USD. These backtesting results suggest that the strategy holds potential for profitability and may be worth considering for further evaluation and implementation in live trading.
It is important to interpret these backtesting results with caution, as past performance does not guarantee future success. The cryptocurrency market is highly volatile and subject to various factors that can impact trading outcomes. Traders should thoroughly analyze the strategy, conduct additional testing, and consider factors such as market conditions, risk management, and ongoing adjustments to optimize its performance in real-time trading scenarios.
Conclusion
In conclusion, this cryptocurrency trading strategy, despite its limitations, has proven to be effective in backtesting. It provides a systematic approach to trading, minimizing risks and maximizing potential profits. However, further backtesting is needed if a Supertrend Indicator based on Heikin Ashi Candles can be coded. This strategy, like any other, requires careful implementation and constant monitoring to ensure its continued success.
Ainu Token aims to offer impartial and trustworthy information on cryptocurrency, finance, trading, and shares. However, we don't provide financial advice and recommend users to conduct their own studies and thorough checks.
Comments (No)