The world of trading is filled with numerous strategies and indicators, each with its unique approach to help traders navigate the financial markets. One such tool that has gained popularity among traders is the Parabolic Stop and Reverse (SAR) indicator. This trend indicator is known for its simplicity and effectiveness in providing entry and exit signals. But what exactly is the Parabolic SAR, and how can you use it to enhance your trading strategy? Let’s dive in!
Understanding the Parabolic SAR
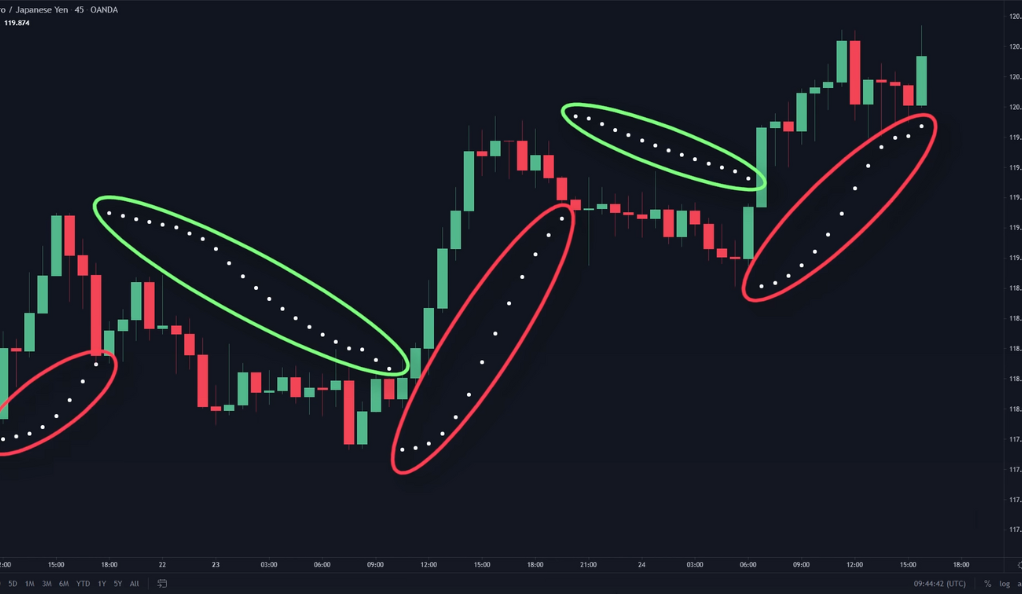
The Parabolic SAR is a trend-following indicator developed by J. Welles Wilder. It’s represented by dots that appear above or below the price bars on a chart. When the dots are positioned below the candle, it indicates an uptrend, suggesting it might be a good time to buy. Conversely, when the dots are above the candle, it signifies a downtrend, hinting at a potential selling opportunity.
The distance between the dot and the candle also plays a crucial role. It reflects the strength of the trend—the further the dot from the candle, the stronger the trend. This unique feature allows traders to gauge market momentum at a glance.
The Common Strategy: A Beginner’s Approach
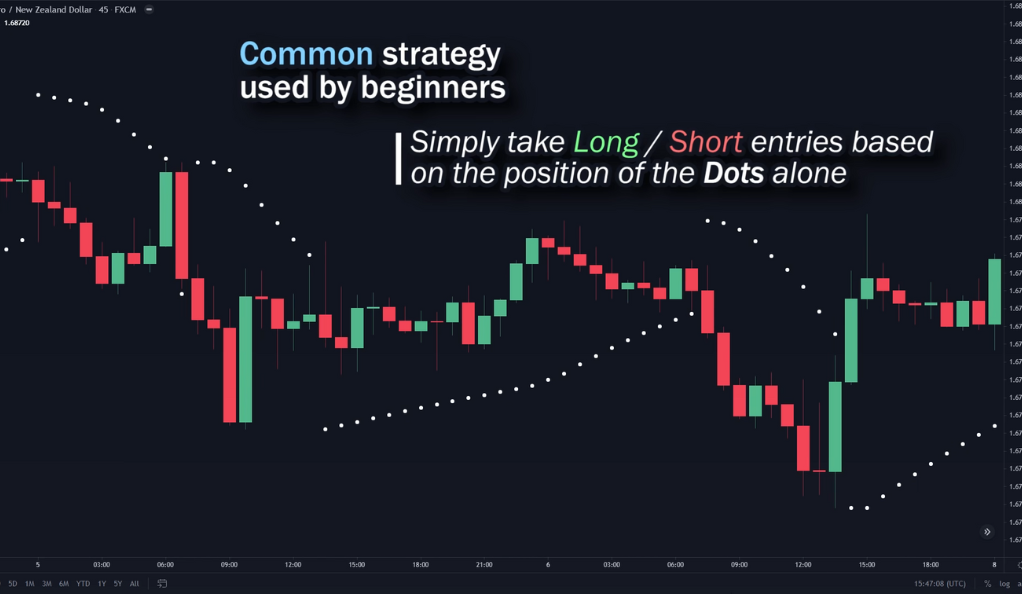
For novice traders, a common approach is to use the Parabolic SAR indicator to enter trades based on the position of the dots. This strategy is appealing due to its simplicity and ease of understanding. When the dots are below the price, it signals a bullish trend and suggests a long entry, while dots above the price indicate a bearish trend and prompt a short entry. However, it is important to recognize the limitations of this approach. The Parabolic SAR is primarily designed as a trend-following indicator, meaning it performs best in trending markets. In trending conditions, the indicator can provide accurate signals and capture significant price movements. However, markets are not always trending, and they can also exhibit periods of consolidation, ranging, or choppiness. During such phases, the Parabolic SAR may produce false signals, resulting in potential losses if used as a standalone strategy. Therefore, it is crucial for traders to consider additional factors and incorporate complementary indicators or techniques to confirm the signals generated by the Parabolic SAR and improve the overall effectiveness of their trading decisions.
While the beginner’s approach of using the Parabolic SAR for trade entries based on the position of the dots offers a straightforward strategy, it is essential to understand the contextual limitations of this approach. In trending markets, the Parabolic SAR can be a useful tool to capture and ride the momentum of a trend. However, markets go through different phases, including periods of consolidation or sideways movement. During these non-trending phases, the Parabolic SAR may generate false signals due to the frequent flipping of dots and provide unreliable entry points. To mitigate the risk of false signals and potential losses, traders should consider incorporating additional analysis techniques. This can include utilizing support and resistance levels, trend lines, or other indicators that complement the Parabolic SAR. By combining the Parabolic SAR with other tools, traders can enhance their understanding of market conditions, filter out false signals, and gain a more comprehensive view of potential entry and exit points. This approach allows traders to navigate various market scenarios more effectively and make more informed trading decisions.
Combining Parabolic SAR with 200 EMA: A More Refined Approach
To refine the approach of using the Parabolic SAR as a standalone strategy, experienced traders often incorporate the 200 period Exponential Moving Average (EMA) into their analysis. The 200 EMA serves as a valuable tool for identifying the long-term trend in a market. By plotting this indicator on the price chart, traders can assess whether the price is trading above or below the 200 EMA. If the price is above the 200 EMA, it indicates a long-term uptrend, while a price below the 200 EMA suggests a long-term downtrend. Once the long-term trend is identified, traders then wait for the Parabolic SAR to align with this trend before considering potential trade entries. For example, in an uptrend confirmed by the position of the price above the 200 EMA, traders would look for the Parabolic SAR dots to be below the price, signaling potential long entry points. Conversely, in a downtrend confirmed by the price below the 200 EMA, the Parabolic SAR dots above the price would indicate potential short entry points. By combining these indicators, traders can refine their strategy, increase the reliability of their signals, and make more informed trading decisions.
The combination of the Parabolic SAR with the 200 EMA provides a more refined approach to trading. While the Parabolic SAR alone can generate false signals during non-trending periods, incorporating the long-term trend analysis with the 200 EMA helps filter out potential false signals and adds a higher level of confirmation to trade entries. This combined approach allows traders to align their trades with the prevailing long-term trend, increasing the probability of success. It also helps traders avoid counter-trend trades that may occur when the Parabolic SAR flips frequently during sideways or ranging market conditions. By waiting for the Parabolic SAR to align with the long-term trend as indicated by the position of the price relative to the 200 EMA, traders can focus on taking trades that have a higher probability of being in line with the overall market direction. This refined strategy incorporating both indicators offers traders a more robust framework for making trading decisions and can contribute to improved trading outcomes.
Crafting an Exit Strategy with Parabolic SAR
In addition to its usefulness in generating entry signals, the Parabolic SAR can also play a crucial role in crafting an effective exit strategy. While some traders rely on the Parabolic SAR switching positions as an exit signal, a more proactive approach involves setting a stop loss based on the Parabolic SAR itself. By placing a stop loss order just below the Parabolic SAR dots for long positions or above the dots for short positions, traders can limit potential losses if the price reverses. This method ensures that trades are closed at a predetermined level if the market moves against the expected direction. Additionally, to capture a favorable risk-reward ratio, traders can set a profit target at 1.5 times the stop loss distance. This approach allows for a higher potential profit compared to the initial risk taken. By incorporating the Parabolic SAR into the exit strategy, traders can effectively manage risk, protect profits, and maintain a disciplined approach to their trades.
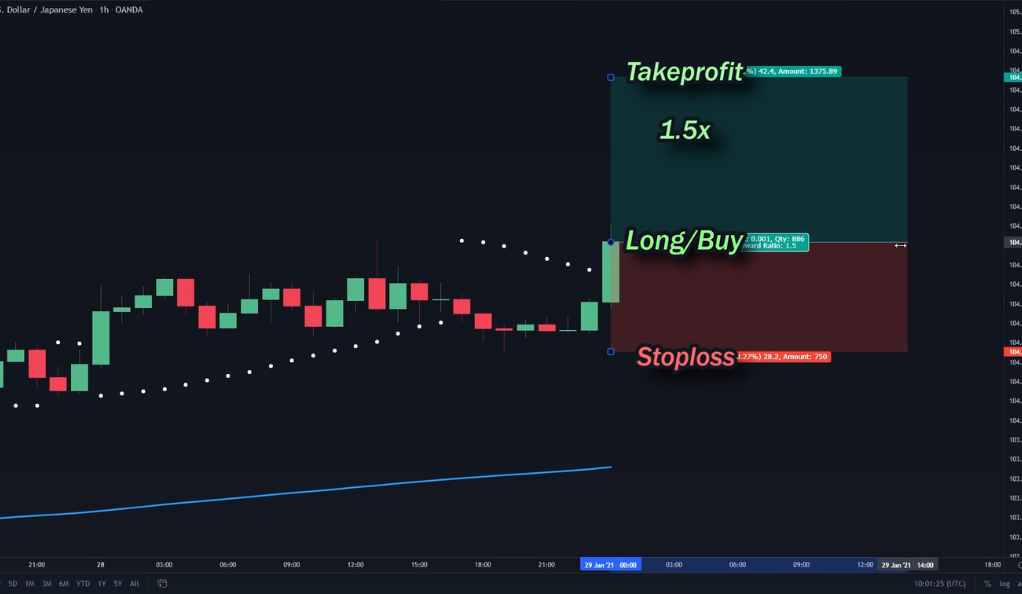
Implementing a proactive exit strategy with the Parabolic SAR can significantly enhance the overall trading performance. Rather than relying solely on the Parabolic SAR switching positions, which may result in exiting a trade too late, setting a stop loss at the Parabolic SAR level provides a more objective and systematic approach. This method ensures that potential losses are limited and allows traders to exit the trade swiftly if the market moves against their anticipated direction. Moreover, by setting a profit target at 1.5 times the stop loss distance, traders aim to capture a favorable risk-reward ratio. This means that even if not all trades result in a profit, a higher profit potential is targeted compared to the amount at risk. By combining the Parabolic SAR with a well-defined exit strategy, traders can manage risk effectively, protect capital, and strive for consistent profitability in their trading endeavors. It is essential to note that determining the appropriate stop loss and profit target levels should be based on each trader’s risk tolerance, trading style, and the specific characteristics of the market being traded.
Parabolic SAR Divergence: Spotting Unique Opportunities
Another advanced strategy involves using the Parabolic SAR to spot divergences. A divergence occurs when the price moves in the opposite direction of the indicator. This counter-intuitive movement can signal a potential trend continuation, offering a unique trade opportunity. Spotting these divergences requires careful observation and can add another layer of sophistication to your trading strategy.

Parabolic SAR and Cryptocurrency Trading
The Parabolic SAR has gained significant relevance in cryptocurrency trading, especially considering the recent trends in the crypto market. The volatile nature of cryptocurrencies presents both opportunities and risks for traders, and the Parabolic SAR has emerged as a valuable tool to navigate this environment. By analyzing price movements, the Parabolic SAR helps identify potential entry and exit points, assisting traders in making informed decisions. This indicator is particularly useful in capturing the strong trends often observed in cryptocurrencies, allowing traders to ride the momentum and maximize profits. Furthermore, regulated cryptocurrency trading platforms like Bitget offer additional support to crypto traders by providing advanced trading features and tools, including the integration of the Parabolic SAR. Such platforms enable traders to leverage the power of the Parabolic SAR within their trading strategies, enhancing their ability to capitalize on the dynamic and rapidly evolving cryptocurrency market. By utilizing the Parabolic SAR and leveraging the resources offered by platforms like Bitget, traders can better navigate the unique characteristics of cryptocurrency trading and potentially achieve success in this exciting and fast-paced market.
Conclusion
Mastering the Parabolic SAR indicator can significantly enhance your trading strategy. Whether you’re a beginner just starting out or an experienced trader looking to refine your approach, understanding and effectively using the Parabolic SAR can provide valuable insights into market trends and potential trading opportunities. Remember, the key to successful trading lies in continuous learning and adapting your strategies to the ever-changing market conditions.
Ainu Token aims to offer impartial and trustworthy information on cryptocurrency, finance, trading, and shares. However, we don't provide financial advice and recommend users to conduct their own studies and thorough checks.
Comments (No)