Introduction: The Landscape of Cryptocurrency Trading
In the dynamic and often unpredictable world of cryptocurrency trading, the strategies employed by traders are as varied and unique as the traders themselves. Among the plethora of strategies that have emerged, one has recently caught the attention of many: the AI trading strategy developed by the innovative Trades by Modicity. This article aims to delve into the intricacies of this strategy, unravel its underlying mechanics, and critically evaluate its effectiveness based on rigorous backtesting results.
The AI Trading Strategy: A Bird’s Eye View
At the heart of this intriguing approach lies the utilization of three free TradingView indicators: the Exponential Moving Average (EMA), Machine Learning by JDE Hardy, and Trend Alert by R Strot. But what exactly makes this strategy tick? Let’s dissect each component to gain a clearer understanding.
Indicator 1: Exponential Moving Average (EMA) – The Foundation
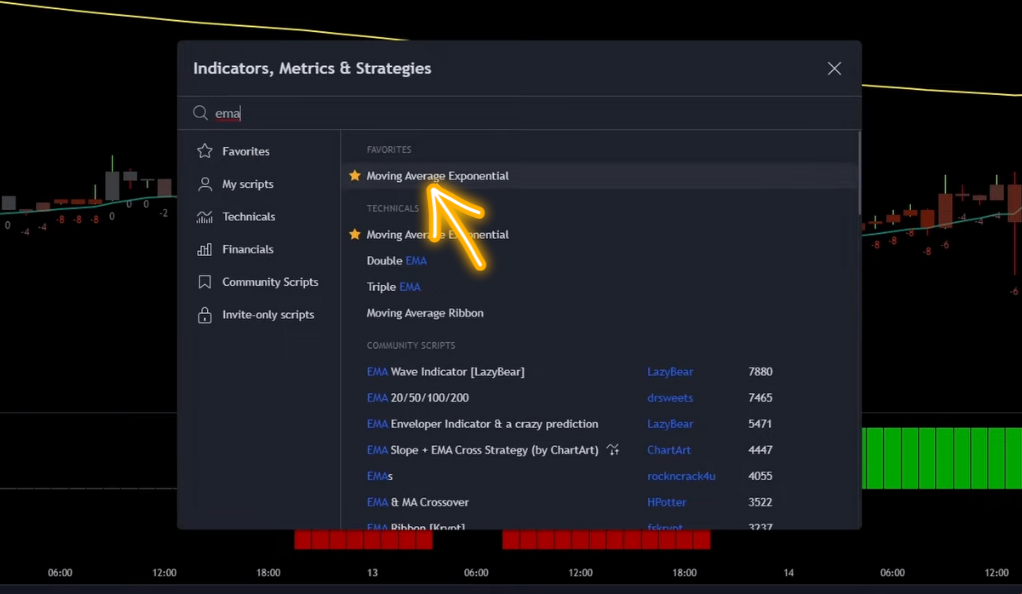
The EMA is a fundamental tool in the arsenal of many trading strategies. In the context of this particular strategy, the EMA indicator is adjusted to a length of 200, thereby enhancing its visibility on the chart and making it easier for traders to interpret. The EMA serves as a critical pivot point for trade entries, whether they are long or short, thereby forming the foundation of this strategy.
Indicator 2: Machine Learning by JDE Hardy – The Directional Compass
The second component of this strategy is the Machine Learning indicator developed by JDE Hardy. This sophisticated indicator prints buy or sell signals, providing traders with a clear direction for their trades. The signals from this indicator form a pivotal part of the entry rules for both long and short positions, acting as a directional compass guiding traders’ decisions.
Indicator 3: Trend Alert by R Strot – The Trend Identifier
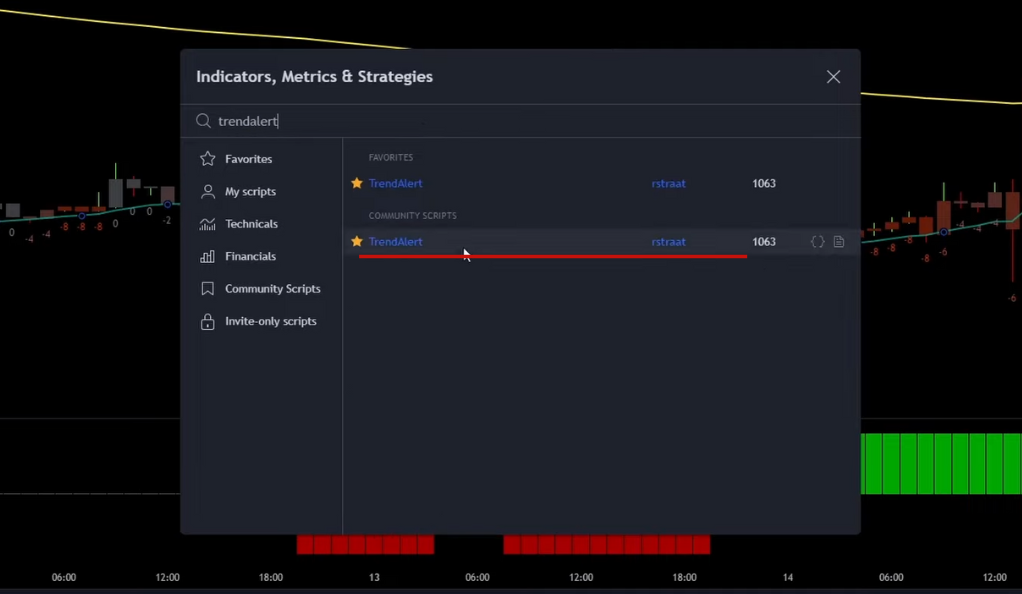
The final piece of the strategy puzzle is the Trend Alert by R Strot. This innovative indicator prints a histogram that is color-coded to indicate the trend direction. A green histogram suggests a bullish trend, indicating potential buying opportunities, while a red one indicates a bearish trend, signaling potential selling opportunities. This trend identifier plays a crucial role in confirming the trade direction suggested by the Machine Learning indicator.
The Strategy Rules: Simplicity Amid Complexity
Despite the seemingly complex indicators, the rules governing this strategy are surprisingly straightforward. For a long position, three conditions must be met: the candlestick must close above the 200 EMA line, a buy signal should be printed by the machine learning indicator, and the Trend Alert should print a green-colored histogram. For a short position, the conditions are simply the inverse.
Long Position: The Triple Confirmation
For a long position, which is essentially a bet that the asset’s price will rise, three conditions must be met. These conditions work together to provide a triple confirmation of a potential upward trend, increasing the likelihood of a successful trade.
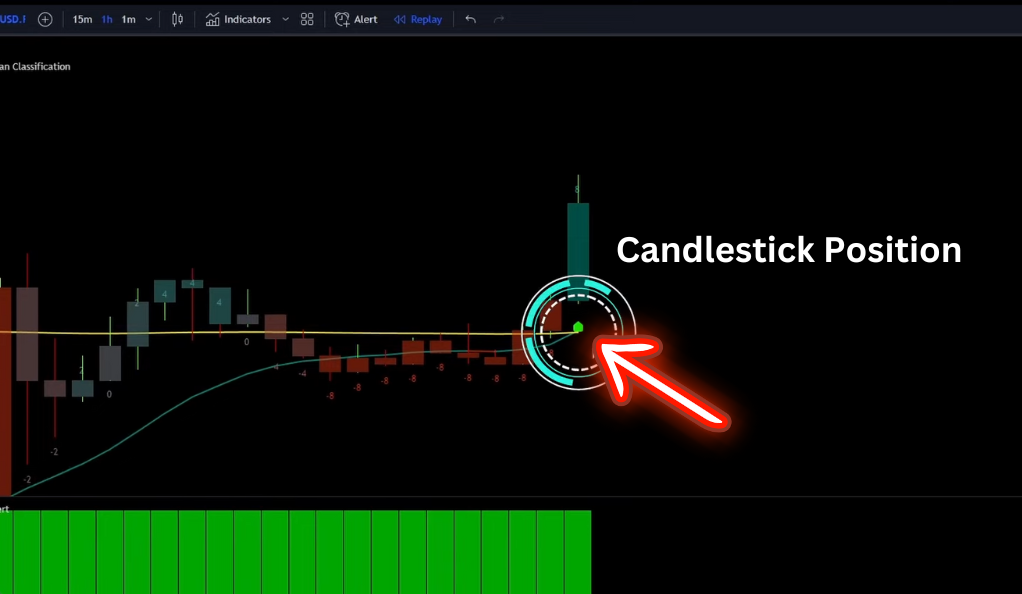
Candlestick Position: The first condition is that the candlestick, which represents a specific period of trading, must close above the 200 EMA line. This suggests that the asset’s price has been trending upwards during that period, making it a potentially good time to enter a long position.
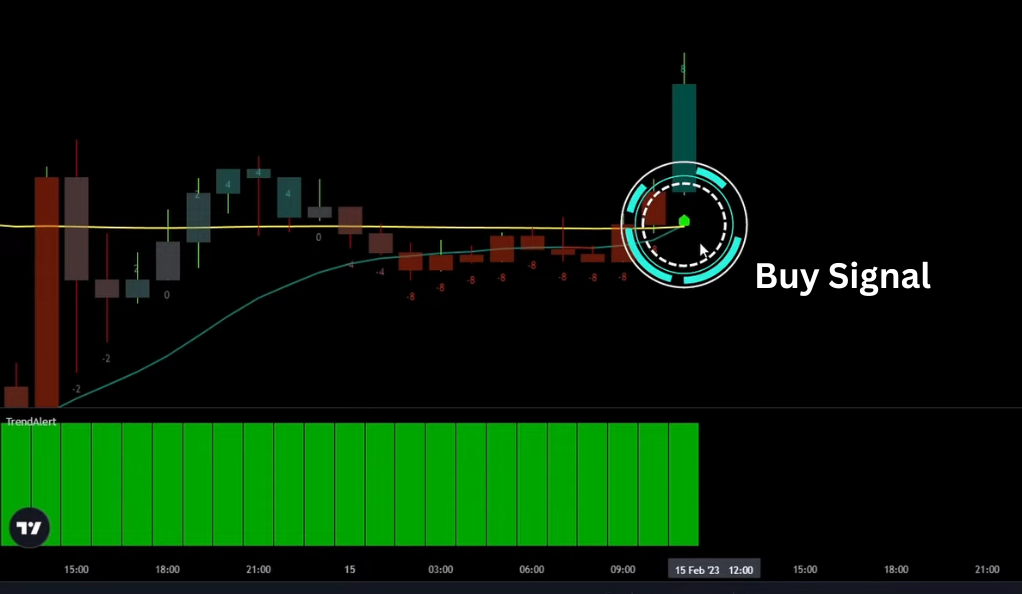
Buy Signal: The second condition is the generation of a buy signal by the machine learning indicator. This signal is based on the indicator’s analysis of past market data and its prediction of future price movements. A buy signal suggests that the asset’s price is likely to rise in the future.
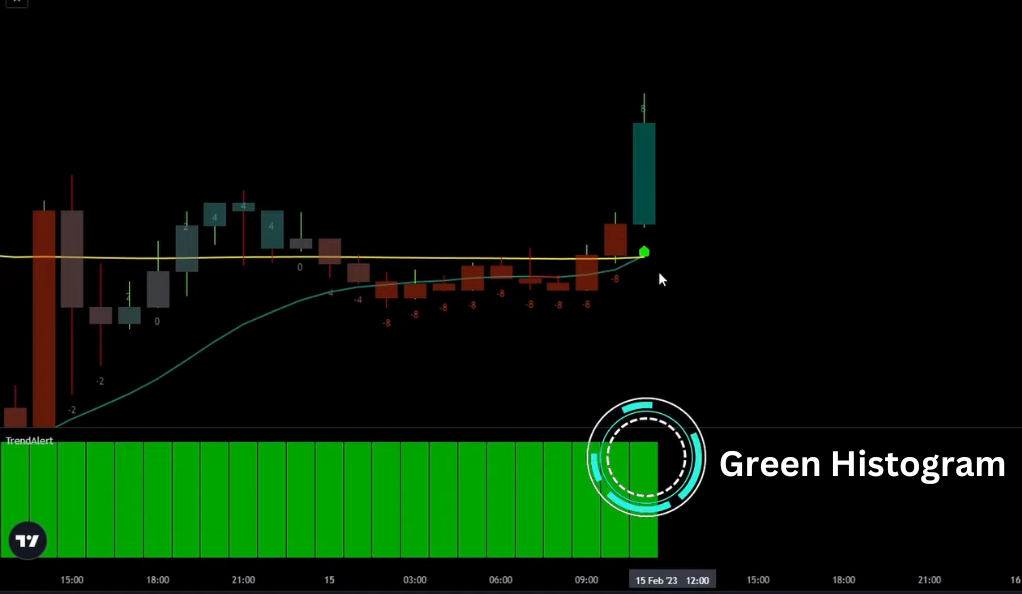
Green Histogram: The third condition is that the Trend Alert should print a green-colored histogram. This green histogram indicates a bullish trend, providing further confirmation of a potential upward price movement.
Short Position: The Mirror Image
For a short position, which is a bet that the asset’s price will fall, the conditions are simply the inverse of those for a long position. These conditions provide a triple confirmation of a potential downward trend, increasing the likelihood of a successful trade.
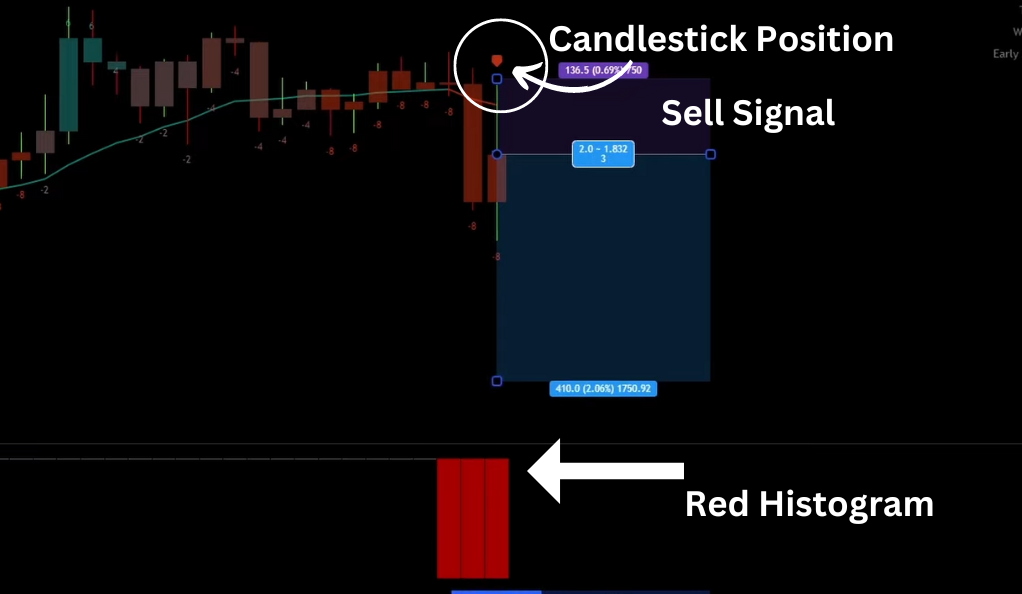
Candlestick Position: The candlestick must close below the 200 EMA line, suggesting a potential downward trend in the asset’s price.
Sell Signal: The machine learning indicator should print a sell signal, suggesting that the asset’s price is likely to fall in the future.
Red Histogram: The Trend Alert should print a red-colored histogram, indicating a bearish trend and providing further confirmation of a potential downward price movement.
Risk Management: The Lifeline of Trading
Risk management is the cornerstone of any successful trading strategy. It’s the safety net that protects traders from catastrophic losses and ensures the sustainability of their trading activities. In the context of the AI trading strategy, risk management takes center stage, with specific tools and practices designed to limit potential losses and maximize potential gains. Let’s delve deeper into these risk management practices and understand their role in the strategy.
Stop Loss: The Safety Net
The stop loss is a critical tool in risk management. It’s essentially an order to sell an asset when it reaches a particular price point, thereby limiting the trader’s loss on a trade. In the AI trading strategy, the stop loss is strategically placed at the machine learning line. This line, generated by the machine learning indicator, represents a predicted price level based on past market data.
However, the placement of the stop loss is not rigid. It’s adjusted slightly depending on the entry candle, the candlestick at which the trade is entered. This flexibility allows the stop loss to better accommodate the volatility and unpredictability of the market, providing a more effective safety net for the trader.
Target Setting: The Profit Goal
On the other side of the coin is the target, the price level at which the trader aims to sell the asset for a profit. In the AI trading strategy, the target is set with a risk-reward ratio of 1:3. This means that for every unit of risk taken (as defined by the distance between the entry price and the stop loss), the trader aims to gain three units of reward (as defined by the distance between the entry price and the target).
This risk-reward ratio of 1:3 is a common practice among traders aiming for sustainable profitability over the long term. It ensures that even if only a third of the trades are successful, the trader can still break even. This is because the gains from the successful trades, multiplied by the reward-to-risk ratio, would offset the losses from the unsuccessful trades.
Backtesting: The Litmus Test of Trading Strategies
Backtesting is a critical step in the development and refinement of any trading strategy. It serves as a reality check, providing a historical simulation of how a strategy would have performed under past market conditions. By doing so, backtesting allows traders to evaluate the effectiveness of a strategy before risking real money. In the context of the AI trading strategy, backtesting played a pivotal role in assessing its potential profitability and reliability.

Backtesting: The What and the Why
Backtesting involves applying a trading strategy to historical market data to see how it would have performed. It’s a way of ‘testing’ the strategy in a safe environment before deploying it in live markets. Backtesting can reveal potential flaws in a strategy, provide insights into its potential profitability, and help traders fine-tune it for better performance.
Backtesting the AI Trading Strategy: The Methodology
In the case of the AI trading strategy, I conducted backtesting using the Traders Edge app. This app is a popular tool among traders for backtesting strategies, thanks to its user-friendly interface and comprehensive features.
The backtesting started with an initial balance of $1,000, simulating a relatively modest trading account. I also employed a leverage of 2x, which means that for every dollar in the trading account, two dollars could be traded. Leverage can amplify profits, but it can also magnify losses, making it a double-edged sword in trading.
The Results: A Reality Check
After 100 trades, the results of the backtesting were in. The win rate, which is the percentage of trades that resulted in a profit, was found to be a mere 27%. This means that out of every 100 trades, only 27 were profitable. This result was deemed disappointing, suggesting that the AI trading strategy may not be as effective as initially thought.
Conclusion: Knowledge is Power in the World of Cryptocurrency Trading
In conclusion, while the AI trading strategy by Trades by Modicity appears promising on the surface, the backtesting results suggest that it may not live up to the hype. As with any trading strategy, it’s crucial to conduct your own research and backtesting before diving in. After all, in the volatile world of cryptocurrency trading, knowledge truly is power.
Ainu Token aims to offer impartial and trustworthy information on cryptocurrency, finance, trading, and shares. However, we don't provide financial advice and recommend users to conduct their own studies and thorough checks.
Comments (No)