Trading in the financial markets is a complex endeavor, requiring a blend of analytical skills, intuition, and a deep understanding of market dynamics. One of the most effective tools traders use to navigate these waters is the Fibonacci Retracement. This tool, based on a mathematical sequence discovered by Leonardo Fibonacci, has found its way into the heart of technical analysis in trading. It allows traders to identify potential levels of support and resistance, which can be crucial in making informed trading decisions. In this article, we’ll delve into the intricacies of setting up and using Fibonacci Retracement lines, specifically on the Bybit BTC USD Chart and Phemex Inverse Perpetuals. We’ll cover everything from the basics of Fibonacci Retracement to advanced techniques, providing you with a comprehensive understanding of this powerful trading tool.
What is Fibonacci Retracement?
Fibonacci Retracement is a popular technical analysis tool used by traders worldwide. It’s based on the Fibonacci sequence, a series of numbers where each number is the sum of the two preceding ones. Starting from 0 and 1, the sequence unfolds like this: 0, 1, 1, 2, 3, 5, 8, 13, 21, and so forth. This sequence has a unique property where the ratio of any number to the next number is approximately 0.618, and the inverse is 1.618. These ratios, known as the golden ratio, are found throughout nature, architecture, art, and now, in the world of trading.
In the context of trading, these ratios are used to identify potential price retracement levels. These are levels where the price could potentially reverse or continue its trend. The concept behind Fibonacci Retracement is that markets will often retrace a certain percentage of a move before continuing in the original direction. These retracement levels, derived from the Fibonacci sequence, provide traders with potential points of interest where price action must be assessed for possible trading opportunities. Understanding these levels can provide traders with valuable insights into market trends and potential reversal points, making Fibonacci Retracement an indispensable tool in a trader’s arsenal.
Setting Up Your First Fibonacci Retracement
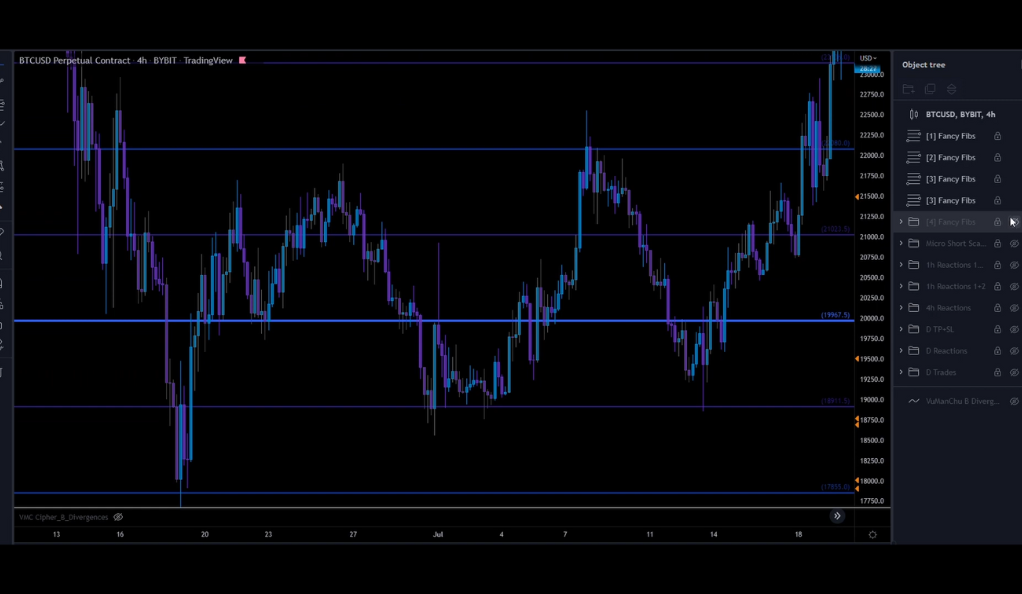
Setting up your first Fibonacci Retracement is akin to taking your first step into a larger world of trading. The process begins with drawing a random Fibonacci Retracement on your chart. This might seem arbitrary at first, but it’s a crucial step in understanding how the tool works. The lines you draw represent potential levels of price retracement based on the Fibonacci sequence. In the settings, extend the lines to the left and right, covering the entire chart. This allows you to see the full scope of the retracement levels, providing a comprehensive view of potential price movements.
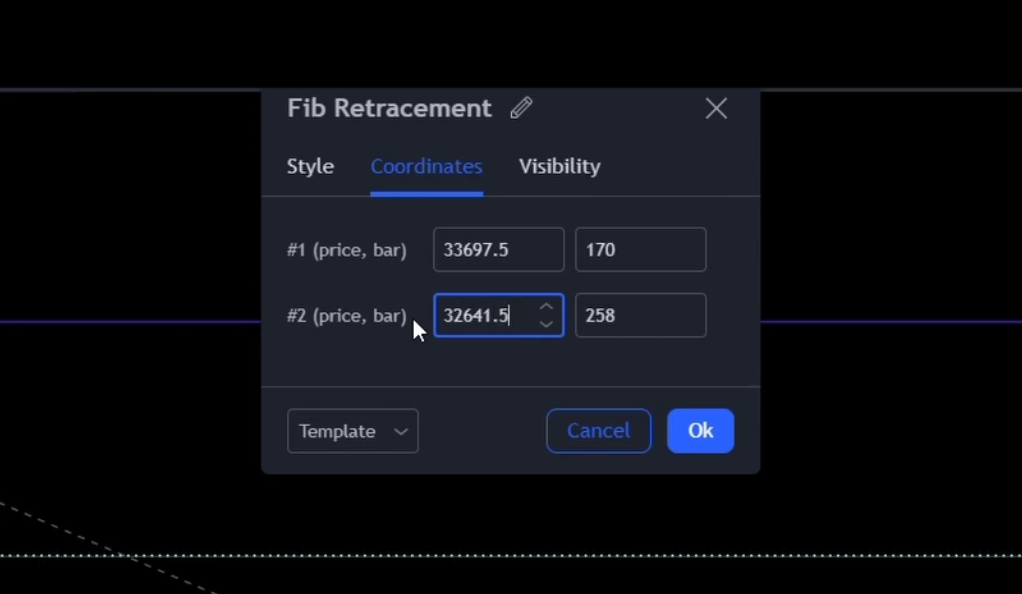
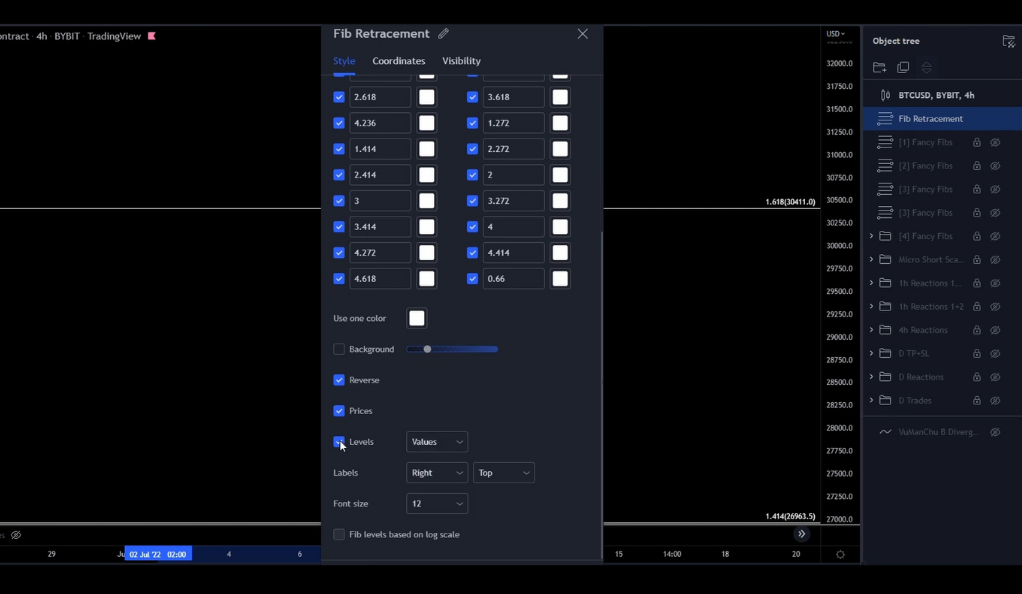
Next, you’ll set your price points. Set your first price at 3069 USD and your second price at 19967.5 USD. These prices represent the range within which the retracement levels will be calculated. Once you’ve set your prices, it’s time to adjust the levels. Starting from 0, add 0.25 to each level until you reach 5.75. This sets the specific retracement levels you’ll be observing. Finally, customize the appearance of your retracement lines. Choose your favorite color for the lines, uncheck the background, and check the reverse and prices options. This completes the setup of your first Fibonacci Retracement, marking your first step into the fascinating world of Fibonacci-based trading.
Diving Deeper: The Second Fibonacci Retracement
Now that you’ve got the hang of setting up your first Fibonacci Retracement, it’s time to dive deeper into the world of Fibonacci-based trading. The second Fibonacci Retracement builds upon the foundation laid by the first one, introducing more granularity and complexity to your analysis. The process of setting up the second retracement is similar to the first one, but with a few key differences that allow for a more nuanced understanding of potential price movements.
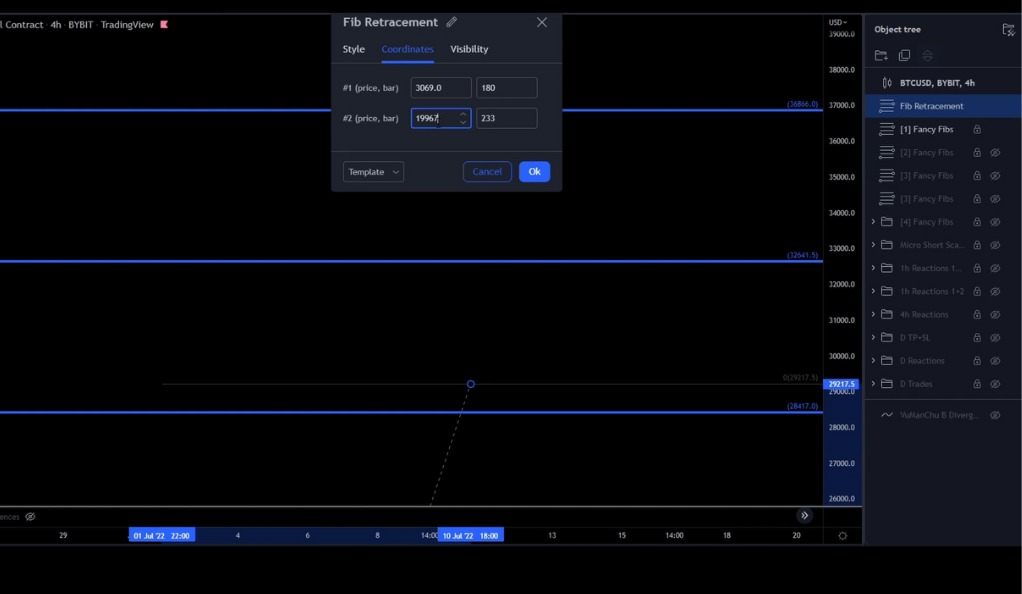
The price inputs for the second retracement remain the same as the first one, with the first price at 3069 USD and the second price at 19967.5 USD. However, the level inputs for the second retracement are different. Instead of starting from 0, the level inputs for the second retracement start at 0.125, with subsequent inputs at 0.375, 0.625, and 0.875. These inputs represent additional retracement levels that provide more granularity in your analysis. By adding these additional levels, you can identify more nuanced levels of support and resistance, potentially providing more precise trading signals.
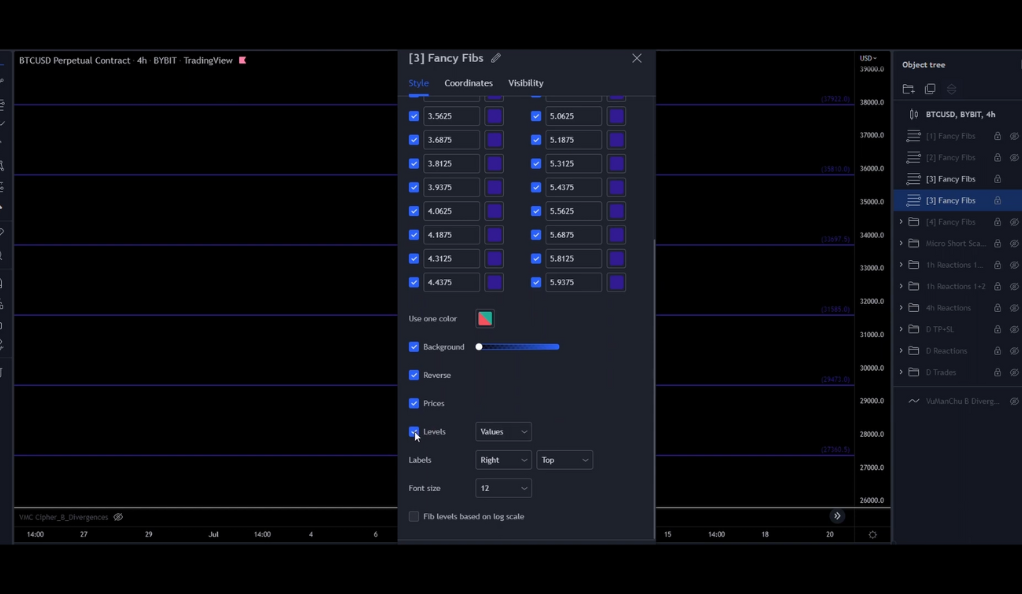
Once you’ve set your level inputs, copy these four inputs and increase them by 1, with the last label being 5.875. This extends the range of your retracement levels, providing a more comprehensive view of potential price movements. As with the first retracement, remember to extend the lines left and right, change the color, uncheck the background, and check the reverse and prices options. This completes the setup of your second Fibonacci Retracement, taking your understanding of Fibonacci-based trading to a new level.
The Third Fibonacci Retracement: A Double Whammy
The third Fibonacci Retracement introduces a new layer of complexity to your trading strategy: drawing two retracements. This step is a double whammy, providing even more granularity in your analysis by overlaying two sets of retracement levels. The idea here is to identify more nuanced levels of support and resistance, potentially providing more precise trading signals. It’s a more advanced technique, but one that can significantly enhance your trading strategy once mastered.
This step might seem a bit complex, but remember, practice makes perfect! As you draw these two retracements, you’ll begin to see how they interact with each other, revealing potential areas of interest in the market. This process of overlaying multiple retracements can provide a more comprehensive view of the market, helping you identify potential trading opportunities that might otherwise remain hidden. It’s a testament to the versatility and power of Fibonacci Retracement as a trading tool, demonstrating how it can be adapted and expanded to meet the needs of advanced trading strategies.
The Fourth Fibonacci Retracement: Manual Drawing
The fourth Fibonacci Retracement introduces a new challenge: manual drawing. This step is necessary due to lagging issues with Tradingview, a popular platform for technical analysis. While automated tools like Fibonacci Retracement can make the process of technical analysis more efficient, there are times when manual drawing is necessary to achieve the desired level of precision and control. This is one of those times. Drawing the fourth Fibonacci Retracement manually allows you to fine-tune your analysis, providing a more nuanced view of potential price movements.
To draw the fourth Fibonacci Retracement, start by drawing a Fibonacci Retracement between two of the levels, leaving only the 0.5 retracement. This is the level where you’ll draw your horizontal line. This line represents a key level of support or resistance, providing a clear signal for potential trading decisions. Once you’ve drawn your line, turn off all other lines and write down the prices. This helps keep your chart clean and focused on the key levels. To avoid accidental changes, put all the horizontals into a folder and lock them. This ensures that your carefully drawn levels remain intact, providing reliable signals for your trading strategy. This process may seem more complex than setting up automated retracements, but it’s a crucial step in mastering the art of Fibonacci-based trading.
The Art of Fibonacci Retracement
Setting up Fibonacci Retracement lines might seem like a purely technical task, but it’s also an art. It requires precision, patience, and a keen understanding of market dynamics. Each line you draw, each level you set, is a brushstroke on the canvas of the market, revealing patterns and trends that might otherwise remain hidden. The beauty of Fibonacci Retracement lies in its simplicity and effectiveness. With just a few lines, you can gain a deep understanding of market trends and potential reversal points. It’s a tool that combines mathematics, art, and trading in a unique and powerful way.
Mastering the art of Fibonacci Retracement is not just about understanding how to set up the lines and levels. It’s also about interpreting what these lines and levels mean in the context of market dynamics. It’s about understanding the ebb and flow of the market, the push and pull of supply and demand, and how these forces interact at key Fibonacci levels. It’s about using this understanding to make informed trading decisions, to navigate the financial markets with confidence and precision. So, while Fibonacci Retracement may be a tool rooted in numbers and ratios, its true mastery lies in the art of interpretation and application.
Conclusion
Fibonacci Retracement is more than just a trading tool; it’s a window into the heart of the market, revealing patterns and trends that might otherwise remain hidden. By understanding and effectively using Fibonacci Retracement lines, you can navigate the financial markets with greater confidence and precision. So, why not give it a try? After all, as the saying goes, “In trading, the journey is just as important as the destination.” Happy trading!
Ainu Token aims to offer impartial and trustworthy information on cryptocurrency, finance, trading, and shares. However, we don't provide financial advice and recommend users to conduct their own studies and thorough checks.
Comments (No)