Trading in the financial markets can often feel like trying to navigate a labyrinth. However, with the right strategies and understanding of market structures, you can turn this complex maze into a straightforward path to potential profits. One such strategy is trend trading, a technique that relies on analyzing market trends and identifying key areas of interest. This article will delve into the intricacies of trend trading, providing you with a comprehensive guide to mastering this art.
The Basics of an Uptrend
An uptrend, often referred to as a bullish trend, is a fundamental concept in technical analysis that represents a sustained increase in the price of a financial instrument. This upward movement is characterized by a series of higher highs and higher lows, forming a pattern that ascends over time. In this scenario, each new peak the price reaches is higher than the previous one, indicating a bullish market sentiment. A bullish break of structure (BOS) occurs when a new high is broken, signaling a continuation of the uptrend. This pattern is a clear indication of a strong buying pressure where the demand for the asset consistently outweighs the supply, pushing the prices higher. Traders often use uptrends as an opportunity to enter long positions, aiming to profit from the continued price increase.
The Dynamics of a Downtrend
On the flip side, a downtrend, or a bearish trend, represents a sustained decrease in the price of a financial instrument. It is characterized by a series of lower highs and lower lows, forming a pattern that descends over time. In a downtrend, each new low the price hits is lower than the previous one, suggesting a bearish market sentiment. This pattern is a clear indication of a strong selling pressure where the supply of the asset consistently outweighs the demand, pushing the prices lower. Traders often use downtrends as an opportunity to enter short positions, aiming to profit from the continued price decrease.
Supply and Demand Zones
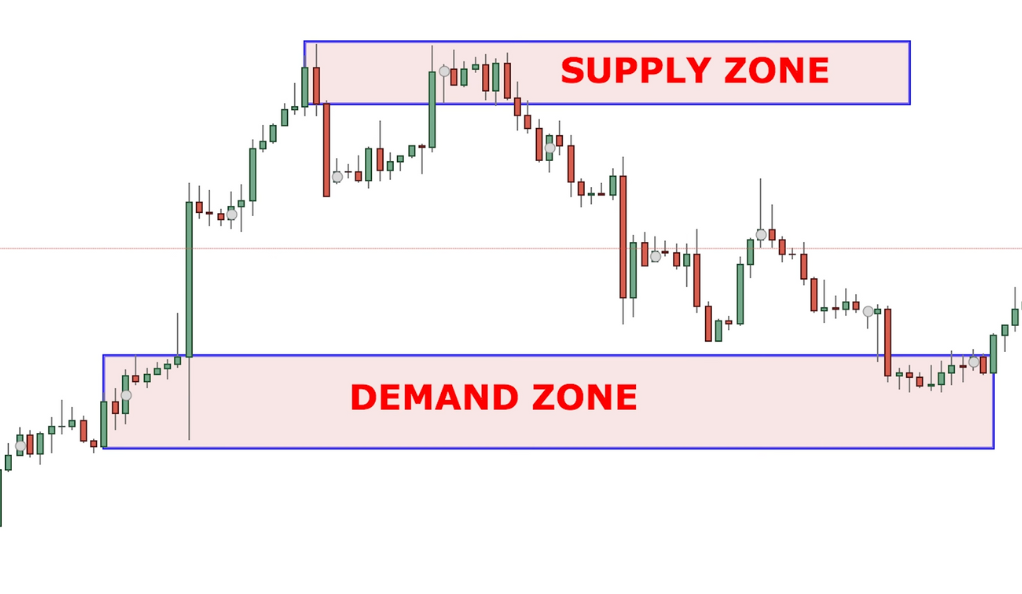
Supply and demand zones are fundamental concepts in the field of economics and trading that refer to the regions of a chart where the price has made significant moves and pauses. These zones are pivotal in understanding the balance between buyers and sellers and can provide valuable insights into potential future price movements.
A supply zone is an area on the chart where selling pressure overcomes buying pressure. This is typically a region where the price has previously rallied to but could not surpass, leading to a decline. The supply zone represents a price level at which the market is considered overpriced, and hence, sellers start to dominate. When the price re-enters this zone, there’s a high probability that the abundance of supply will again push the price down. Traders often use supply zones to open short positions or close long positions, anticipating a price decrease.
Order Blocks
Order blocks are a critical concept in the realm of trading, particularly in the context of forex markets. They represent a specific area on a price chart where significant buying or selling activity has occurred, typically driven by large market participants such as institutional investors or hedge funds. These areas are often marked by a range of price with substantial trading volume, indicating a high level of interest from these ‘big players’.
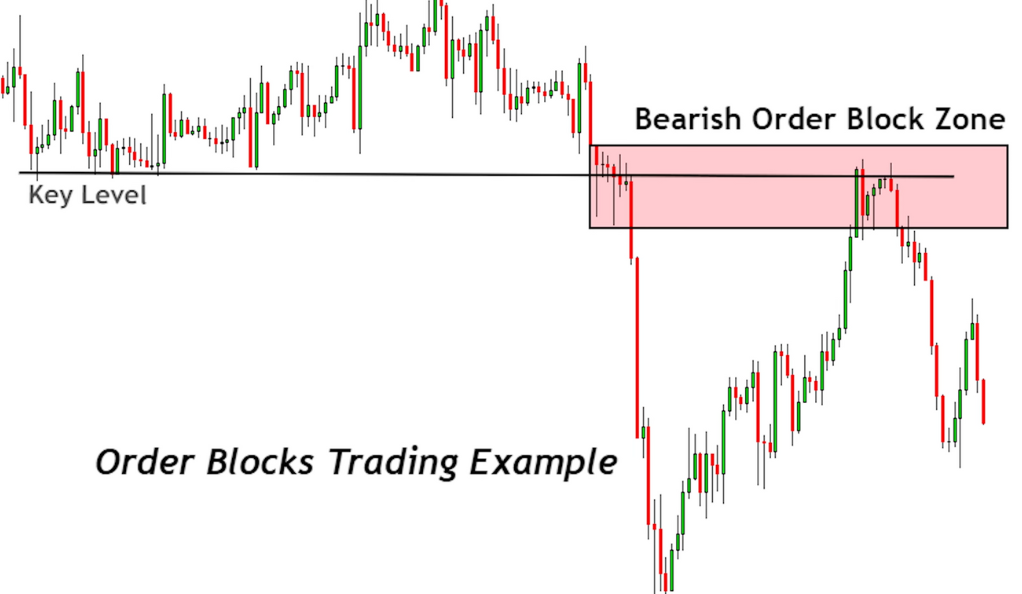
An order block is usually identified as a consolidation or a range-bound phase before a significant price move. This is because large market participants often accumulate or distribute their positions over time, causing the price to consolidate. The subsequent breakout from this consolidation phase often leads to substantial price movements, making order blocks a key area of interest for traders.
Liquidity Grabs
Liquidity grabs, also known as stop runs or stop hunts, are a common phenomenon in financial markets. They occur when the price of a financial instrument briefly extends beyond a key level of support or resistance, triggering stop orders before quickly reversing direction. This sudden price extension and reversal is the ‘grab’ for liquidity, as stop orders provide the necessary liquidity for large market participants to fill their orders.
In essence, a liquidity grab is a strategic move by large market participants, such as institutional traders or hedge funds. These players have significant trading volumes that require substantial liquidity to execute their trades without causing drastic price movements. By pushing the price to levels where a concentration of stop orders is likely to be placed, they can ‘grab’ the liquidity they need.
Applying Liquidity Grabs in Trading
In the context of a trading strategy, liquidity grabs can provide valuable insights into potential market reversals. For instance, if the price breaks above a key resistance level, triggering stop-loss orders from short sellers and stop-entry orders from breakout buyers, but then quickly reverses and falls back below the resistance level, it could indicate a potential bearish reversal. This is because the ‘grab’ for liquidity has been satisfied, and the selling pressure may now overwhelm the buying pressure.
Similarly, if the price breaks below a key support level, triggering stop-loss orders from buyers and stop-entry orders from breakout sellers, but then quickly reverses and rises back above the support level, it could indicate a potential bullish reversal.
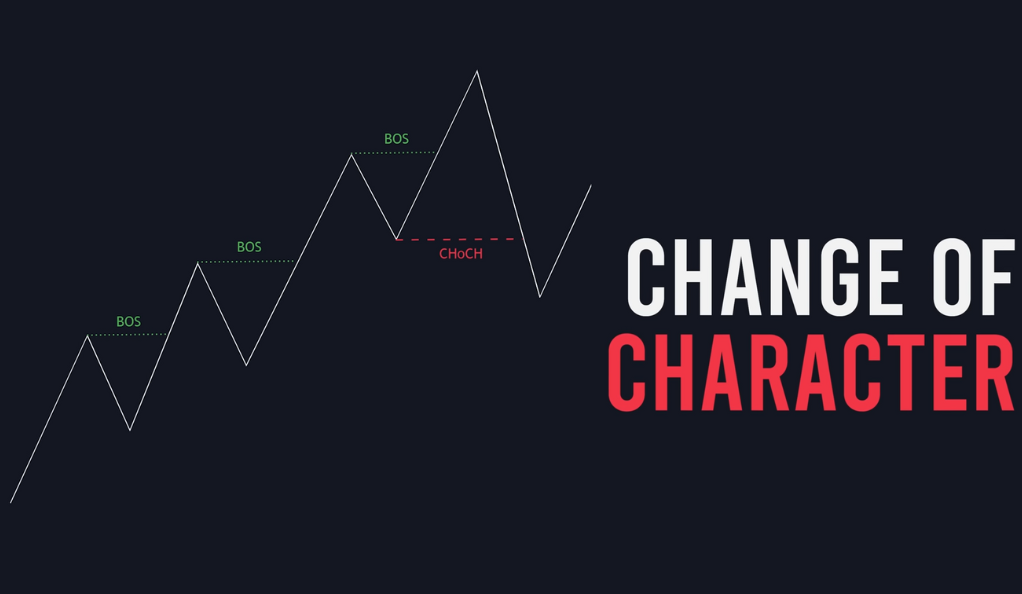
Change of Character (CHoCH)
A Change of Character (CHoCH) is a crucial concept in technical analysis, representing a significant shift in the price behavior of a financial instrument. This shift is often indicative of a potential reversal in the prevailing market trend, making it a key point of interest for traders and investors alike.
In the context of an uptrend, a CHoCH occurs when the price breaks the prior higher low. Conversely, in a downtrend, a CHoCH is observed when the price breaks the prior lower high. This change in price structure signifies a shift in the balance of power between buyers and sellers, potentially heralding a new trend direction.
For instance, consider a scenario where a stock has been in a sustained uptrend, consistently making higher highs and higher lows. If the price suddenly drops and breaks below the previous higher low, this could be interpreted as a CHoCH. It suggests that the selling pressure has overcome the buying pressure that was previously driving the uptrend. This could be the first sign that the uptrend is weakening and a downtrend may be on the horizon.
However, a CHoCH does not guarantee a trend reversal. It is merely an early signal that the prevailing trend may be losing strength. Traders often look for further confirmation before making a trading decision. This confirmation could come from other technical indicators, price patterns, or even fundamental news events.
A CHoCH is often accompanied by an increase in trading volume and volatility. An uptick in volume during a CHoCH can indicate strong participation from traders and investors, reinforcing the likelihood of a trend reversal. Similarly, an increase in volatility can suggest heightened uncertainty in the market, often a precursor to a change in trend.
Identifying a CHoCH requires a keen eye for price action and a solid understanding of market structure. Traders who can accurately spot these shifts in character can gain an edge in the market, allowing them to anticipate potential trend reversals and adjust their trading strategies accordingly. However, like all trading concepts, a CHoCH should be used in conjunction with other technical analysis tools and techniques to increase its effectiveness.
Fair Value Gap
Fair value gaps are a unique concept in technical analysis, often observed in fast-moving markets. They occur when the price of a financial instrument moves so rapidly, either upwards or downwards, that it creates an imbalance in the market. This rapid price movement leaves a ‘gap’ on the price chart, representing an area where the price has not traded. This gap is referred to as a ‘fair value gap’ because it signifies a price level where the market has not had the opportunity to trade and establish a fair value.
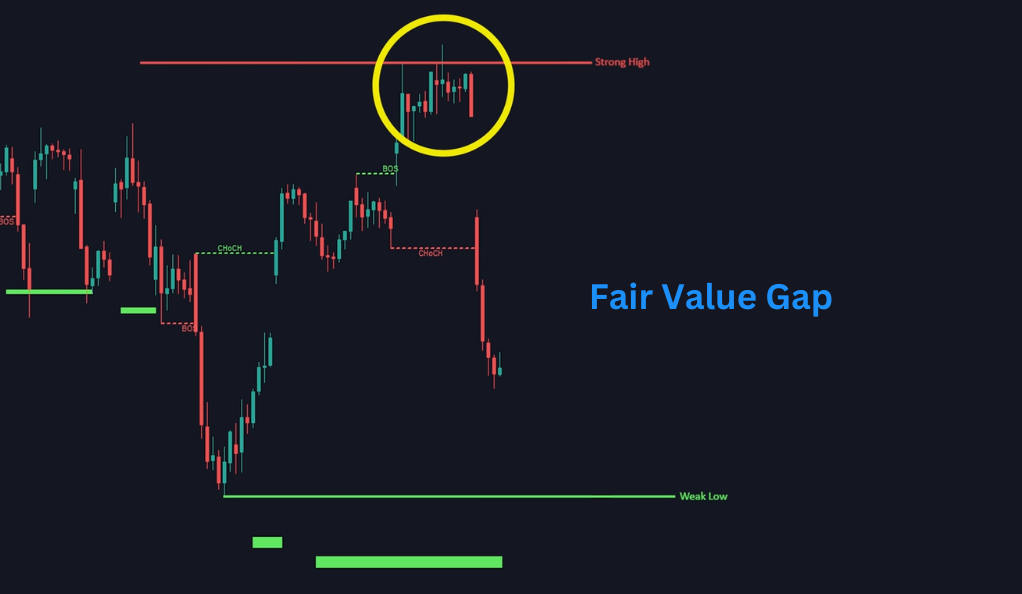
These gaps are typically caused by a sudden surge in buying or selling pressure, often triggered by significant news events, earnings announcements, or changes in market sentiment. The resulting price gap represents an area of imbalance between supply and demand, where either buyers or sellers have overwhelmed the other side.
The Role of Indicators
Indicators play a crucial role in enhancing the trend trading strategy. They provide objective measures of market conditions and help identify potential trading opportunities. Indicators can help identify break of structures, changes of character, key areas for liquidity grabs, and order blocks, making the process more efficient and effective. They can provide visual cues and generate trading signals, helping traders to make informed decisions. However, it’s important to remember that no indicator is foolproof and they should be used in conjunction with other aspects of technical analysis.
Conclusion
In conclusion, understanding and applying concepts like the structure of market trends, supply and demand zones, order blocks, fair value gaps, and liquidity grabs can significantly enhance trading strategies. These concepts provide insights into the balance of power between buyers and sellers and can help predict potential trend reversals. However, it’s crucial to remember that these tools should not be used in isolation. They are most effective when used in conjunction with other technical analysis tools, indicators, and a comprehensive understanding of market sentiment and structure. Furthermore, while these concepts can provide valuable market insights, they require a keen eye for price action and a deep understanding of how markets function.
Ainu Token aims to offer impartial and trustworthy information on cryptocurrency, finance, trading, and shares. However, we don't provide financial advice and recommend users to conduct their own studies and thorough checks.
Comments (No)