In the world of trading, strategies play a vital role in ensuring success. They serve as a roadmap, guiding traders through the often unpredictable nature of the financial markets. One strategy that has been gaining popularity is the Halftrend and Relative Strength Index (RSI) trading strategy. This strategy combines two widely used and freely available Tradingview indicators to enhance trading decisions and has shown an impressive win rate of 86%.
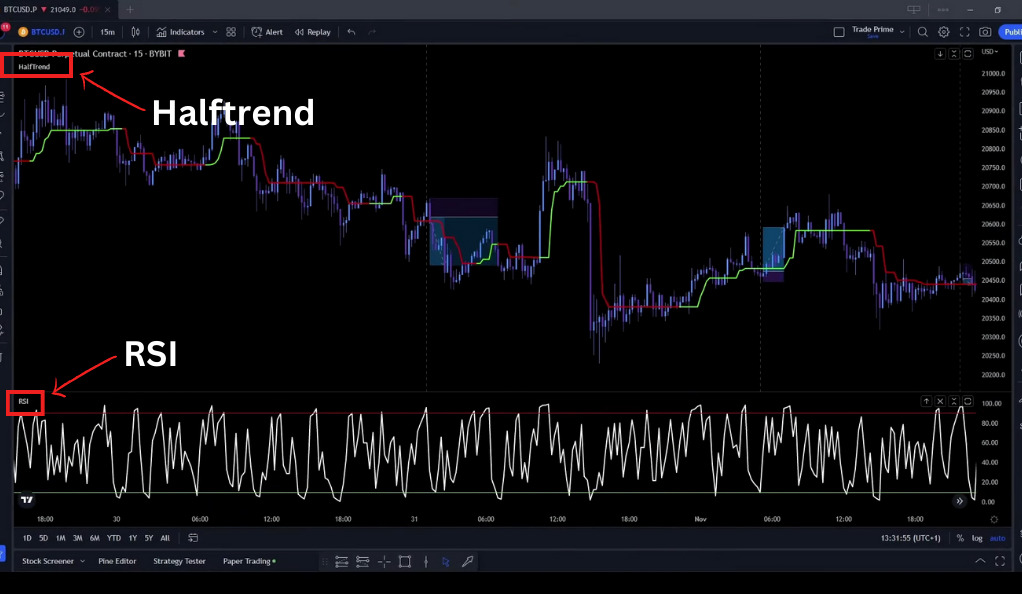
The first indicator in this strategy is the Halftrend indicator. It is designed to identify the prevailing trend in the market. The Halftrend indicator uses a moving average and a price deviation to generate signals. When the price is above the Halftrend line, it indicates an uptrend, and when the price is below the Halftrend line, it suggests a downtrend. By following the signals generated by the Halftrend indicator, traders can align themselves with the dominant market trend.
The second indicator used in this strategy is the Relative Strength Index (RSI). The RSI is a momentum oscillator that measures the speed and change of price movements. It oscillates between 0 and 100 and is commonly used to identify overbought and oversold conditions in the market. Traders often look for divergences between the RSI and price to anticipate potential trend reversals. By combining the signals from the RSI with the trend identification provided by the Halftrend indicator, traders can make more informed trading decisions.
Understanding the Basics: Halftrend and RSI
Understanding the basics of the Halftrend and RSI indicators is essential for effectively using them in a trading strategy. The Halftrend indicator is a popular trend-following tool that helps traders identify the prevailing direction of the market. It works by changing colors, typically from red to blue or vice versa, to indicate a shift in the trend. When the indicator turns blue, it suggests an uptrend, and when it turns red, it suggests a downtrend. This visual representation of the trend can assist traders in making decisions aligned with the market direction.
The Relative Strength Index (RSI) is a widely used momentum oscillator that measures the strength and speed of price movements. It oscillates between 0 and 100, with readings above 70 considered overbought and below 30 considered oversold. When combined with the Halftrend indicator, the RSI can confirm trade entries and exits. For example, if the Halftrend indicates an uptrend and the RSI is below 30, it may suggest a buying opportunity. Conversely, if the Halftrend indicates a downtrend and the RSI is above 70, it may suggest a selling opportunity. However, no strategy guarantees consistent profits, and traders should analyze, manage risks, and adapt to changing market conditions while considering their individual preferences. Backtesting and parameter adjustments are recommended.
Long Entry: The Green Signal
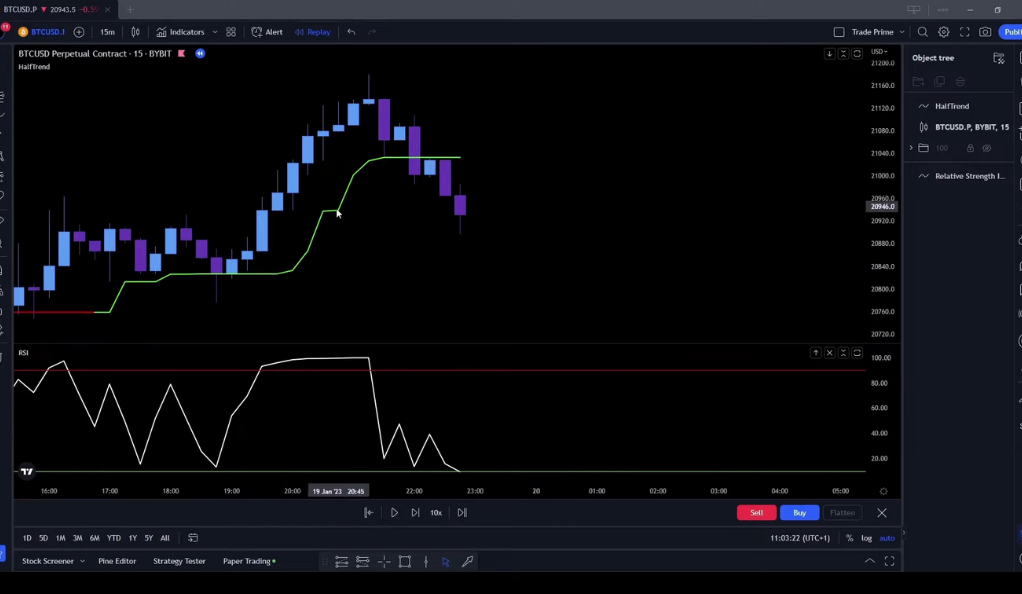
A long entry in the Halftrend and RSI strategy requires the fulfillment of two conditions. Firstly, the Halftrend line should be green, indicating an upward trend in the asset’s price. This signifies a positive market sentiment and potential price appreciation. Secondly, the RSI line should be below the green line, indicating that the asset is undervalued or oversold. This combination of a green Halftrend line and an RSI line below the green line suggests that the asset may be due for a price increase, making it an opportune time to enter a long position. Traders can use this signal as a guide to identify potential buying opportunities and make informed trading decisions.
It’s important to note that while these conditions provide a framework for long entries, traders should also consider other factors, such as overall market conditions, fundamental analysis, and risk management, to make well-rounded trading decisions. Additionally, backtesting the strategy and adjusting parameters based on individual preferences and market dynamics can further enhance its effectiveness.
Short Entry: The Red Alert
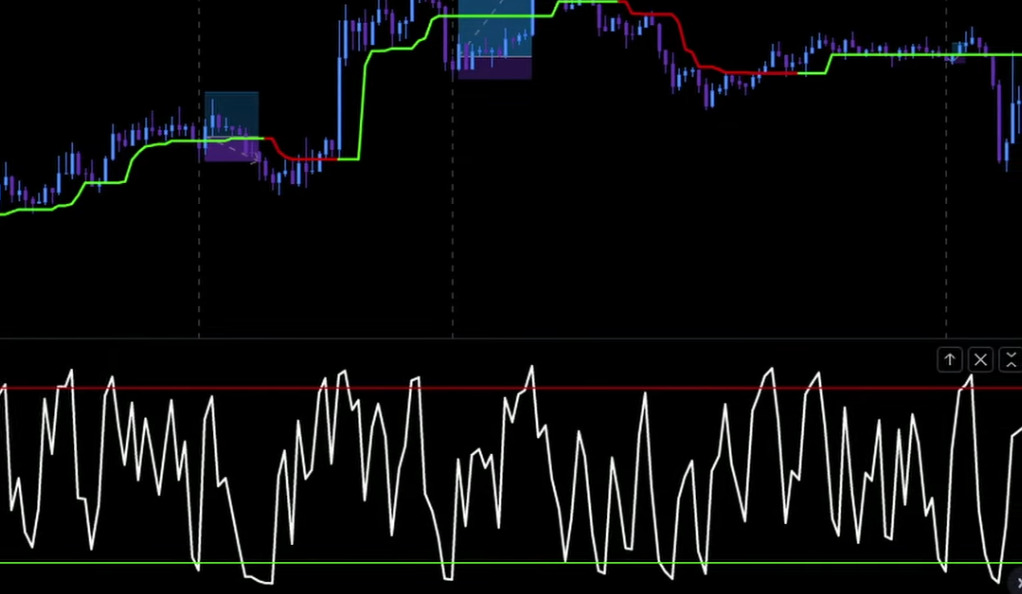
A short entry in the Halftrend and RSI strategy requires the satisfaction of two conditions. Firstly, the Halftrend line should be red, indicating a downward trend in the asset’s price. This indicates a negative market sentiment and potential price depreciation. Secondly, the RSI line should be above the red line, indicating that the asset is overvalued or overbought. This combination of a red Halftrend line and an RSI line above the red line suggests that the asset may be due for a price decrease, making it an opportune time to enter a short position. Traders can utilize this signal as a guide to identify potential selling opportunities and make informed trading decisions.
It’s important to remember that while these conditions provide a basis for short entries, traders should also consider other factors, such as overall market conditions, fundamental analysis, and risk management, to make well-rounded trading decisions. Additionally, backtesting the strategy and adjusting parameters based on individual preferences and market dynamics can further enhance its effectiveness. By combining these elements, traders can aim to increase their chances of success in short-term trading endeavors.
Risk Management: Stop-Loss and Take-Profit Levels
Risk management is a vital component of the Halftrend and RSI strategy, as it helps protect traders from excessive losses and preserve capital. Stop-loss and take-profit levels play a key role in managing risk effectively. When entering a trade, traders should define their maximum acceptable loss and set a stop-loss level accordingly. This level represents the price at which the trade will be automatically closed to limit potential losses. By setting a stop-loss level, traders can control their risk exposure and protect themselves from significant downside moves in the market.
Traders should also set a take-profit level to secure profits. This level represents the price at which the trade will be automatically closed. Setting a take-profit level helps lock in gains and avoid potential reversals. It is essential to consider risk tolerance, market conditions, and adjust these levels as needed. By incorporating risk management techniques, traders can enhance their profitability and protect their capital in the Halftrend and RSI strategy.
Customizing the Indicators: Optimization Tips
Customizing the Halftrend and RSI indicators is a valuable optimization technique that traders can employ to align the strategy with their unique trading styles and market conditions. By adjusting the parameters of these indicators, such as the period lengths or thresholds, traders can fine-tune the indicators’ sensitivity and responsiveness to price movements. This customization allows for a more personalized and tailored approach, enhancing the potential for success in trading. By optimizing the indicators to their specific preferences, traders can gain a competitive edge and adapt their strategy to various market environments.
The flexibility to customize the Halftrend and RSI indicators is particularly beneficial as it enables traders to adapt to changing market conditions. Market dynamics can shift over time, ranging from volatile and trending markets to range-bound or consolidating markets. By customizing the indicators, traders can optimize their strategy to perform well in different market scenarios. This adaptability ensures that the strategy remains effective and relevant, regardless of the prevailing market environment. By continuously monitoring and adjusting the indicator parameters as needed, traders can stay responsive to market changes and increase their chances of success.
Backtesting: The Trader Edge Tool
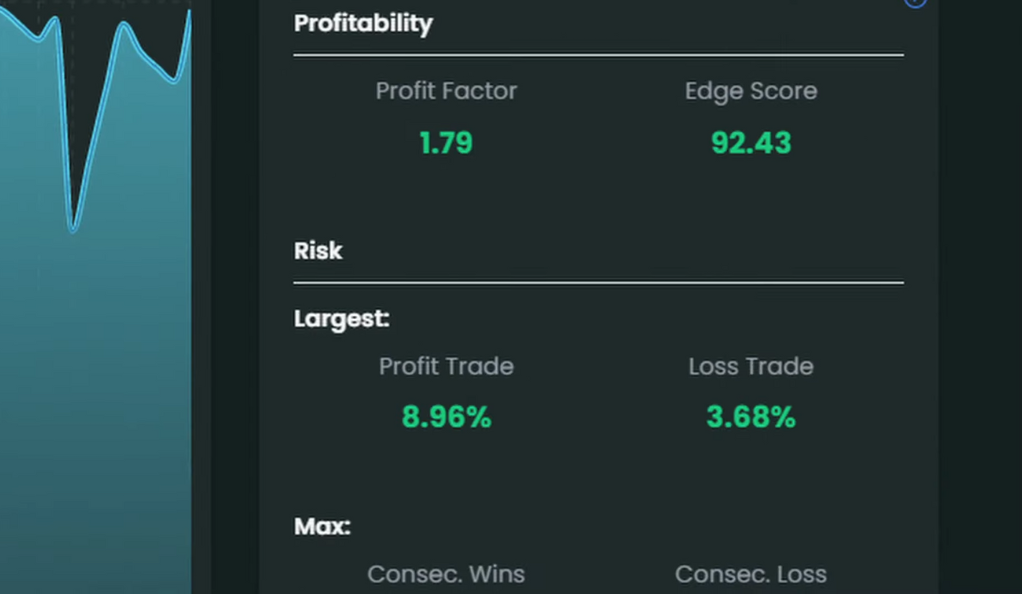
Backtesting is an essential process to evaluate the effectiveness of a trading strategy, including the Halftrend and RSI strategy. The Trader Edge tool, when combined with a leverage of 2x, enables traders to simulate the strategy’s performance using historical data. By applying the strategy’s rules and parameters to past market conditions, traders can gain insights into its profitability and assess its potential for success. Backtesting helps identify strengths and weaknesses, allowing traders to refine and optimize their approach, as well as understand the strategy’s historical performance before implementing it in real-time trading.
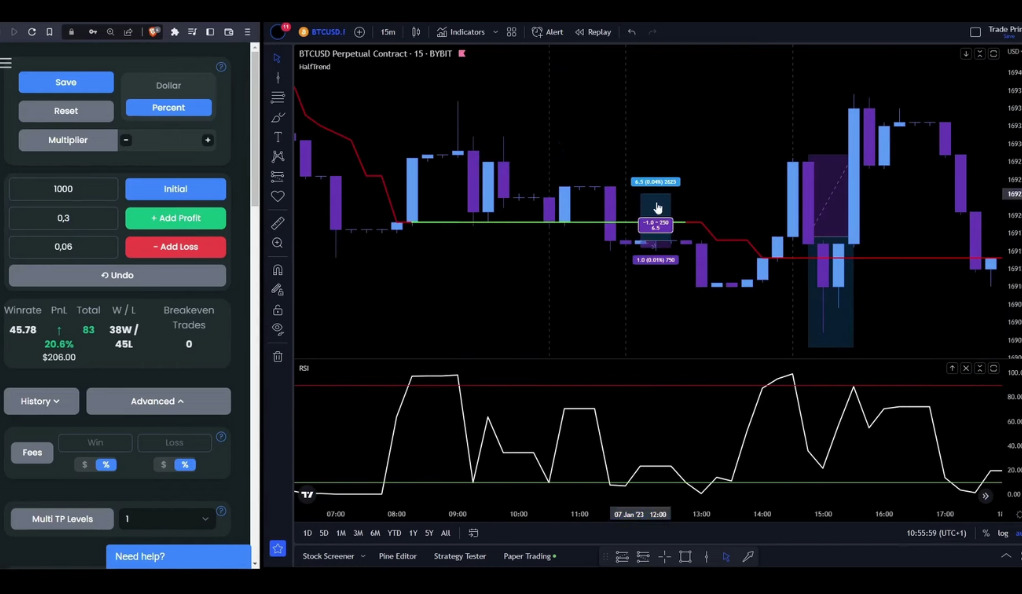
The Trader Edge tool provides a valuable platform for traders to test the Halftrend and RSI strategy under various market scenarios and timeframes. It allows traders to examine the strategy’s performance over a significant historical period, considering different market conditions, trends, and volatility levels. Through backtesting, traders can gain confidence in the strategy’s ability to generate consistent profits and understand its potential drawdowns or limitations. By analyzing the results and adjusting parameters if necessary, traders can enhance the strategy’s effectiveness and develop a better understanding of its risk-reward profile. Ultimately, backtesting using the Trader Edge tool empowers traders to make informed decisions and increase their chances of success when applying the Halftrend and RSI strategy in live trading.
Conclusion
In conclusion, the Halftrend and RSI trading strategy provides traders with a robust framework for making informed trading decisions. With its high win rate and the ability to identify clear entry and exit points, this strategy can be a valuable tool in navigating the financial markets. By understanding the indicators and their signals, traders can gain confidence in their trading approach and increase their chances of success.
However, it is crucial to remember that no strategy can guarantee consistent profits, and risk management remains a key factor in trading. Traders should carefully consider their risk tolerance, set appropriate stop-loss and take-profit levels, and continuously monitor and adapt their strategy to changing market conditions. Additionally, backtesting and optimizing the strategy can help refine its parameters and improve its performance. By combining a thorough understanding of the indicators with effective risk management practices, traders can approach the markets with confidence and increase their potential for successful trading outcomes. Happy trading!
Ainu Token aims to offer impartial and trustworthy information on cryptocurrency, finance, trading, and shares. However, we don't provide financial advice and recommend users to conduct their own studies and thorough checks.
Comments (No)