In the fast-paced and ever-changing landscape of cryptocurrency trading, a reliable strategy can make all the difference. One effective approach involves leveraging the Lux Algo trend lines with brakes indicator on the Bitcoin 5-minute chart. This strategy utilizes the power of trend lines to identify key support and resistance levels and incorporates the brakes indicator to gauge potential breakouts or reversals. By carefully studying the interplay of these indicators, traders can make more informed decisions and enhance their chances of success in the dynamic world of cryptocurrency trading.
To master this strategy, traders should first familiarize themselves with the Lux Algo trend lines with brakes indicator and understand how it works in the context of the Bitcoin 5-minute chart. They should learn to identify significant trend lines and recognize when they might act as support or resistance levels. Additionally, understanding the brakes indicator and its signals can be crucial in identifying potential trend reversals or breakout opportunities. As with any trading strategy, risk management remains paramount, so traders should use appropriate stop-loss orders and position sizing to protect their capital. With diligent practice and continuous monitoring of the market, traders can hone their skills in using the Lux Algo trend lines with brakes indicator and potentially achieve more consistent results in their cryptocurrency trading endeavors.
Understanding the Lux Algo Trend Lines Strategy
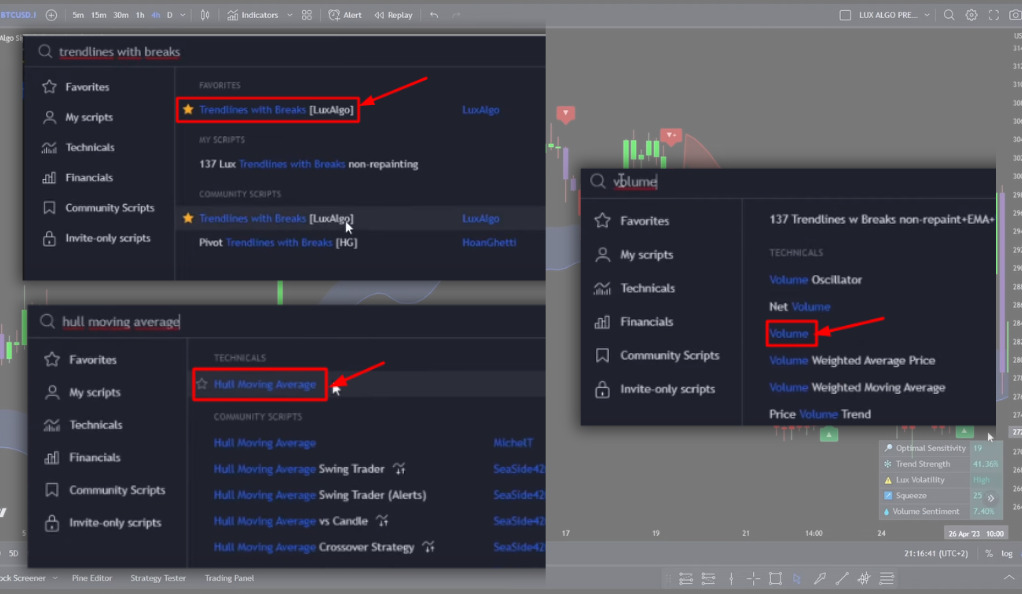
The Lux Algo trend lines strategy is a comprehensive trading approach that combines three powerful TradingView indicators to enhance trading decisions. The first key indicator is the Lux Algo trend lines with brakes, which helps identify critical support and resistance levels on the chart. These trend lines act as essential reference points for potential price movements and can guide traders in determining optimal entry and exit points. The second indicator used in this strategy is the volume indicator, which measures the trading activity in the market. Volume can offer valuable insights into the strength of a trend or potential trend reversals, validating the signals provided by the trend lines. Lastly, the Hull Moving Average (HMA) is employed to smooth out price data and offer a clear representation of the underlying trend.
When these three indicators are employed together, traders can gain a comprehensive understanding of the market dynamics, enabling them to make well-informed trading decisions. For long positions, traders may look for instances where the price bounces off a strong support level, confirmed by significant trading volume, and aligned with the upward slope of the HMA. Conversely, for short positions, they might identify moments where the price encounters a robust resistance level, accompanied by high trading volume and a downward slope of the HMA. Combining these indicators allows traders to identify potential entry and exit points with greater precision, offering a powerful strategy for navigating the dynamic world of cryptocurrency trading. However, as with any trading strategy, risk management and continuous evaluation of the market conditions are vital for success.
The Lux Algo Indicator
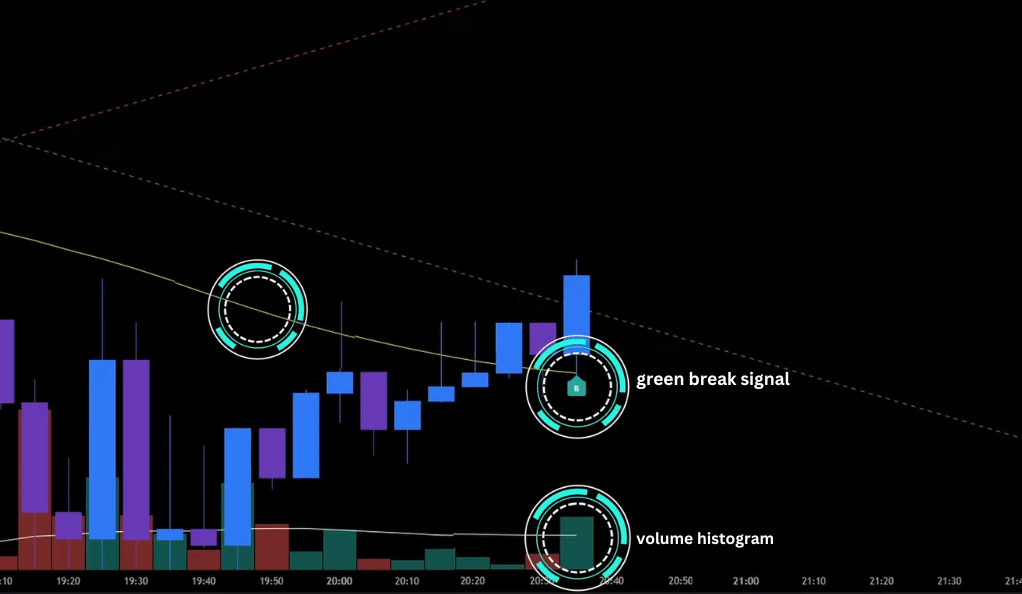
At the core of the Lux Algo trend lines strategy lies the essential Lux Algo indicator. This indicator plays a crucial role as it generates green and red break signals, serving as the primary triggers for trade entries. When the Lux Algo indicator prints a green break signal, it signifies a potential long position, indicating an opportunity to buy. On the other hand, a red break signal from the Lux Algo indicator suggests a short position, signaling a chance to sell. These break signals are instrumental in guiding traders’ decisions and form the foundation of the strategy, allowing traders to capitalize on potential trends and reversals in the cryptocurrency market.
The Volume Indicator
In the Lux Algo trend lines strategy, the volume indicator plays a critical role in confirming the entry signals generated by the Lux Algo indicator. To ensure a valid entry into a trade, traders look for a specific condition: the volume histogram must close above the Moving Average (MA) line. This confirmation is essential as it provides additional validation for the entry signal and indicates that there is substantial trading activity supporting the potential trend or reversal identified by the Lux Algo indicator. By requiring this confirmation, traders can increase their confidence in the trading signals and make more informed decisions when executing positions in the dynamic world of cryptocurrency trading.
The Hull Moving Average (HMA)
The Hull Moving Average (HMA) serves a crucial role in the Lux Algo trend lines strategy by acting as a filter to eliminate potential false signals. When considering a long position, traders look for the body of the candlestick to be positioned above the HMA line at the time when the green break signal is printed by the Lux Algo indicator. This alignment is essential as it confirms that the price action is favorably trending above the smoothed moving average, adding strength to the potential long trade. Similarly, for a short position, traders observe the body of the candlestick to be below the HMA line when the red break signal is generated. This condition verifies that the price action is favorably trending below the smoothed moving average, providing additional validation for the potential short trade. By incorporating the HMA in this manner, traders can reduce the likelihood of false signals and enhance the accuracy of their trading decisions in the fast-paced and dynamic realm of cryptocurrency trading.
Setting Up the Indicators
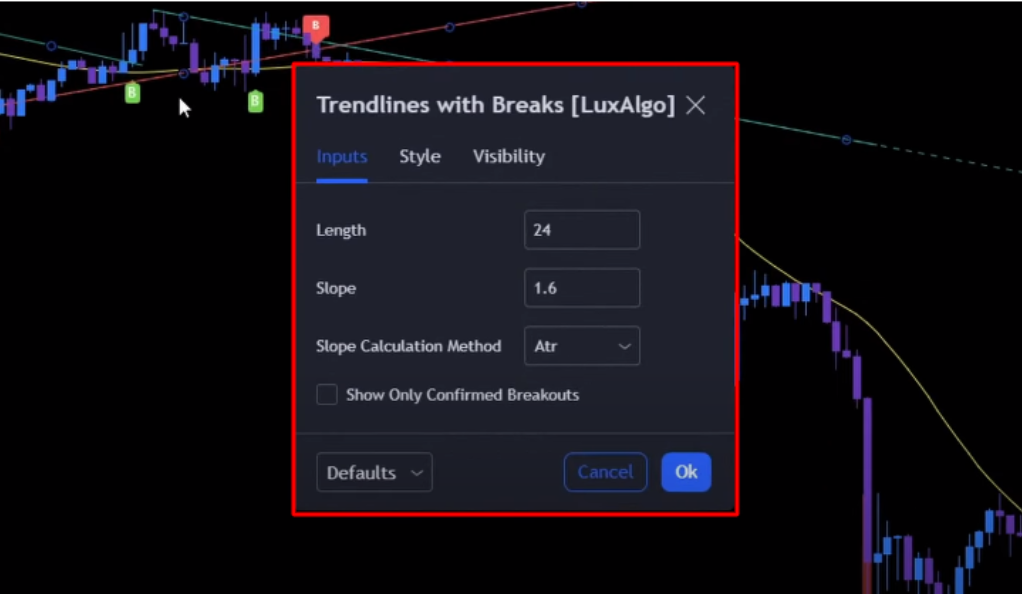
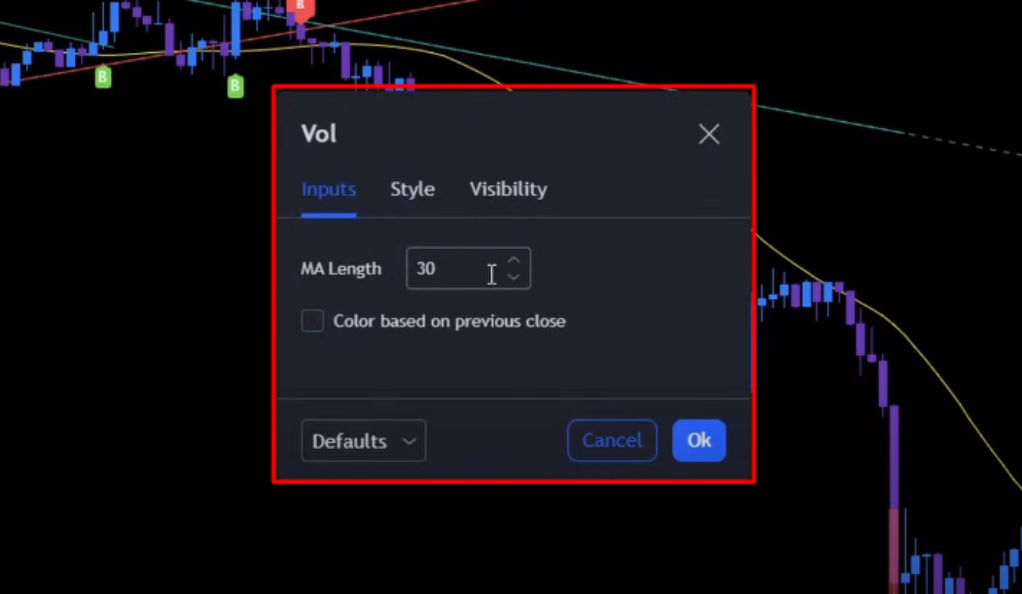
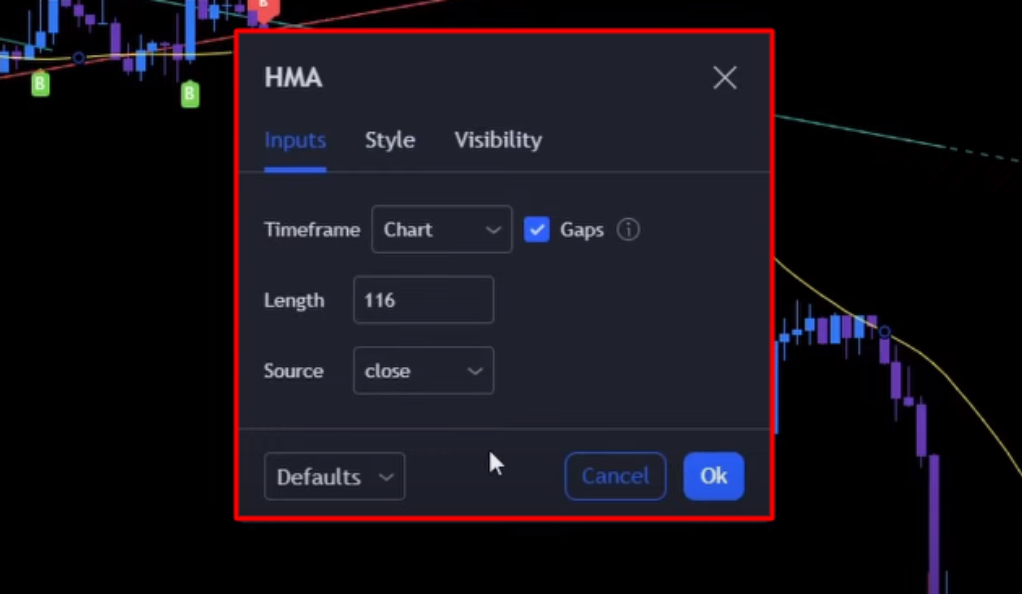
To ensure the success of the Lux Algo trend lines strategy, it is crucial to set up the indicators correctly. For the Lux Algo indicator, the settings are a length of 24 and a slope of 1.6. Additionally, the calculation method should be set to the Average True Range (ATR). Moving on to the volume indicator, it is advisable to set the length to 30 and enable the Moving Average (MA) option under the Styles section to have a clear representation of the volume histogram. Lastly, for the Hull Moving Average (HMA) indicator, the ideal length to use is 116. By configuring the indicators with these specified settings, traders can optimize the strategy’s performance and make well-informed trading decisions based on the signals provided by the Lux Algo trend lines with brakes, the volume indicator, and the HMA on the Bitcoin 5-minute chart.
The Trading Rules
The trading rules for this strategy are straightforward. For a long position, a green break signal must be printed by the Lux Algo indicator, the body of the candlestick must be above the HMA line, and the volume histogram must close above the MA line. If these conditions are met, a long trade is entered at the close of the candlestick, with the stop loss at the recent swing low and a target of one times the risk.
For a short position, the rules are similar but reversed. A red break signal must be printed by the Lux Algo indicator, the body of the candlestick must be below the HMA line, and the volume histogram must close above the MA line. If these conditions are met, a short trade is entered at the close of the candlestick, with the stop loss at the recent swing high and a target of one times the risk.
Backtesting the Strategy
Backtesting is a vital process for evaluating the effectiveness of the Lux Algo trend lines strategy and validating its potential success in real trading conditions. To perform the backtest, a backtester script with identical settings to the indicators is employed. The script incorporates the Average True Range (ATR) with a look back period of 7 and a multiplier of two to calculate the stop loss level. The ATR helps in determining the appropriate stop loss level based on market volatility, allowing traders to manage risk effectively. Additionally, the script ensures that positions are closed when an opposite signal appears, which means that the strategy follows a trend-following approach, aiming to ride the trend until there is a signal indicating a potential reversal. By running the backtest using historical market data, traders can assess the strategy’s performance over time, identify its strengths and weaknesses, and gain confidence in its ability to generate consistent results in different market conditions.
It is essential to interpret the backtesting results with caution and to consider potential pitfalls or limitations of the strategy. Backtesting provides insights into how the strategy would have performed in the past, but it does not guarantee future performance. Real-world trading involves factors like slippage, liquidity issues, and unforeseen events that cannot be fully simulated through backtesting. Therefore, after a successful backtest, it is advisable to conduct forward testing in a demo or small live trading environment to further validate the strategy’s efficacy before deploying it on a larger scale. Consistent monitoring and adjustment based on real-time market data can help traders optimize the strategy and adapt to changing market conditions, making it a robust tool for navigating the dynamic world of cryptocurrency trading.
Results of the Backtest
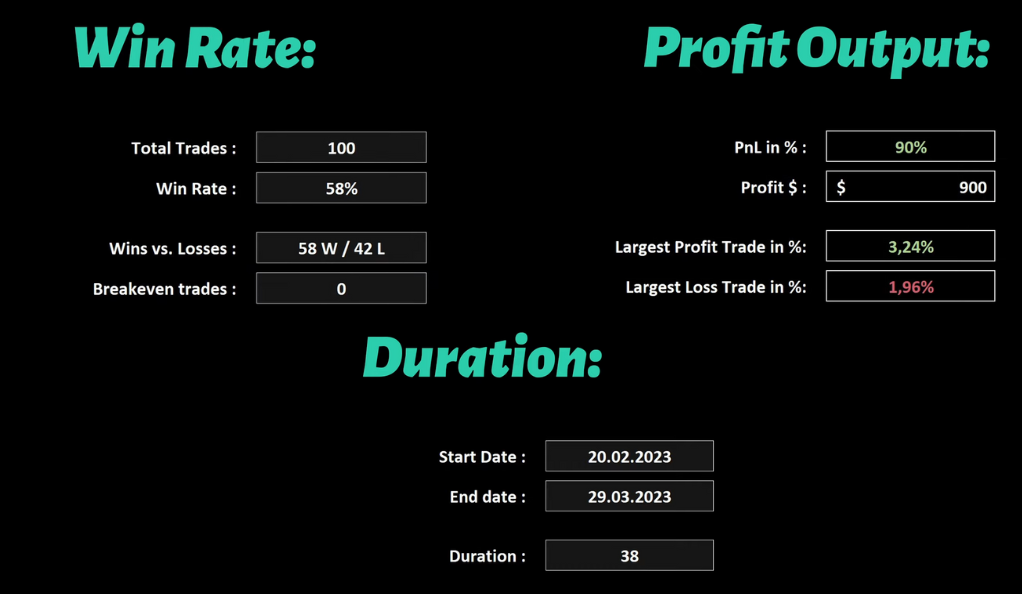
With an initial balance of $1,000 and a leverage of 2x, the strategy achieved a win rate of 58% after 100 trades. The account grew by $900 after 38 days of trading. The largest profit trade was 3.2%, and the largest loss trade was 1.9%. The average winning trade was 2.1%, and the average loss trade was 0.6%. The maximum drawdown was 6.4%.
Conclusion
The Lux Algo trend lines strategy, when properly implemented and backtested, can be a powerful tool for Bitcoin trading. It combines the strengths of the Lux Algo indicator, the volume indicator, and the HMA to provide reliable trading signals. However, like any trading strategy, it requires careful management and should be used in conjunction with other risk management strategies. Happy trading!
Ainu Token aims to offer impartial and trustworthy information on cryptocurrency, finance, trading, and shares. However, we don't provide financial advice and recommend users to conduct their own studies and thorough checks.
Comments (No)