The world of trading is a complex labyrinth of numbers, charts, and indicators. One of the most commonly used tools in this maze is the Moving Average. It’s a simple yet powerful tool, but like any other, it can lead to success or disaster depending on how it’s used. In this comprehensive guide, we’ll explore the ins and outs of the Moving Average and how to use it effectively in your trading strategy.
Understanding the Moving Average
A Moving Average is a statistical indicator commonly used in financial analysis to analyze price trends and patterns. It works by calculating the average price of a security or asset over a specific time period, constantly updating as new data becomes available. The purpose of using a Moving Average is to smoothen out the price fluctuations and reveal the underlying trend more clearly.
Moving Averages on price charts help visualize the price direction and filter out noise. Short-term Moving Averages respond quickly, while longer-term ones provide a broader market perspective. Price crossing above or below a Moving Average can signal trend reversals or continuations. However, Moving Averages alone do not predict future prices. Use them with other indicators and analysis for informed trading decisions. Consider market context and factors impacting price movements.
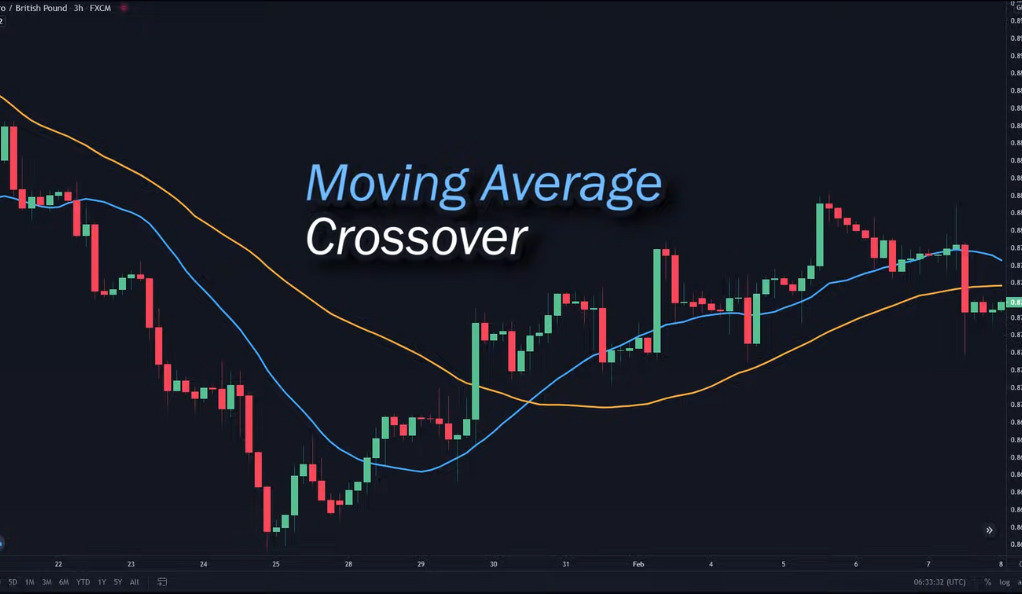
The Moving Average Crossover Strategy
The Moving Average Crossover Strategy is a widely used approach that leverages the intersection of two Moving Averages to identify potential trading opportunities. The strategy involves plotting two Moving Averages on a price chart: a faster one with a shorter time period and a slower one with a longer time period. When the faster Moving Average crosses above the slower Moving Average, it generates a buy signal, suggesting a potential uptrend. Conversely, when the faster Moving Average crosses below the slower Moving Average, it generates a sell signal, indicating a potential downtrend.
Exercise caution when using the Moving Average Crossover Strategy. It’s more effective in trending markets, but may generate false signals in range-bound or choppy markets. Use additional indicators to confirm signals and minimize false positives. Employ risk management techniques like stop-loss orders and profit targets. Continuously monitor the market and adjust the strategy as needed. Remember, the Moving Average Crossover Strategy is just one tool among many and should be used alongside thorough analysis and consideration of other market factors.
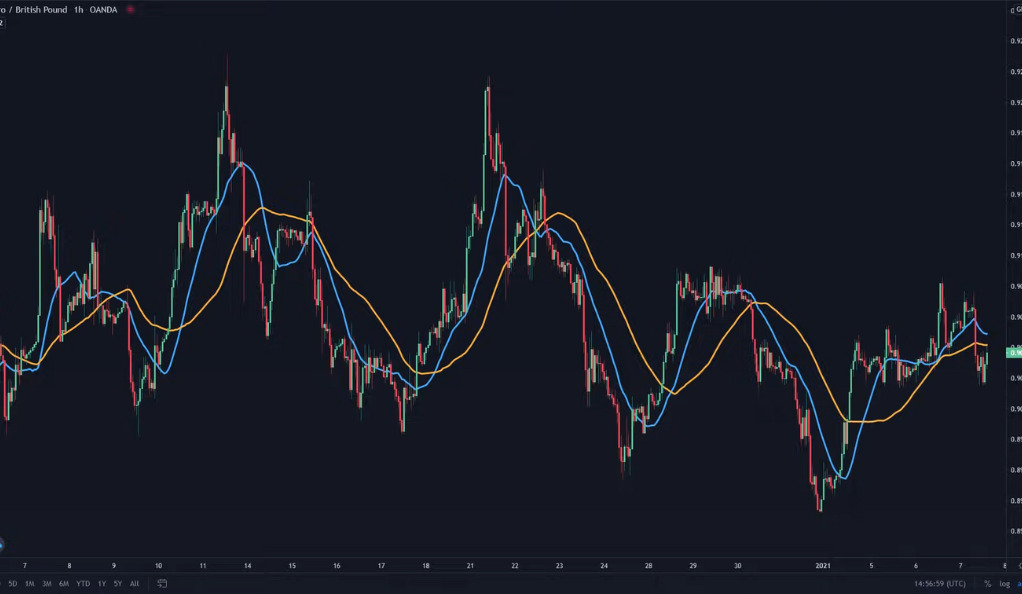
The Importance of Choosing the Right Number of Moving Averages
Selecting the appropriate number of Moving Averages is a crucial aspect of effective trading. While Moving Averages can provide valuable insights into market trends, using too many of them can lead to delayed entry signals. For example, comparing the use of two Moving Averages (such as the 20 and 50 periods) to three Moving Averages (including the 20, 50, and 200 periods), the latter can result in later entry signals. This delay occurs because each additional Moving Average requires more data points to confirm a crossover. Therefore, it’s important to strike a balance and avoid overcomplicating the analysis by using an excessive number of Moving Averages. Remember, sometimes simplicity can be more effective in trading.
By focusing on a smaller number of Moving Averages, traders can obtain timely signals to enter or exit trades. This allows for more responsive decision-making and reduces the risk of missing out on potential opportunities. Choosing the right combination of Moving Averages depends on individual trading preferences, timeframes, and the specific market being analyzed. Experimentation and testing different Moving Average periods can help traders determine the optimal number for their strategy. It’s essential to consider the trade-off between the responsiveness of signals and the potential for false signals when deciding on the number of Moving Averages to use in your analysis.
Time Frames Matter
The choice of time frames plays a significant role in the effectiveness of a trading strategy. Different time frames offer distinct perspectives on price movements and market dynamics. Lower time frames, such as intraday charts (e.g., 5-minute or 15-minute charts), tend to exhibit more volatile and choppy price action with frequent reversals. These shorter time frames often have less pronounced trends and are more susceptible to noise and random fluctuations, making trading strategies less effective. It can be challenging to identify reliable trends and generate accurate signals in such fast-paced environments.
Higher time frames, like daily or weekly charts, provide a broader view of the market and capture significant trends. They filter out short-term noise, making it easier to identify reliable trends. The daily time frame offers a balanced perspective on short-term and longer-term trends. Choose a time frame aligned with your goals, risk tolerance, and available time for analysis. Lower time frames suit frequent trading and active monitoring, while higher time frames offer more reliable trading opportunities. Finding the right balance between time frame and strategy is crucial for consistent success in trading.
Choosing the Right Market
When implementing the Moving Average crossover strategy, it’s important to consider the characteristics of the specific market being traded. Not all markets exhibit the same behaviors or respond equally to Moving Average crossovers. Therefore, observing how a particular market has historically reacted to the crossover signals becomes crucial in selecting the right market for this strategy.
Markets that consistently show clear and actionable signals following Moving Average crossovers are more likely to continue exhibiting similar behavior. Analyzing historical price data helps traders gain insights into the effectiveness of this strategy in a particular market. It’s important to avoid using this strategy in markets that have a history of providing ambiguous or unreliable signals. By selecting the right market, traders can increase their chances of success and make more informed decisions.
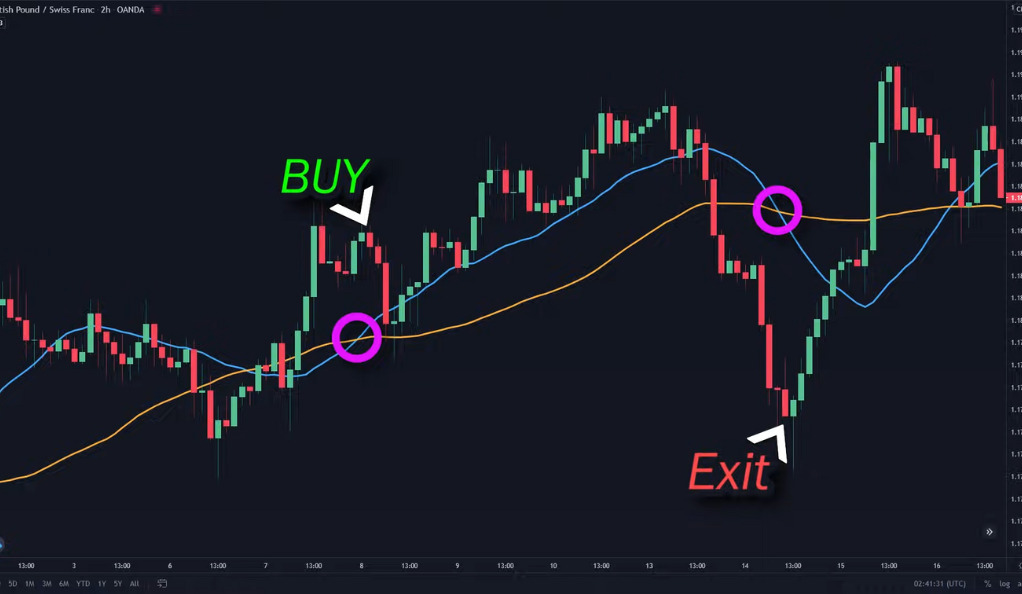
The Exit Signal
In trading, having a well-defined exit strategy is essential for managing risk and maximizing profits. While the Moving Average crossover strategy helps identify entry points, determining when to exit a trade is equally crucial. Relying solely on another Moving Average crossover for an exit signal may not always be the most effective approach. Instead, incorporating exit indicators, such as the Average True Range (ATR) trailing stop loss, can provide a more reliable and dynamic exit signal.
The ATR trailing stop loss dynamically adjusts the stop-loss level based on market volatility, allowing traders to capture larger gains during trending phases while protecting profits. Using reliable exit indicators like the ATR trailing stop loss helps avoid premature exits and emotional decision-making, leading to more consistent and profitable outcomes. Combining the Moving Average crossover strategy with effective exit indicators provides a comprehensive framework for precise trade entries and exits.
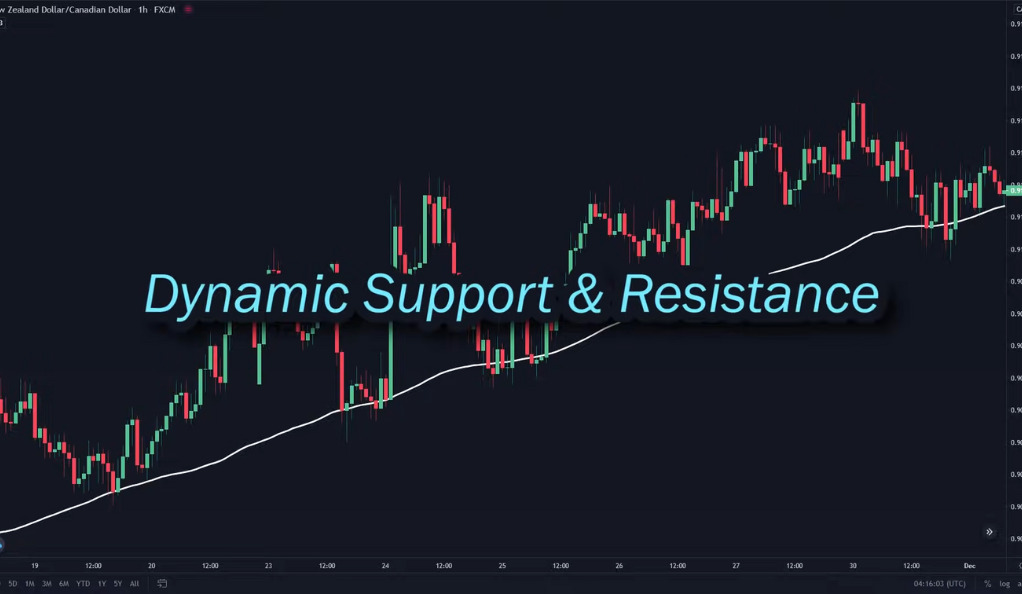
Using Moving Average as Support and Resistance
In addition to its primary use in identifying trends, the Moving Average can serve as a valuable tool for determining support and resistance levels in the market. When the price approaches the Moving Average from below, it often acts as a support level, where buying pressure outweighs selling pressure and may result in a bounce or reversal. Conversely, when the price approaches the Moving Average from above, it can act as a resistance level, where selling pressure outweighs buying pressure and may lead to a pullback or reversal. Traders often monitor these price reactions around the Moving Average to identify potential entry or exit points.
To enhance the effectiveness of using the Moving Average as support and resistance, traders can combine it with the Stochastics indicator. The Stochastics indicator helps assess overbought and oversold conditions by comparing the current price to its price range over a specific period. When the price approaches the Moving Average and the Stochastics indicator indicates overbought or oversold conditions, it provides additional confirmation for potential support or resistance levels. This combination allows for more informed decisions and increases the likelihood of successful trades. It’s important to consider other technical indicators, market context, and risk management practices for comprehensive trade analysis and protection of capital.
Combining with Other Indicators
Combining the 200 Exponential Moving Average (EMA) with other indicators can be a powerful technique to enhance the win rate of trading strategies. The 200 EMA is a widely used indicator that represents the average price of an asset over a 200-period time frame, giving significant weightage to recent data. By incorporating this indicator, traders can identify the overall trend and make informed buy or sell decisions based on its relationship with the price.
The general rule with the 200 EMA is to buy when the price is above it and sell when the price is below it. This aligns with trend following, where traders aim to participate in the prevailing market direction. Adding indicators like RSI or MACD can further enhance the strategy by providing confirmation signals for overbought or oversold conditions and momentum shifts. However, it’s crucial to remember that no strategy guarantees perfect results, and traders should analyze the market, consider risk management, and adapt accordingly for optimal trading outcomes.
Conclusion
The Moving Average is a versatile tool that, when used correctly, can significantly enhance your trading strategy. Remember, the key to successful trading is not just about using the right tools, but using them correctly. So, take the time to understand the Moving Average and the strategies discussed in this guide.
Ainu Token aims to offer impartial and trustworthy information on cryptocurrency, finance, trading, and shares. However, we don't provide financial advice and recommend users to conduct their own studies and thorough checks.
Comments (No)