In the fast-paced realm of trading, having effective strategies is crucial for traders to navigate their way toward financial success. Among the strategies that have been garnering attention from traders is the Stock Accurate Trading Strategy, which originated from the popular YouTube channel “Stock Accurate.” This strategy has demonstrated its effectiveness in diverse markets such as the Tesla 45-minute chart, cryptocurrencies, stocks, and Forex. This article endeavors to offer a comprehensive understanding of the Stock Accurate Trading Strategy, highlighting its key indicators and providing guidance on how traders can effectively implement it in their trading endeavors.
The Stock Accurate Trading Strategy has gained popularity for its accurate signal generation across various markets, including the Tesla 45-minute chart, cryptocurrencies, stocks, and Forex. By following its indicators and guidelines, traders can make informed decisions and potentially improve their trading success. To apply this strategy effectively, traders should understand the key indicators, interpret them correctly in different markets, and stay updated with the latest information and market trends. However, it’s important to note that trading strategies carry risks, so traders should exercise caution, conduct their own research, and consider seeking professional advice.
Understanding the Stock Accurate Trading Strategy
The Stock Accurate Trading Strategy has gained popularity among traders for its impressive performance in diverse markets, including the Tesla 45-minute chart, cryptocurrencies, stocks, and Forex. This strategy relies on two key indicators: John Anderson’s Standard Error Bands and Jonesy’s Magic. These indicators work together to provide traders with reliable signals, enabling them to avoid false entries and make well-informed trading decisions.
The Stock Accurate Trading Strategy uses John Anderson’s Standard Error Bands to identify potential price reversals by plotting upper and lower bands around the price chart. Combined with Jonesy’s Magic, which spots trend reversals, traders can improve their entry and exit points. This strategy’s strength lies in its clear rules for entering long and short positions, providing a structured framework suitable for traders of all experience levels. Traders should be aware that trading carries risks, and no strategy guarantees profits. Caution, research, risk management, staying informed about market trends, and adapting the strategy to individual trading styles are crucial for maximizing the Stock Accurate Trading Strategy’s effectiveness.
The Indicators: John Anderson’s Standard Error Bands and Jonesy’s Magic
The Stock Accurate Trading Strategy relies on two powerful indicators: John Anderson’s Standard Error Bands and Jonesy’s Magic. These indicators play a crucial role in helping traders avoid false entries and make informed trading decisions.
John Anderson’s Standard Error Bands is a technical indicator that plots upper and lower bands around the price chart. It helps traders assess market volatility and identify potential price reversals. Combined with Jonesy’s Magic, which detects trend reversals, these indicators provide valuable signals for optimal entry and exit points.
By incorporating John Anderson’s Standard Error Bands and Jonesy’s Magic into their trading approach, traders can enhance their accuracy and avoid making costly mistakes. However, it’s important to remember that trading carries risks, and no strategy can guarantee profits. Traders should exercise caution, conduct their own analysis, and consider other factors before making trading decisions.
John Anderson’s Standard Error Bands
John Anderson’s Standard Error Bands play a pivotal role within the Stock Accurate Trading Strategy. These bands are created by plotting upper and lower lines around the price chart, forming a volatility envelope. The width of the bands expands during periods of high market volatility and contracts during calmer phases. This dynamic representation of market volatility allows traders to assess the intensity of price movements and identify potential entry and exit points for their trades.
John Anderson’s Standard Error Bands provide insights into market trends and potential price reversals. The upper band indicates overbought conditions, signaling a possible reversal or correction, while the lower band suggests oversold conditions, indicating a potential bounce or reversal. Incorporating these bands into analysis can enhance decision-making and increase trading success, but caution, risk management, and combining with other tools are important.
Jonesy’s Magic
Jonesy’s Magic serves as the second key indicator within the Stock Accurate Trading Strategy. This indicator is specifically designed to offer traders entry and exit signals based on two important components: the rate of change and the exponential moving average. By incorporating these elements, Jonesy’s Magic aids traders in identifying potential market turning points and effectively timing their trades. The combination of the rate of change and the exponential moving average within Jonesy’s Magic enables traders to capture significant market movements, making it an invaluable tool in implementing the Stock Accurate Trading Strategy.
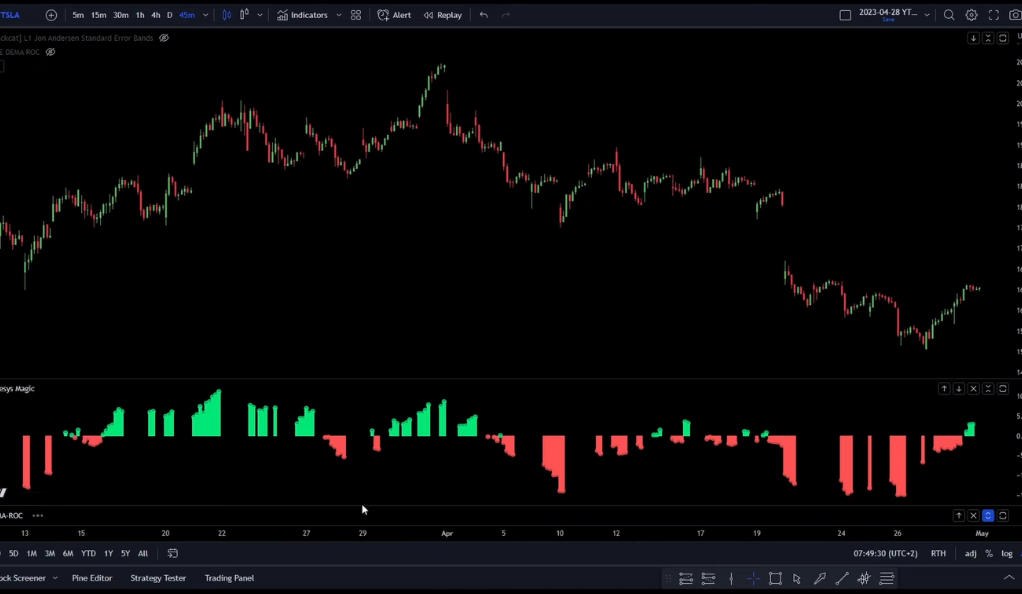
The rate of change component in Jonesy’s Magic allows traders to assess the momentum of price movements. By measuring the speed at which prices are changing, it helps traders identify potential shifts in market sentiment and anticipate trend reversals. The exponential moving average component, on the other hand, smooths out price data, providing traders with a clearer view of the overall trend. It helps traders determine the average price over a specific time period, giving them a reference point for assessing the current price’s deviation from the average.
By combining these elements, Jonesy’s Magic enables traders to make informed trading decisions. It provides valuable entry and exit signals, helping traders capitalize on significant market movements and enhance the effectiveness of the Stock Accurate Trading Strategy. However, it is important for traders to exercise caution, conduct thorough analysis, and consider other market factors before relying solely on any single indicator or strategy.
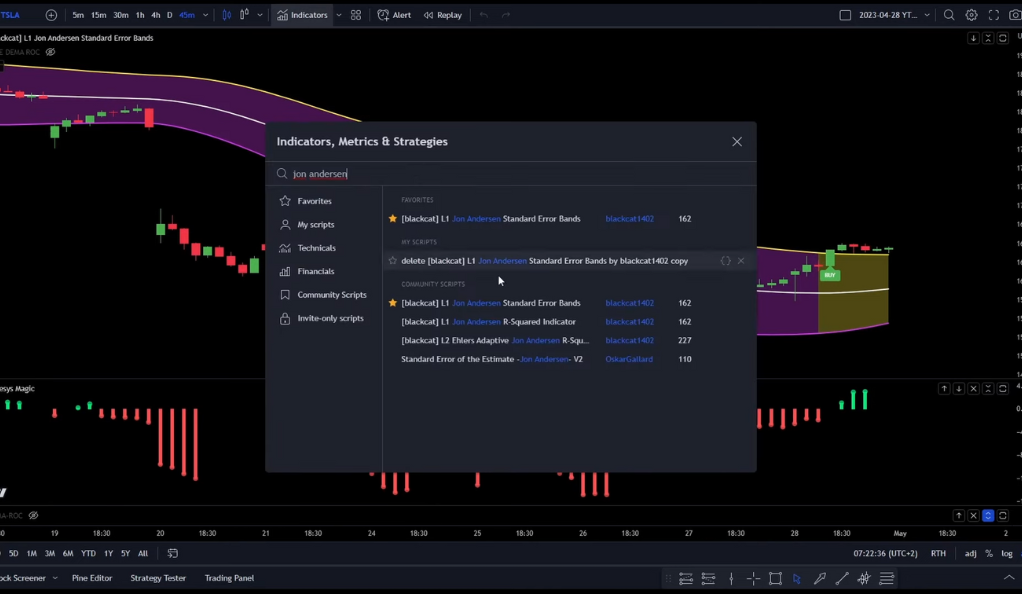
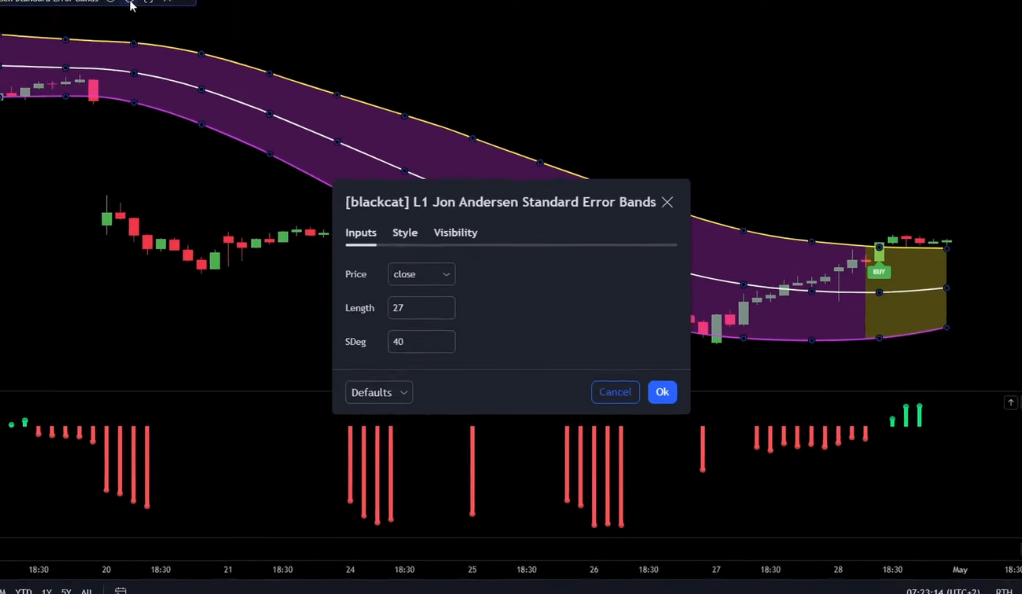
Setting Up the Indicators
To effectively implement the Stock Accurate Trading Strategy, it is essential to properly set up the indicators. For John Anderson’s Standard Error Bands, certain adjustments need to be made. The price source should be changed to the “close” price of the asset being analyzed. The length parameter should be set to 27, indicating the number of periods considered in the calculations. Additionally, the S tag should be adjusted to 40, configuring the standard deviation multiplier for the upper and lower bands. These settings are specifically tailored to optimize the performance of the Standard Error Bands within the Stock Accurate Trading Strategy.
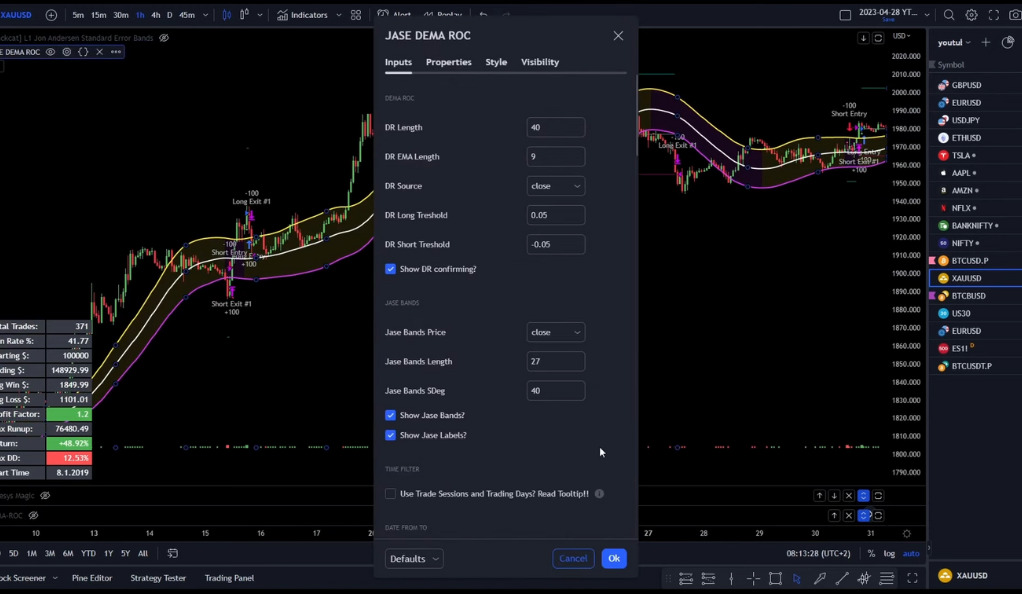
To configure Jonesy’s Magic, set the rate of change source to “close” and the length parameter to 40 periods. Adjust the exponential moving average (EMA) length to 9 for smoothing the price data. Use a positive value of 0.05 for the long threshold and a negative value of -0.05 for the short threshold. These settings ensure alignment with the Stock Accurate Trading Strategy. Regular monitoring and adjustments may be necessary based on market conditions, timeframes, and personal preferences.
Jase Dema Roc
Jase Dema Roc is a trading indicator commonly employed as part of a comprehensive trading strategy. It works in conjunction with other tools to provide traders with valuable insights into market trends and potential turning points. This indicator focuses on analyzing the rate of change in the market, allowing traders to identify opportunities for profitable trades.
Jase Dema Roc monitors the rate of change to detect significant market movements, enabling traders to capitalize on trends and price reversals. It is a powerful tool for maximizing returns. However, it should be used alongside other indicators and strategies to mitigate false signals and ensure a comprehensive trading approach that considers various factors like technical analysis, fundamentals, risk management, and market conditions.
Trading Rules for Long and Short Positions
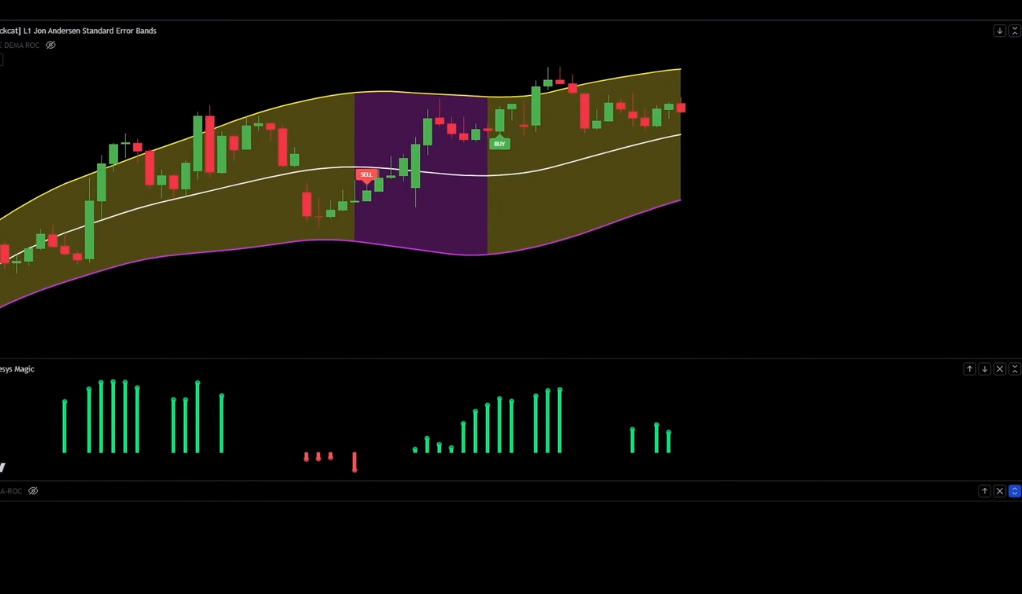
The Stock Accurate Trading Strategy offers precise guidelines for entering both long and short positions. To enter a long position, several conditions must be met. Firstly, the John Anderson bands need to generate a Buy Signal, indicating a potential bullish market reversal. Additionally, the price action should be positioned above the middle band of the bands, suggesting an upward trend. Moreover, the candle associated with the entry point should close with a bullish (green) color, further confirming the positive sentiment. Finally, a green histogram should accompany the entry signal, serving as an additional confirmation of the upward momentum.
On the other hand, for short positions, the strategy specifies a distinct set of rules. The John Anderson bands should produce a Sell Signal, indicating a potential bearish market reversal. The price action should be below the middle band of the bands, indicating a downward trend. The candle associated with the entry point should close with a bearish (red) color, affirming the negative sentiment. Lastly, a red histogram should accompany the entry signal, providing further confirmation of the downward momentum.
By adhering to these specific rules for long and short positions, traders can maintain a disciplined approach and reduce the influence of emotions in their trading decisions. It ensures a systematic framework for entering trades, relying on the signals generated by the John Anderson bands and confirming indicators like the color of the candle and the accompanying histogram.
Conclusion
The Stock Accurate Trading Strategy, with its unique blend of indicators and clear trading rules, offers a promising approach for traders across various markets. By leveraging John Anderson’s Standard Error Bands and Jonesy’s Magic, traders can navigate the market with increased confidence and precision. While the strategy has shown positive results in back-testing, it’s crucial for traders to understand and adapt it to their personal trading style and risk tolerance. As with any trading strategy, continuous learning, practice, and adjustment are key to success. Happy trading!
Ainu Token aims to offer impartial and trustworthy information on cryptocurrency, finance, trading, and shares. However, we don't provide financial advice and recommend users to conduct their own studies and thorough checks.
Comments (No)