Hey there, trading enthusiasts! Ready to plunge into the captivating universe of Fibonacci lines? This isn’t some recycled strategy you’ve seen a million times before. Nope, this is my own secret sauce, a method I’ve been perfecting over the years.
Think of these Fibonacci lines as a Swiss Army knife in your trading toolbox. They’re versatile, adaptable, and can be used across all timeframes. You can use them solo, or mix them up with your go-to strategies and indicators.
The Magic of Fibonacci Lines
Fibonacci lines, or as I like to call them, “Fancy Fib Lines,” are a powerful tool in the trader’s arsenal. They’re not just lines on a chart; they’re a roadmap to potential profits. But what makes them so special?
Simplicity and Versatility
The beauty of these lines lies in their simplicity. Instead of manually drawing horizontals by zooming out, you can simply turn these lines on and off. They’re versatile, working on every timeframe, and can be used in conjunction with other strategies or indicators. This simplicity makes them accessible to traders of all experience levels. Whether you’re a seasoned trader or a beginner, you can use these lines to guide your trading decisions. They’re versatile, meaning they can be used in various market conditions and with different asset classes. Whether you’re trading stocks, forex, or cryptocurrencies, these lines can provide valuable insights.
The versatility of these lines is truly remarkable. They can be used in a variety of trading strategies, from trend following to counter-trend trading. They can be used to identify potential support and resistance levels, giving traders a better understanding of the market’s potential direction. They can also be used in conjunction with other technical analysis tools, such as moving averages or oscillators, to provide additional confirmation of trading signals.
Profit Potential
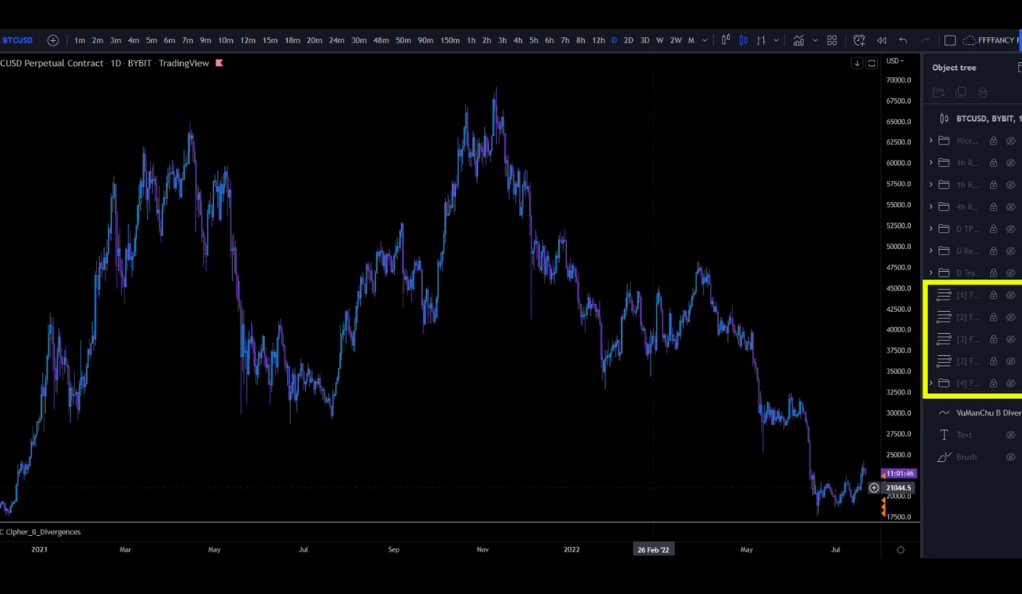
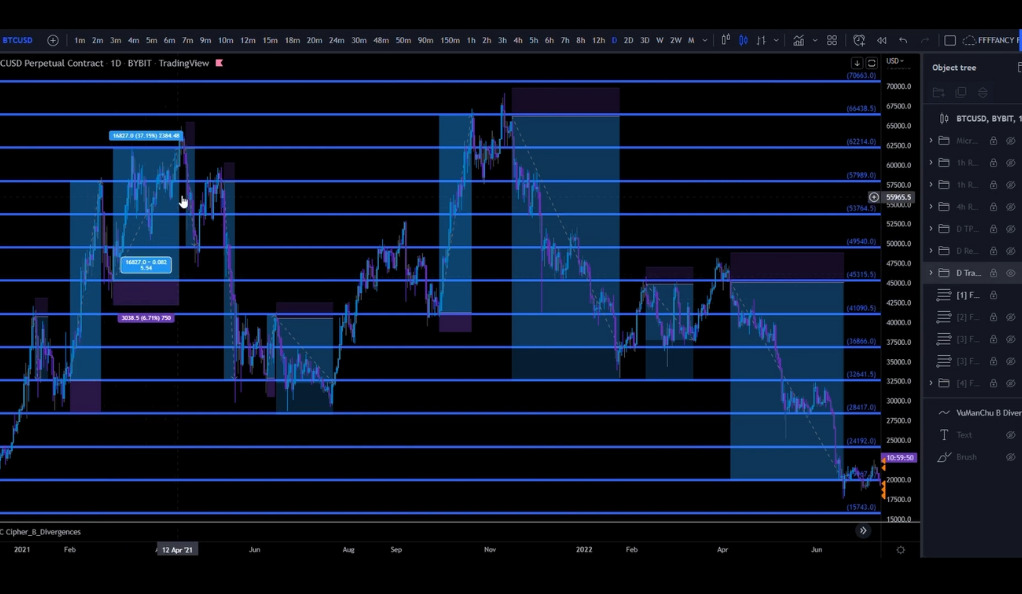
The potential for profit using these lines is immense. For instance, on the Bitcoin daily chart, you can see how the price has reacted to these lines multiple times. Each reaction presents a trading opportunity. Imagine making a 19% move here, a 77% move there, or even a 37% move somewhere else. The possibilities are endless!
These lines can help traders identify potential entry and exit points. By understanding how the price reacts to these lines, traders can make more informed decisions, potentially leading to higher profits. For example, a trader might decide to enter a long position when the price bounces off a Fibonacci support level, expecting the price to rise. Conversely, a trader might decide to exit a position or even enter a short position when the price reaches a Fibonacci resistance level, expecting the price to fall.
The profit potential of these lines is not limited to identifying entry and exit points. They can also be used to set profit targets and stop losses. By setting a profit target at a Fibonacci resistance level, a trader can ensure that they exit the trade at a point where the price is likely to reverse. Similarly, by setting a stop loss at a Fibonacci support level, a trader can limit their potential losses if the trade goes against them. This way, Fibonacci lines can help traders manage their risk and maximize their profits.
Applying Fibonacci Lines
Fibonacci lines are not just theoretical constructs; they are practical tools that can be applied in real-world trading. The application of these lines involves turning them on and off on your trading chart, observing how the price reacts to these lines, and making trading decisions based on these reactions. This process can be carried out across different timeframes, each offering unique insights and trading opportunities.
Application Across Different Timeframes
The first step in applying Fibonacci lines is to select the appropriate timeframe. This will depend on your trading style and objectives. For long-term traders, the daily timeframe may be most suitable. Here, you can turn on the first lines, zoom in, and observe how the price reacts to these lines. You’ll notice several points where the price has reacted, presenting potential trade opportunities.
For medium-term traders, the 4-hour chart may be more appropriate. Here, you can turn on more lines and observe the price action in more detail. Short-term traders might prefer the 1-hour or even the 12-minute timeframe. On these shorter timeframes, you can turn on even more lines and observe the price action in real-time. Regardless of the timeframe you choose, the key is to observe how the price reacts to the Fibonacci lines and to make your trading decisions based on these reactions.
Daily Timeframe
The daily timeframe is a crucial chart for traders who are looking to understand the broader market trends. This timeframe provides a comprehensive view of the market’s movement, capturing the opening, closing, high, and low prices for each day. When applying Fibonacci lines on the daily timeframe, you start by turning on the first lines. The daily chart provides an excellent overview of how the price has reacted to these lines over a more extended period.
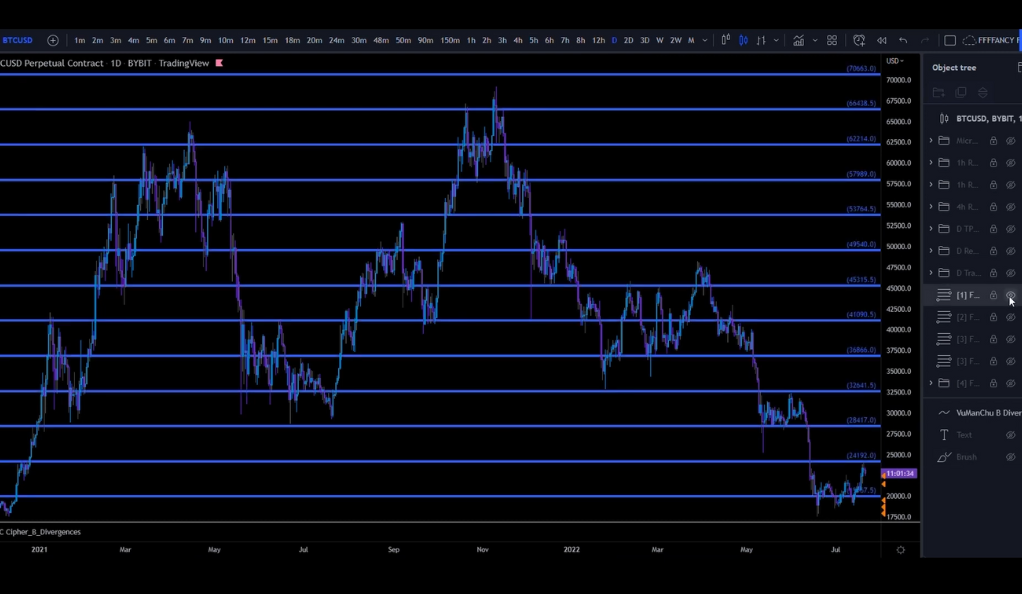
Observing the daily timeframe allows traders to identify significant levels of support and resistance that have been tested multiple times. These levels often act as psychological barriers in the market, where price tends to react more significantly. By zooming in on the daily chart, you can see these reactions more clearly. Each reaction point presents a potential trading opportunity. For instance, if the price bounces off a Fibonacci support level on the daily chart, this could be a signal to enter a long position, expecting the price to rise.
Maximizing Profit Potential
The daily timeframe is particularly useful for maximizing profit potential. By observing how the price reacts to the Fibonacci lines on this timeframe, traders can identify potential trades that could lead to substantial profits. For example, imagine spotting a price reaction that leads to a 19% move here, a 77% move there, or even a 37% move somewhere else. The possibilities for profit are vast when you understand how to interpret and respond to these price reactions.
Moreover, the daily timeframe allows traders to set more accurate take-profit and stop-loss levels. Since the daily chart provides a broader view of the market, it can help traders identify significant support and resistance levels that might not be visible on shorter timeframes. By setting take-profit and stop-loss levels at these significant Fibonacci levels, traders can potentially increase their profits and limit their losses, leading to more successful trading outcomes.
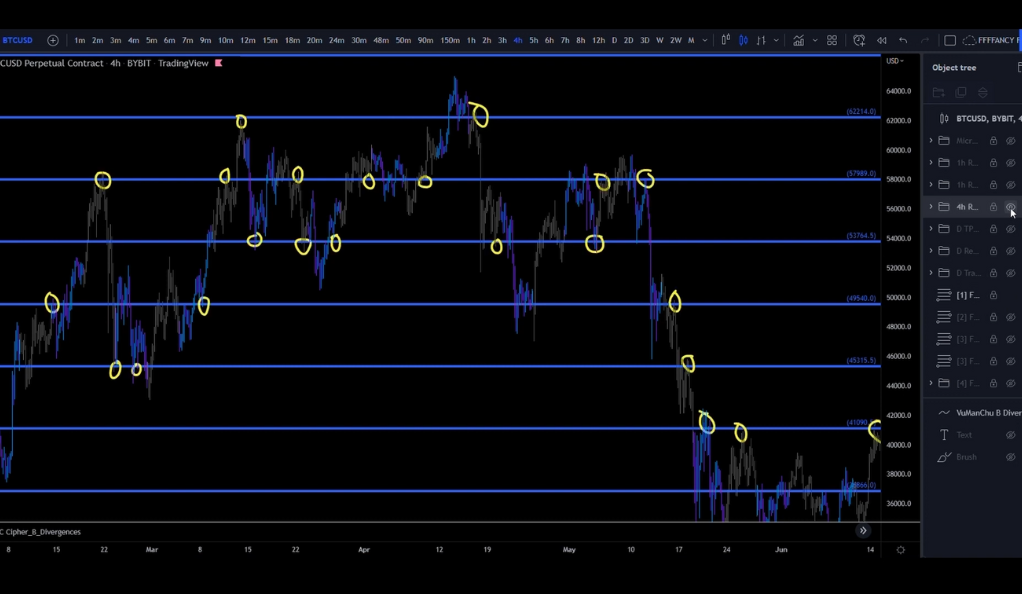
4-Hour Timeframe
Switch to the 4-hour chart, and you’ll see the price reacting perfectly to the Fancy Fib Lines again. Zoom in a bit more, turn on more lines, and observe the price action.
1-Hour Timeframe
On the 1-hour timeframe, you can see the actual price action. Turn on the first and second Fibs and observe how the price reacts. You’ll see numerous reactions and possibilities, which is truly amazing.
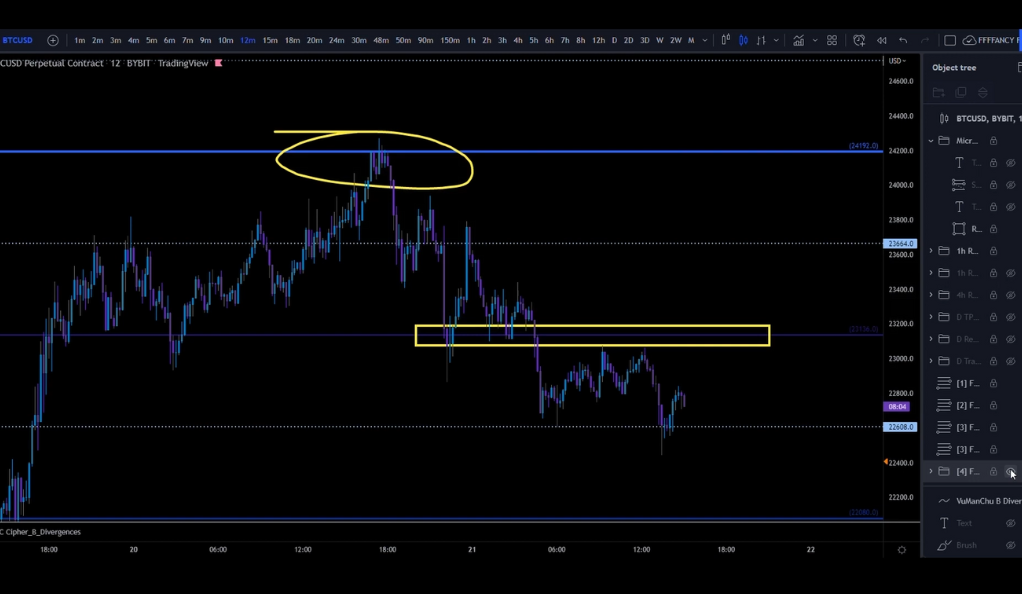
12-Minute Timeframe
Finally, on the 12-minute chart, turn on the fourth Fib lines. Here, you might spot a quick short opportunity. Use the red dot of the Cipher B Indicator as an entry confirmation, with the next lower Fib line as your target.
The Power of Fibonacci Lines
Fibonacci lines are more than just a tool for identifying potential trading opportunities; they are a powerful instrument that can be used for a variety of purposes in trading. From setting profit targets to managing risk, these lines offer a wealth of possibilities for traders.
Setting Profit Targets and Stop Losses
One of the key advantages of Fibonacci lines is their ability to help traders set profit targets and stop losses. By identifying potential resistance and support levels, these lines can provide traders with a clear idea of where to take profits or cut losses. For instance, a trader might set a profit target at a Fibonacci resistance level, expecting the price to reverse at this point. Similarly, a stop loss could be set at a Fibonacci support level, limiting potential losses if the price moves in the opposite direction. This strategic use of Fibonacci lines can significantly enhance a trader’s risk management strategy, helping to protect profits and limit losses.
Understanding Market Dynamics
Fibonacci lines can also provide valuable insights into market dynamics. They can help traders understand when a support line turns into resistance, and vice versa. This can be particularly useful in volatile markets, where price levels can change rapidly. By understanding these shifts, traders can adjust their strategies accordingly, potentially gaining an edge over less informed market participants. For example, if a Fibonacci support line is broken and the price falls below it, this line could become a new resistance level. Recognizing this shift could allow a trader to take advantage of new trading opportunities.
Enhancing Trading Strategies
Finally, Fibonacci lines can be used to enhance existing trading strategies. Whether a trader is using a trend-following strategy, a counter-trend strategy, or any other approach, these lines can provide additional confirmation of trading signals. For instance, a trader using a moving average crossover strategy might look for confirmation from Fibonacci lines before entering a trade. If the crossover occurs near a Fibonacci support or resistance level, this could provide additional confirmation of the signal, increasing the likelihood of a successful trade. In this way, Fibonacci lines can be a powerful addition to any trader’s toolkit, helping to increase the effectiveness of their trading strategies.
Conclusion
In conclusion, Fibonacci lines are a powerful, versatile tool for traders. They offer a simple yet effective way to identify potential trades, set targets, and manage risk. In future articles, I’ll show you how to draw these lines and share a super easy scalping strategy based on them. So, stay tuned, and happy trading!
Ainu Token aims to offer impartial and trustworthy information on cryptocurrency, finance, trading, and shares. However, we don't provide financial advice and recommend users to conduct their own studies and thorough checks.
Comments (No)