The world of trading is as vast as it is complex, with numerous strategies and techniques used by traders to maximize their profits. One such technique involves the use of repainting indicators. While initially these indicators can appear deceiving, understanding their function can yield valuable insights for real-time trading. We’ll explore this contentious topic, taking into account backtesting methodologies, and particularly, our experience with the Lux Algo Trendlines with Breaks Indicator.
Decoding Repainting Indicators: More than What Meets the Eye
The Notorious Reputation of Repainting Indicators
In the trading community, repainting indicators often bear the brunt of criticism due to their dynamic nature. They have the ability to change their values retrospectively, which may lead to confusion and mistrust amongst traders, especially when it affects the accuracy of backtesting results and creates unrealistic profit projections.
The Flip Side of the Coin: Benefits of Repainting Indicators
While repainting indicators may carry a somewhat notorious reputation in trading circles, they aren’t devoid of benefits. These dynamic tools can be of significant value, especially in real-time trading, given that a trader understands their functionality and interprets their changes accurately.
Adaptability in a Fluid Market
One of the key benefits of repainting indicators lies in their inherent adaptability. Financial markets are fluid, constantly in motion, and subject to change based on a myriad of factors. Repainting indicators mirror this fluidity. Unlike static indicators, they aren’t constrained to a specific value once a time frame closes. They have the ability to change their signals even after the period has ended.
This means that as new price information becomes available, the repainting indicator can adjust itself to reflect the most accurate picture of the market at that given moment. This dynamism makes them particularly valuable in volatile markets, where conditions can change rapidly, and traders need to adapt just as quickly.
Real-time Trading Insights
In real-time trading, every moment counts. The ability of repainting indicators to adjust their signals with changing market conditions can provide traders with instant feedback and insights about the market’s current state. This is in contrast to non-repainting indicators, which may not reflect the immediate changes in the market as they wait for the candle to close.
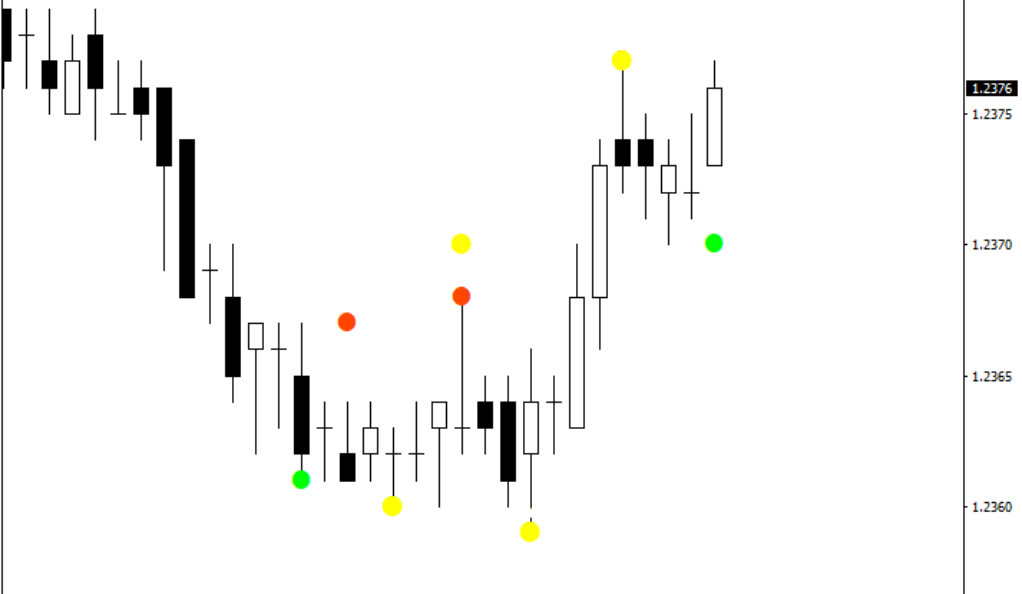
For instance, if a repainting indicator initially gives a bullish signal, but then changes to bearish as the market condition changes, the trader can use this information to make a more informed decision in real-time. In this way, repainting indicators can provide more responsive and timely signals compared to their non-repainting counterparts.
Identifying Trend Strengths and Weaknesses
Another advantage of repainting indicators is their ability to highlight the strength or weakness of a trend. For instance, if a repainting indicator frequently changes its signals during a trend, it could indicate a weak or unstable trend. Conversely, if the indicator maintains its signals consistently throughout a trend, it could suggest a strong and stable trend.
This ability to glean insights into trend strength and reliability can significantly aid traders in making more effective trading decisions. It can provide guidance on whether to enter a trade, continue to hold a position, or exit a trade.
The Power of Contextual Information
Perhaps one of the most valuable aspects of repainting indicators is their ability to provide contextual information. In the world of trading, context is king. An uptrend signal is far more reliable in a bullish market context than a bearish one. By continually updating their signals to reflect the latest market conditions, repainting indicators provide a running commentary on the market context.
Navigating Backtesting Complexities: Challenges and Insights
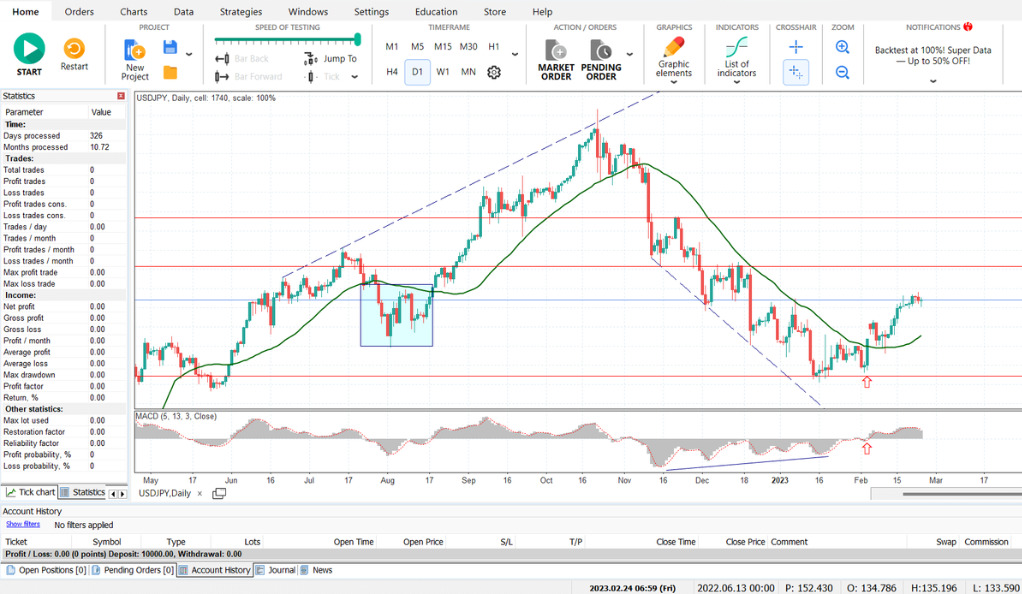
Navigating backtesting complexities demands a deep understanding of the underlying tools, particularly dynamic elements like repainting indicators. Their inherent adaptability can create challenges, yielding overly optimistic results that may not replicate in real-time trading. However, they also provide insights, offering valuable lessons on indicator behavior, market patterns, and the need for accurate interpretation for effective trading strategy development.
An Insider’s Experience with Lux Algo Trendlines
Imagine this: you’re backtesting a scalping strategy using the Lux Algo Trendlines with Breaks Indicator. Initially, the results seem too promising, almost incredible. However, when you apply the same strategy in real-time trading, the anticipated results don’t materialize. This discrepancy can cause disillusionment, with traders feeling as if they’ve been tricked by repainting signals.
Unveiling the Reality: Understanding the Intricacies of Repainting Indicators
However, the issue doesn’t lie with the repainting indicators themselves, but rather with our understanding of them. When using repainting indicators for backtesting, it’s vital to understand their dynamic nature and how they function. This awareness can help us interpret the results accurately and avoid falling into the trap of overly optimistic projections.
Leveraging Repainting Indicators in Real-Time Trading
Leveraging repainting indicators in real-time trading involves harnessing their dynamic nature to gain timely market insights. Their ability to adapt to shifting market conditions, providing immediate feedback, makes them invaluable in fast-paced trading scenarios. Thus, when understood and interpreted correctly, repainting indicators can significantly enhance real-time trading strategies.
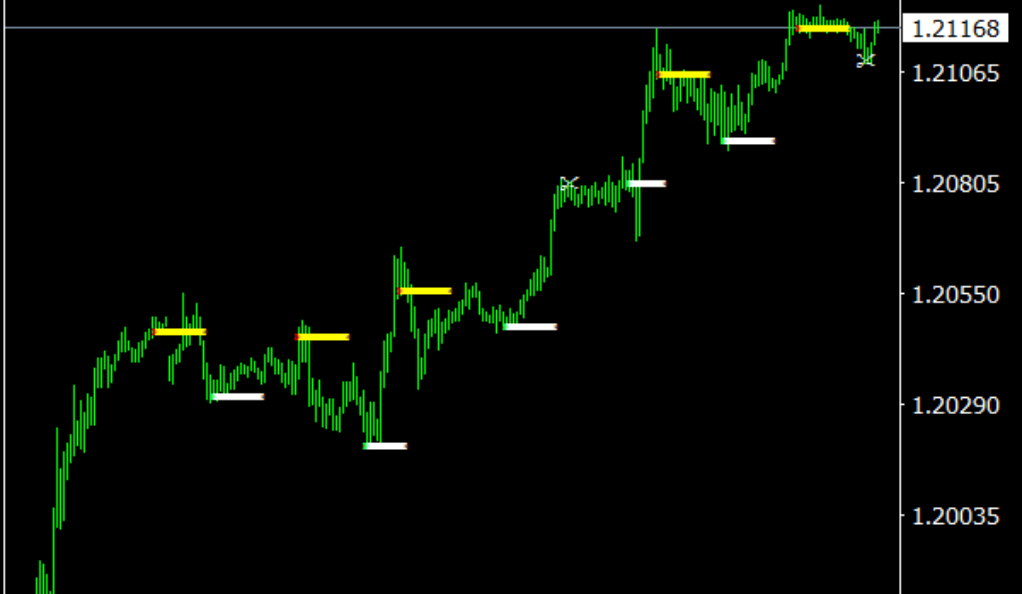
Interpreting Signal Changes: An Art and Science
While it’s true that repainting indicators can skew backtesting results, their application in real-time trading can yield significant benefits. The volatility of these indicators, especially the way the signals can change before a candle closes, can provide valuable market insights and potential trading opportunities if harnessed correctly.
The Power of Chart Replay Mode
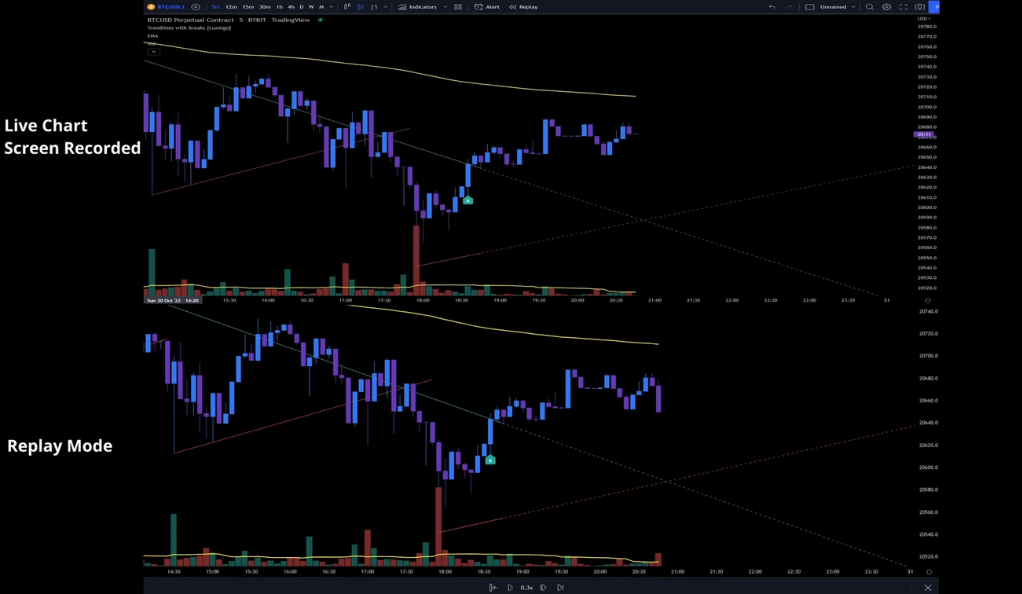
The chart replay mode is far more than a simple tool – it’s a potent ally in a trader’s repertoire, playing a pivotal role in decoding the complexities of repainting indicators. This feature allows traders to revisit the past, dissecting and understanding each trading scenario as it unfolded.
Revisiting Historical Performance
One of the primary benefits of the chart replay mode is its ability to provide a historical review of an indicator’s performance. This review is akin to a time machine, enabling traders to travel back in time and observe how an indicator behaved in a specific market situation.
Traders can use this feature to evaluate how repainting indicators responded to different market conditions, whether it was a period of high volatility, a trending market, or a quiet consolidation phase. This way, traders can gain insights into the indicator’s performance, which is not possible through a static snapshot.
Understanding the Evolution of Signals
The chart replay mode is not just about reviewing past performance; it’s about understanding the evolution of signals. Repainting indicators are unique in their ability to change their values before a candle closes. Watching this change play out in real-time on a chart replay can provide traders with a deeper understanding of these signal changes, helping them predict future signal changes better.
For example, a trader might notice that a certain repainting indicator tends to repaint more during periods of high volatility. This information could be incredibly valuable in helping the trader prepare for similar scenarios in the future.
Preparing for Real-time Trading Scenarios
The value of the chart replay mode extends beyond its historical perspective. It serves as a real-time trading simulation, enabling traders to test their strategies without risking actual capital.
Traders can apply their strategies using repainting indicators on past market data and observe how they would have performed. They can then refine their strategies based on these results, making adjustments where necessary to improve performance. This practice can help traders gain confidence, equipping them for actual trading scenarios.
Unveiling the Nuances of Dynamic Indicators
Perhaps the most important function of chart replay mode is its ability to unravel the subtleties of dynamic indicators like repainting ones. By seeing how these indicators can change their values and observing their overall performance over time, traders can develop a deep understanding of their functioning.
In essence, chart replay mode provides traders with an opportunity to lift the veil on the often mysterious world of repainting indicators, providing them with insights and experiences that can be invaluable in their trading journey.
Mastering Repainting Indicators: A Balancing Act
Mastering repainting indicators is indeed a balancing act. It requires understanding their dynamic behavior, managing expectations, and using this knowledge to form effective trading strategies. Despite their unpredictable nature, repainting indicators, when used astutely, can provide a competitive edge in the fast-paced, ever-changing landscape of financial markets.
Managing Expectations: The Key to Effective Trading
Navigating the world of trading involves managing expectations, and repainting indicators are no exception. While they can offer valuable insights, they also run the risk of producing over-optimistic backtesting results. The world of trading is inherently risky and unpredictable, with no absolute guarantees, only probabilities.
Merging Knowledge with Strategy: The Path to Success
A well-informed trader is often a successful trader. By understanding the mechanisms of repainting indicators and integrating them into a broader trading strategy, traders can make informed decisions. This approach, coupled with other trading facets like price action, trading volume, and market news, can lead to a more comprehensive and successful trading strategy.
Conclusion
In the end, the controversial nature of repainting indicators shouldn’t detract from their potential value. They may not be the most reliable tool for backtesting, but their dynamism can provide insightful data for real-time trading. Traders who thoroughly understand their nuances can effectively use them to navigate the often volatile trading waters. So, let’s not see repainting indicators as a hurdle but as a challenging aspect to master in the captivating world of trading. As the saying goes, ‘knowledge is power,’ and in trading, this power can translate into profits.
Ainu Token aims to offer impartial and trustworthy information on cryptocurrency, finance, trading, and shares. However, we don't provide financial advice and recommend users to conduct their own studies and thorough checks.
Comments (No)