In the dynamic world of trading, trend lines serve as a crucial compass guiding traders through the ebbs and flows of market trends. They are not just arbitrary lines drawn on a chart, but rather, they represent key levels formed in a trending market. These lines connect at least two price points, creating a visual representation of the trend’s direction and its rate of acceleration. This visual guide can be a powerful tool for traders, helping them to anticipate potential price movements and plan their trades accordingly.
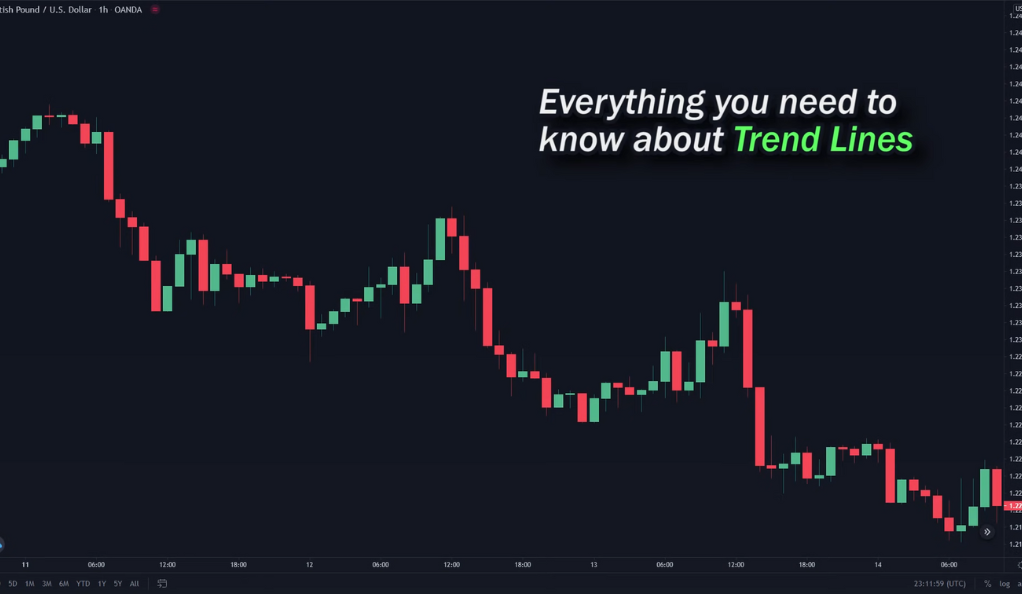
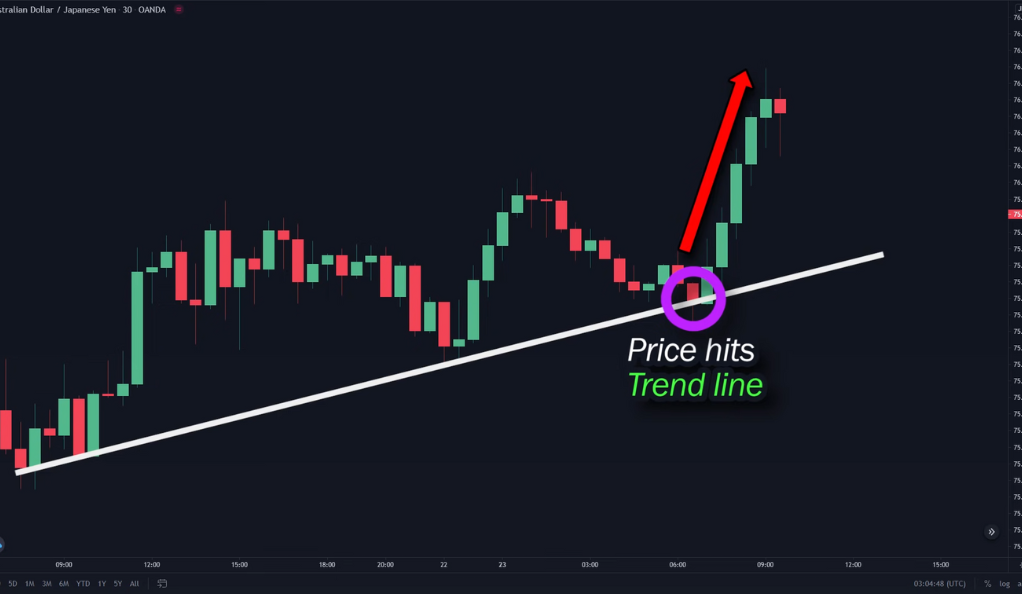
Trend lines are particularly valuable because they can offer high win-rate trade opportunities when the price approaches these levels. This is because prices often respect the trend line during a trend, bouncing off the line and continuing in the original direction. This bounce provides traders with an opportunity to enter the market in line with the trend for potentially profitable trades. However, understanding trend lines is not just about knowing how to draw them. It’s also about understanding what they represent and how to use them effectively in conjunction with other trading tools and indicators. This comprehensive understanding can be the key to unlocking successful trading strategies.
What are Trend Lines?
Trend lines are a type of technical analysis tool that traders use to identify and analyze market trends. They are drawn on price charts, connecting at least two price points to form a line. This line represents a trend in the market, either upward or downward, and can help traders predict future price movements.
Types of Patterns in Trend Lines
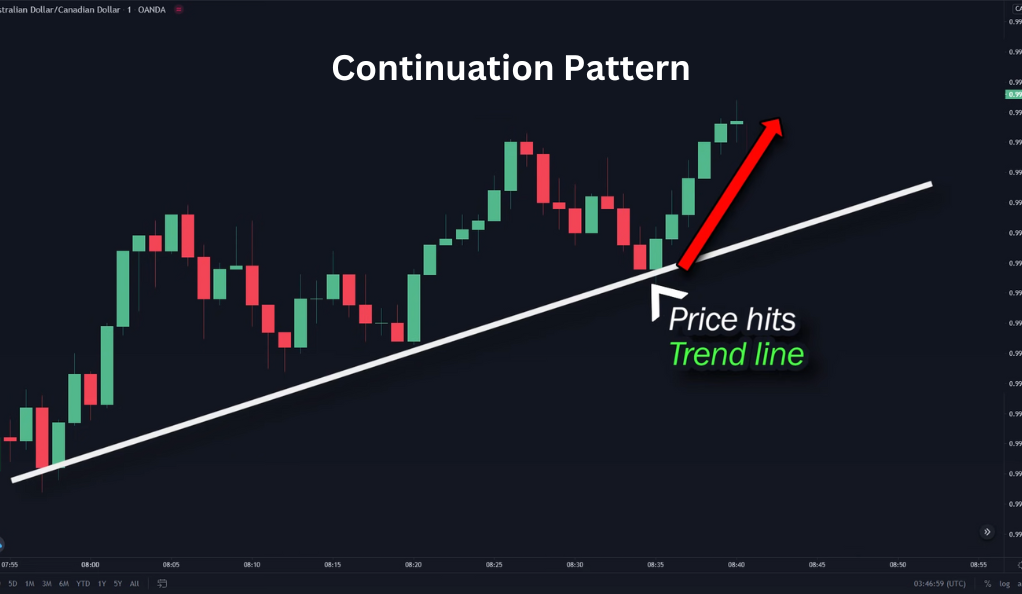
When it comes to trend lines, there are two main types of patterns that traders look out for: the continuation pattern and the breakout pattern.
Continuation Pattern
The continuation pattern is formed when the price bounces back to the direction of a trend after hitting a trend line. This pattern suggests that the existing trend is likely to continue. For instance, if the price of a stock is trending upward and it bounces off the trend line, this could indicate that the upward trend is set to continue.
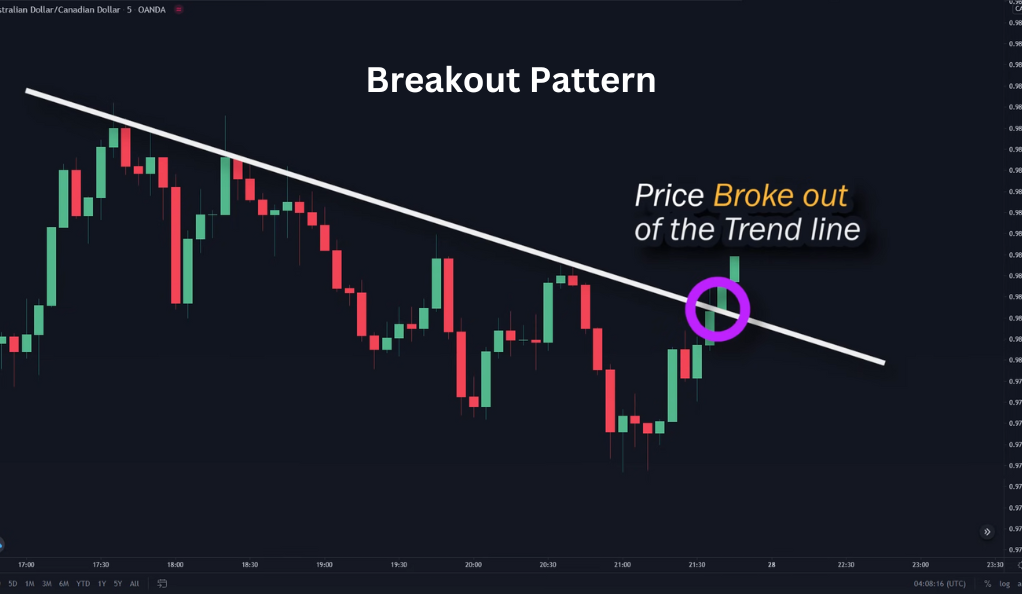
Breakout Pattern
On the other hand, the breakout pattern is formed when the price breaks out of a trend line, causing the trend to switch directions. This could mean that a new trend is about to start. For example, if the price of a stock is trending downward and it breaks through the trend line, this could signal that the downward trend is about to reverse, and an upward trend may be on the horizon.
Drawing Trend Lines
Drawing trend lines, while seemingly straightforward, is often considered more of an art than a science. This is because it requires a keen eye and a good understanding of market trends. The objective is to draw the trend line where it touches the most price points, as this can provide a more accurate representation of the market trend. The more price points a trend line touches, the more significant it becomes in the eyes of traders, as it is seen as a stronger representation of the prevailing market trend.
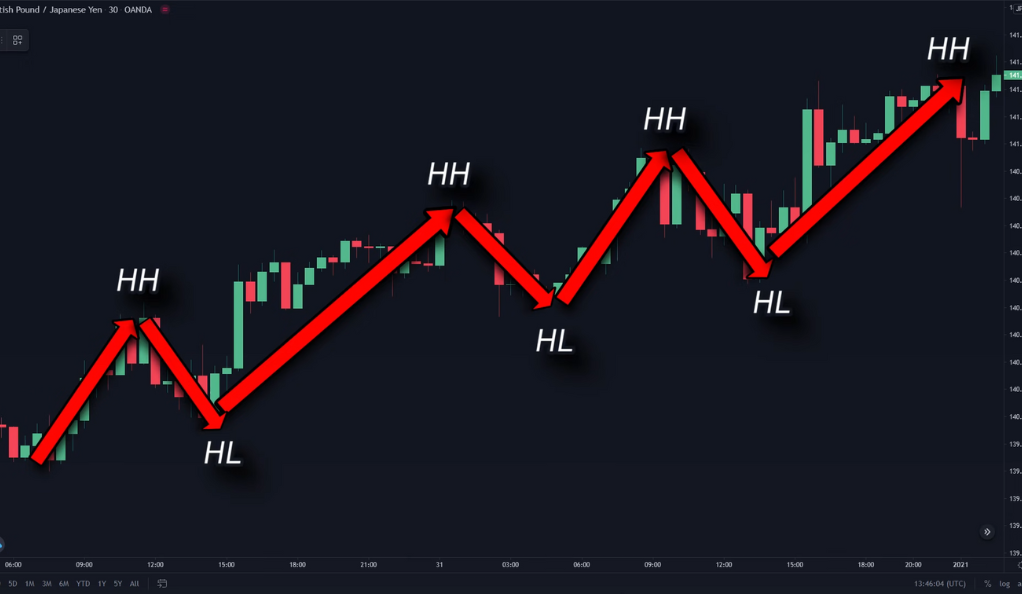
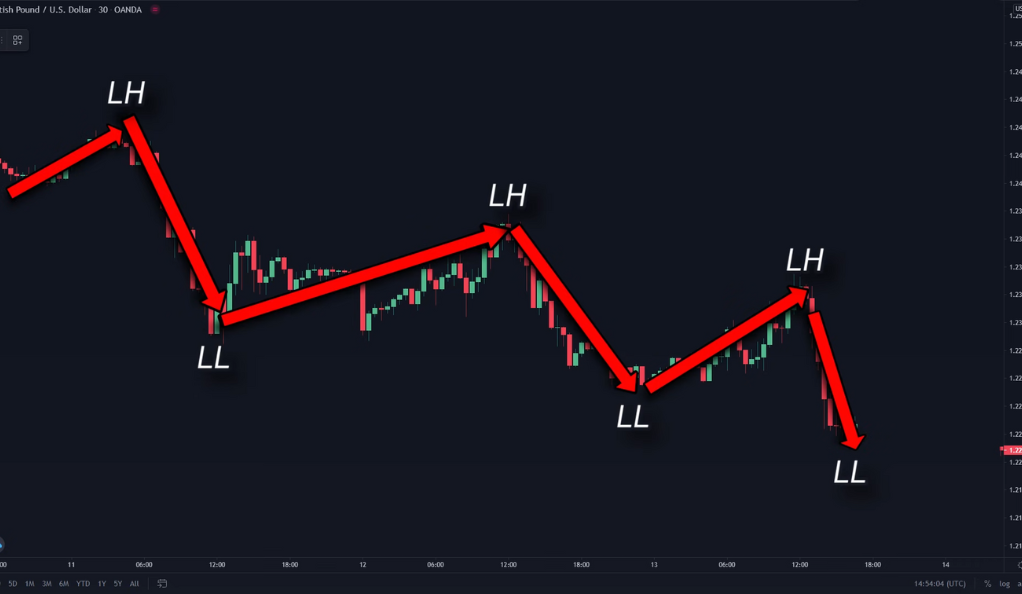
In an uptrend, where prices are generally increasing, the trend line is drawn below the price action, connecting the lowest points or “troughs”. This line acts as a sort of support level, with prices often bouncing off it and continuing their upward trajectory. Conversely, in a downtrend, where prices are generally decreasing, the trend line is drawn above the price action, connecting the highest points or “peaks”. This line acts as a resistance level, with prices often bouncing off it and continuing their downward trajectory. However, it’s important to remember that while trend lines can be a helpful tool in predicting future price movements, they are not foolproof and should be used in conjunction with other technical analysis tools for the best results.
Utilizing Trend Lines
Trend lines are not just a tool for observing market trends; they can also be actively utilized in combination with other price action techniques to identify high probability trade setups. One such technique involves drawing a mini trend line at the pullback to confirm a continuation pattern. A pullback refers to a temporary reversal of the prevailing price trend, and it’s at this point that a mini trend line can be drawn. This line can help traders identify the point at which the price is likely to resume its original trend, providing an opportunity for a profitable trade.
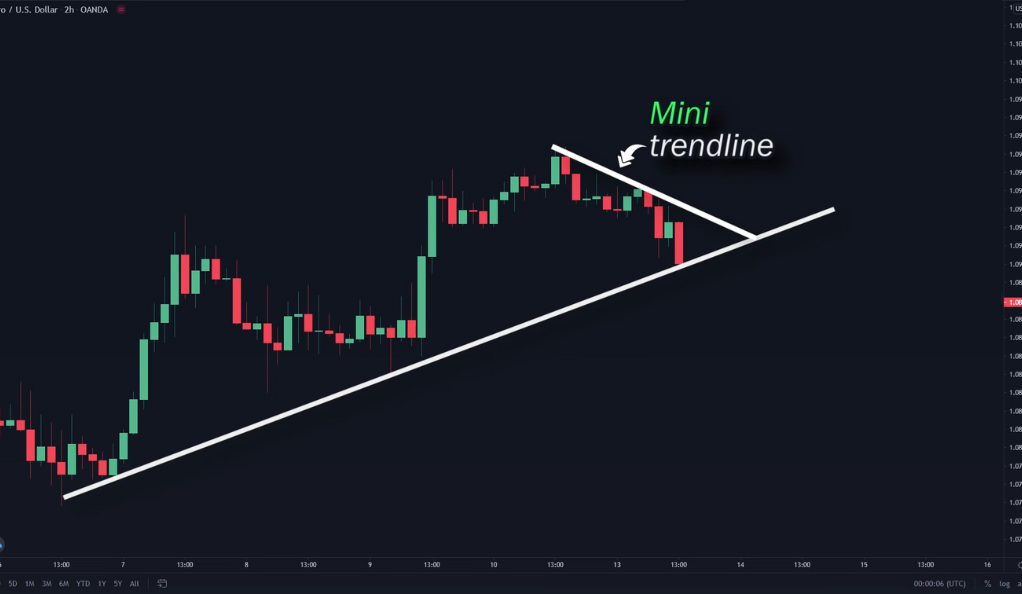
In addition to this, traders can also use various indicators to further confirm a continuation pattern. One such indicator is stochastics, a momentum indicator that compares a particular closing price of a security to a range of its prices over a certain period of time. By waiting for the price to break out of the mini trend line and for the stochastics indicator to signal a continuation of the trend, traders can increase their confidence in the trade setup. This combination of trend lines, mini trend lines, and indicators like stochastics can provide a robust framework for identifying high probability trade setups.
Confirming a Breakout Pattern
Confirming a breakout pattern is a critical aspect of trading that requires meticulous analysis and a keen understanding of market dynamics. A breakout pattern is a price movement that surpasses an identified level of support or resistance, often accompanied by increased volume. However, before a breakout occurs, there are often signs of momentum loss. This could manifest as a slowdown in the rate of price increase or decrease, or a decrease in trading volume. These signs can indicate that the current trend is losing strength and a breakout may be imminent.
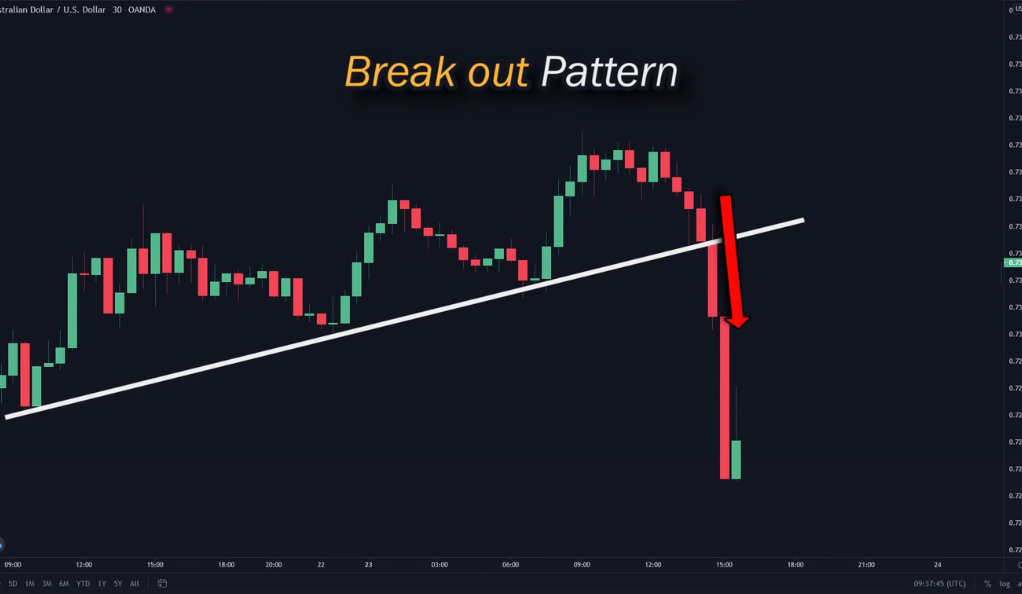
One way to confirm a breakout pattern is by using the Relative Strength Index (RSI), a momentum oscillator that measures the speed and change of price movements. The RSI oscillates between zero and 100 and is typically used to identify overbought or oversold conditions in a market. When it comes to confirming a breakout pattern, the rule of thumb is to only take buy positions if the RSI is above the 50 line and only take sell positions if the RSI is below the 50 line.
Conclusion
In the world of trading, trend lines stand as a potent tool that can significantly enhance a trader’s decision-making process. They serve as a visual guide, helping to identify market trends and providing insights into potential future price movements. By understanding where the market has been, traders can make educated predictions about where it might go next. This ability to anticipate market movements can lead to high probability trade setups, offering traders the opportunity to maximize their profits.
However, it’s crucial to remember that while trend lines are powerful, they are not standalone tools. They are most effective when used in conjunction with other indicators and techniques. This holistic approach to market analysis can help to mitigate risk and increase the likelihood of successful trades. So, the next time you find yourself analyzing a price chart, remember to draw your trend lines. But also remember to consider other factors and indicators. In doing so, you’ll be harnessing the full power of technical analysis, setting yourself up for success in your trading endeavors.
Ainu Token aims to offer impartial and trustworthy information on cryptocurrency, finance, trading, and shares. However, we don't provide financial advice and recommend users to conduct their own studies and thorough checks.
Comments (No)