In the thrilling world of cryptocurrency trading, strategies are as diverse as the traders who employ them. Amidst this diversity, one strategy has recently been making waves due to its bold promise of an impressive win rate of 80% and a profit of 845%. Intrigued? Let’s embark on a deep dive into this fascinating strategy, dissecting its components, and understanding its potential.
The Tools of the Trade
The strategy hinges on the use of three free Tradingview Indicators, each playing a crucial role in the decision-making process:
UT Bot Alerts
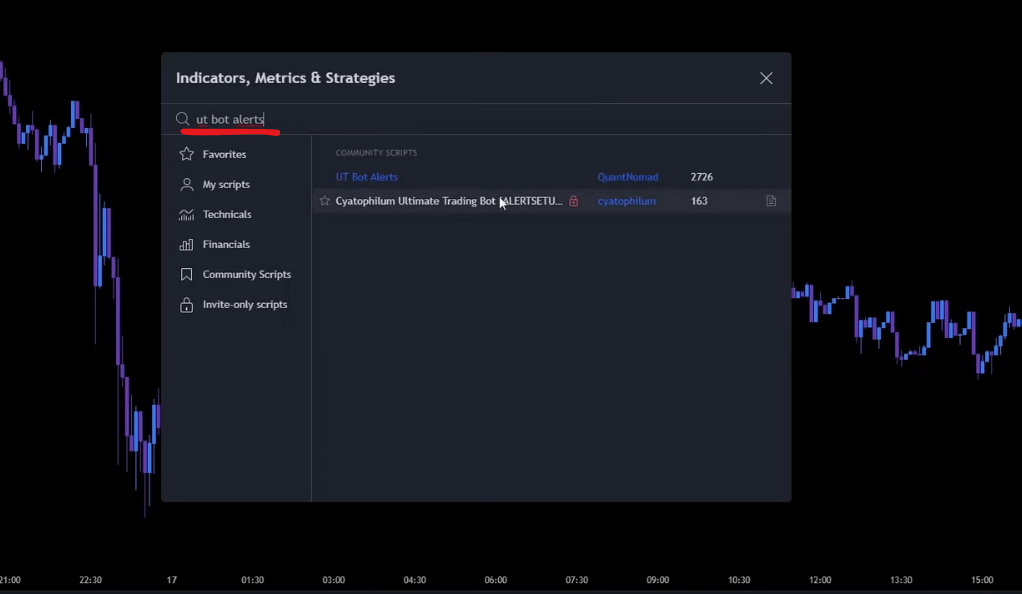
The first tool in our arsenal is the UT Bot Alerts. This indicator is designed to provide real-time buy and sell signals based on the prevailing market trends. It uses complex algorithms to analyze price action and volatility, providing traders with timely alerts to potentially profitable trading opportunities.
The UT Bot Alerts indicator acts as a guide for traders to make informed decisions. It helps traders identify the optimal times to enter or exit trades, reducing the guesswork and emotion that often come with trading. By providing real-time signals, this tool allows traders to react quickly to market changes, a crucial aspect in the fast-paced world of cryptocurrency trading.
EMA (Exponential Moving Average)
We have the Exponential Moving Average (EMA), a widely-used tool found under the Technicals Section on Tradingview. The EMA is a type of moving average that gives more weight to the most recent data. This makes it faster to respond to price changes compared to simple moving averages, making it a valuable tool in volatile markets like cryptocurrencies.
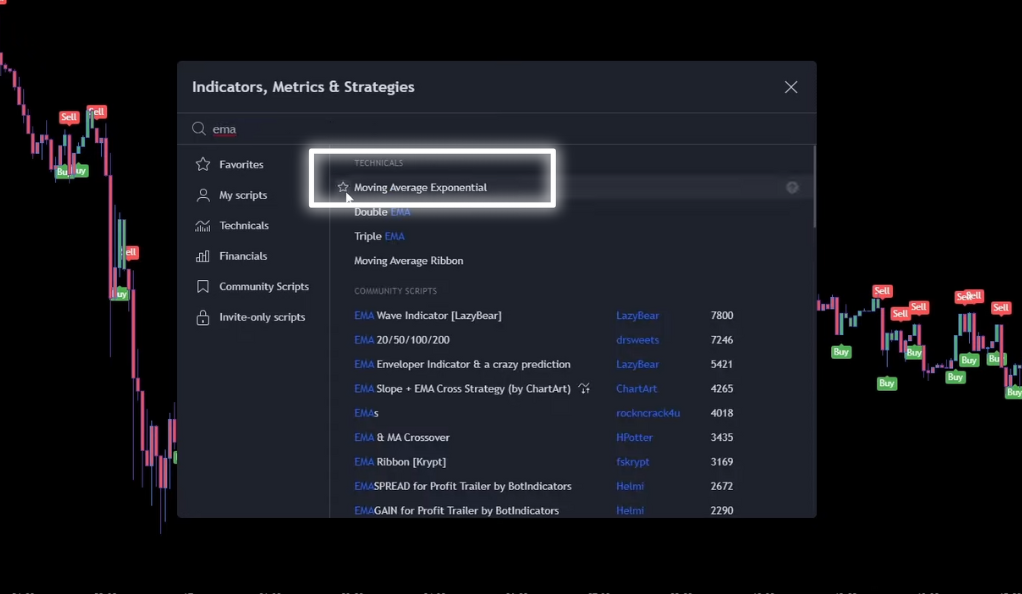
The EMA helps traders identify market trends, providing a smoothed line that can make it easier to spot the direction of the trend. By giving more weight to recent data, the EMA can help traders identify potential trend reversals earlier than other types of moving averages. This can provide traders with a valuable edge, allowing them to potentially profit from changes in trend direction.
Smart Money Concept (Expo)
The final tool in our toolkit is the Smart Money Concept (Expo). This tool is designed to help traders identify overbought and oversold market conditions, which can signal potential opportunities for buying or selling.
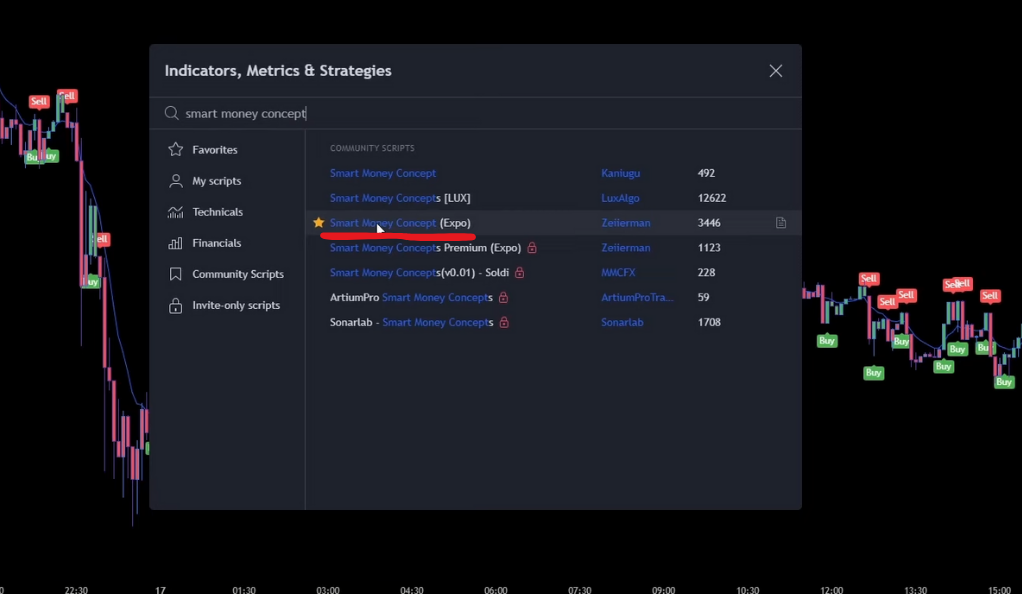
The Smart Money Concept uses a combination of price action and volume data to identify periods when the market may be overextended. When the market is overbought, it may be due for a pullback or reversal, presenting a potential selling opportunity. Conversely, when the market is oversold, it may be due for a bounce or reversal, presenting a potential buying opportunity.
By identifying these overbought and oversold conditions, the Smart Money Concept can help traders time their trades more effectively, potentially improving their profitability and reducing their risk.
Customizing the Indicators
To extract the maximum potential from these indicators, customization is essential. For the UT Bot Alerts, the Key Value Sensitivity should be adjusted from 1 to 2, and the ATR Period should be changed from 10 to 1. This will enhance the indicator’s responsiveness to market changes. For the EMA, the Length should be changed from 9 to 200, providing a broader view of market trends. For the Smart Money Concept, the overbought and oversold levels should be made more visible, enabling traders to spot potential trading opportunities more easily.
Entering a Long Position: The Rules
The strategy lays out specific rules for entering a long position, which are as follows:
Price Action
The first rule for entering a long position is related to price action. The price action must close above the 200-EMA-Line. The EMA, or Exponential Moving Average, is a type of moving average that gives more weight to recent data. When the price action closes above the 200-EMA-Line, it indicates a bullish trend.
A bullish trend suggests that the majority of traders in the market are buying, which can drive the price up. This is a potential opportunity for a long position, as the trader can buy the asset at a lower price and sell it at a higher price later. However, it’s important to note that trends can reverse, and traders should always use stop losses to manage their risk.
Buy Signal
The second rule involves the UT Bot Alerts Indicator. A new buy signal must be printed by this indicator, with the candle closing below the middle level of the Smart Money Concept indicator. This suggests that the asset is potentially undervalued, presenting a buying opportunity.
The UT Bot Alerts Indicator uses complex algorithms to analyze price action and volatility, providing real-time buy and sell signals. When a new buy signal is printed, it suggests that the market conditions may be favorable for buying. The Smart Money Concept indicator, helps identify overbought and oversold conditions. When the candle closes below the middle level of this indicator, it suggests that the asset may be oversold, or undervalued, further supporting the decision to enter a long position.
Recent Label
The third rule involves the most recent label, which must be a higher high or a higher low. This indicates an upward trend, further supporting the decision to enter a long position.
In technical analysis, a higher high is a peak that is higher than the previous peak, while a higher low is a trough that is higher than the previous trough. When the most recent label is a higher high or a higher low, it suggests that the market is making progress upwards, which is a characteristic of an upward trend. This can provide further confirmation that the market conditions are favorable for entering a long position.
Entering a Short Position: The Flip Side
The rules for entering a short position are the mirror image of those for a long position. The price action must close below the 200-EMA, indicating a bearish trend. A new sell signal must be printed by the UT Bot Alerts Indicator, with the candle closing above the middle level of the Smart Money Concept indicator, suggesting the asset is potentially overvalued. The most recent label must be a lower high or a lower low, indicating a downward trend.
Understanding Buy Stop and Buy Limit
Buy Stop Order
A buy stop order is an order to buy a security once it reaches a specific price, known as the stop price. This price is set above the current market price. Once the market reaches the stop price, the buy stop order is converted into a market order, and the security is bought at the best available price.
Buy stop orders are typically used when a trader anticipates that the price of a security will rise. If the price breaks through a resistance level (a price level above the current price that the security has had difficulty surpassing), it could indicate that the upward trend will continue, and the trader may want to buy the security to profit from the anticipated price increase.
Buy Limit Order
A buy limit order, on the other hand, is an order to buy a security at or below a specific price. This price is set below the current market price. The order will only be executed if the market price falls to the limit price or lower. If the market price does not reach the limit price, the order will not be executed.
Buy limit orders are typically used when a trader believes that the price of a security will fall before it rises. If the price is in a downward trend but the trader believes it will reverse and start an upward trend, they may set a buy limit order at a price below the current price. This allows the trader to buy the security at a lower price and potentially profit from the anticipated price increase.
Sell Stop and Sell Limit Orders
The opposite applies when entering a short position with sell stop and sell limit orders. A sell stop order is set below the current market price and is used when the trader anticipates the price will continue to fall. A sell limit order is set above the current market price and is used when the trader believes the price will rise before it falls.
Backtesting: The Proof in the Pudding
This strategy underwent a rigorous backtesting process 100 times, starting with an initial balance of 1000 USD and a risk level of 1% per trade. The outcome of the backtesting demonstrated a win rate of 59% and a profit of 57.6%. Consequently, the account balance experienced growth, escalating from 1000 USD to 1576 USD after 100 trades.
Conclusion
In the world of trading, there’s no such thing as a sure bet. However, this strategy, with its impressive win rate and profit margin, certainly seems worth exploring. Remember, though, that while the strategy’s potential is exciting, it’s essential to approach it with a healthy dose of skepticism and a thorough understanding of the risks involved.
Ainu Token aims to offer impartial and trustworthy information on cryptocurrency, finance, trading, and shares. However, we don't provide financial advice and recommend users to conduct their own studies and thorough checks.


Comments (No)