In the world of trading, having a solid strategy is crucial for success, and one strategy that has been gaining popularity is the “5M + 15M Trading Strategy: Papillon System With The Best Trading Filters And Maximum Limit.” This strategy incorporates a combination of four indicators, providing traders with a powerful tool to make informed decisions.
The strategy’s name, “Papillon System,” signifies its agility and versatility in capturing trading opportunities. It utilizes two timeframes, namely the 5-minute (5M) and 15-minute (15M) charts, allowing traders to capture both short-term and medium-term trends. By analyzing price action and applying various technical indicators, such as moving averages, oscillators, or trend lines, the strategy aims to identify potential entry and exit points with high accuracy.
To enhance the effectiveness of the strategy, it incorporates the best trading filters available in the market. These filters act as additional criteria to validate potential trades, reducing the likelihood of false signals and increasing the probability of successful trades. By setting a maximum limit on the number of trades, the strategy helps traders maintain discipline and avoid overtrading, which can lead to unnecessary risks.
Understanding the Indicators
The Papillon System incorporates four key indicators that work together to generate accurate trading signals. The first indicator is the Poki buy and sell take profit and stop loss by Rafael zioni. This indicator helps traders determine optimal entry and exit points by providing specific levels for taking profit and setting stop-loss orders. It assists in managing risk and maximizing potential profits.
The Papillon System combines the Supertrend, EMA (Exponential Moving Average), and CCI (Commodity Channel Index) indicators. Supertrend identifies trend direction and provides buy/sell signals based on price and volatility. EMA calculates the average price, emphasizing recent data, for support/resistance levels and buy/sell signals. CCI measures price relative to its average, indicating overbought/oversold conditions and potential reversals. By combining these indicators, the Papillon System offers traders a comprehensive market analysis and accurate signals, enabling informed decision-making and increasing success potential.
The Poki Indicator
The Poki indicator is a distinctive tool within the Papillon System that plays a vital role in providing buy and sell signals. As an integral component of this trading strategy, the Poki indicator assists traders in determining the optimal timing for entering and exiting trades. By utilizing specific criteria, the indicator generates signals that indicate when to buy an asset and when to sell it, helping traders make informed decisions and maximize their potential profits.
The Poki indicator’s ability to provide accurate buy and sell signals is a key factor in the success of the Papillon System. Traders rely on these signals to identify potential entry points for buying assets and exit points for selling them. By following the signals generated by the Poki indicator, traders can enhance their trading strategies, effectively manage risk, and increase the likelihood of successful trades.
The Supertrend
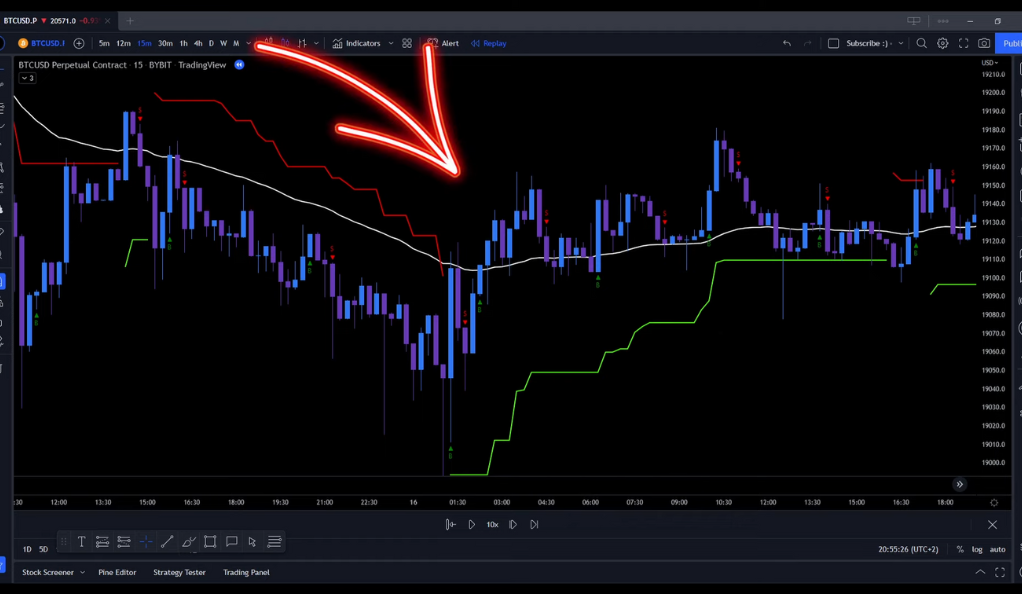
The Supertrend indicator is a valuable tool that assists in determining the prevailing trend in the market. As its name implies, it provides insight into whether the market is in an uptrend or a downtrend. The Supertrend indicator is color-coded, with green typically representing an uptrend and red indicating a downtrend. This visual representation helps traders quickly identify the direction of the market and make informed decisions based on the identified trend.
By using the Supertrend indicator, traders can gain a deeper understanding of market dynamics and adjust their trading strategies accordingly. When the indicator shows a green color, it suggests that the market is experiencing an uptrend, indicating a potential opportunity for buying assets. Conversely, a red color indicates a downtrend, signaling a potential opportunity for selling assets or adopting short positions. Traders can leverage the Supertrend indicator’s color-coded signals to align their trading decisions with the overall trend, enhancing their chances of success in the market.
The Exponential Moving Average (EMA)
The Exponential Moving Average (EMA) is a moving average variant that assigns greater significance to recent data points. It calculates the average price of an asset over a specific period, with more weight given to the most recent data. In the context of the Papillon System, a 50-period EMA is employed to identify potential support and resistance levels in the market.
By using the 50-period EMA, traders can gain insights into the price behavior of an asset and identify key levels where buying or selling pressure may come into play. The EMA helps smooth out short-term fluctuations in price and provides a clearer picture of the overall trend. As the EMA places more emphasis on recent data, it is particularly useful for traders looking to capture current market dynamics. By monitoring the interactions between price and the 50-period EMA, traders can identify potential support levels where buying interest may emerge or resistance levels where selling pressure could intensify. This information assists traders in making informed decisions regarding entry or exit points, optimizing their trading strategies within the Papillon System.
The Commodity Channel Index (CCI)
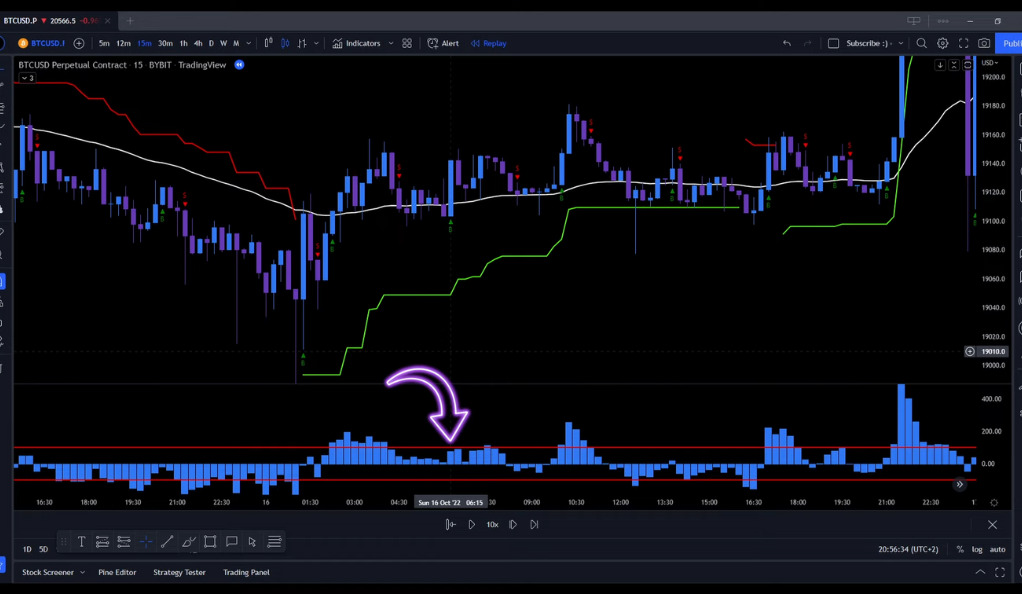
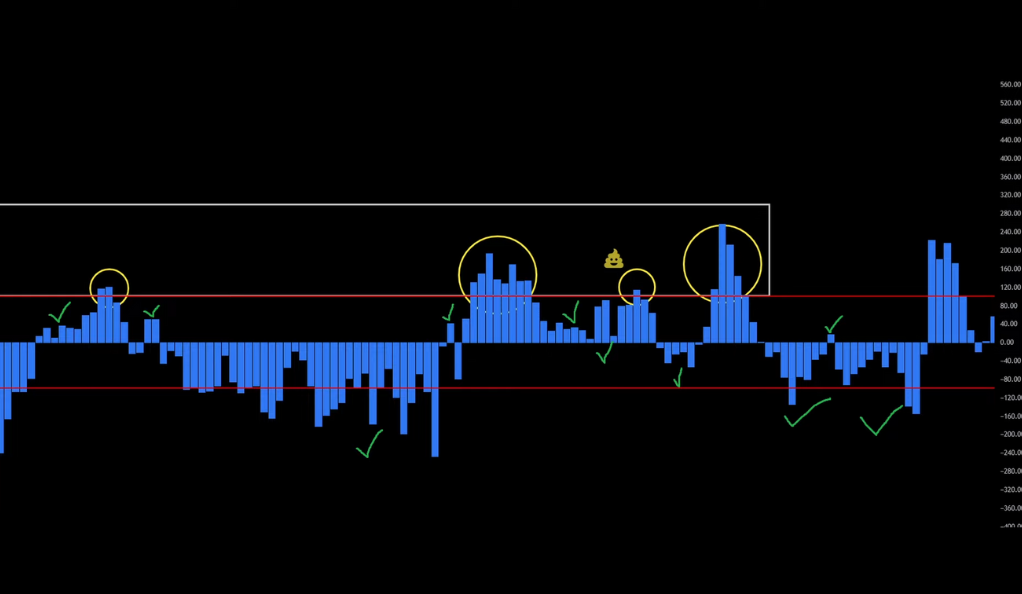
The Commodity Channel Index (CCI) is a popular momentum-based oscillator employed to identify overbought and oversold conditions in an investment vehicle. It plays a significant role in the Papillon System as it helps filter out false signals and provides valuable insights into market conditions.
By utilizing the CCI, traders can assess the relative strength or weakness of an asset’s price movement. The CCI measures the current price level in relation to its average over a specified period, typically using a mathematical formula. When the CCI indicates that an asset is overbought, it suggests that the price has risen too quickly and may be due for a potential reversal or correction. Conversely, when the CCI indicates that an asset is oversold, it suggests that the price has declined excessively and may present an opportunity for a potential rebound.
Choosing the Right Timeframe
The Papillon System is tailored to the 15-minute timeframe, making it particularly suitable for day traders aiming to capitalize on swift price fluctuations and generate profits within a short period. This timeframe aligns with the dynamic nature of day trading, where traders aim to exploit small price movements and execute multiple trades throughout the day.
The 15-minute timeframe provides traders with a balance between capturing meaningful market movements and avoiding excessive noise or volatility. It allows for a more focused analysis of price action and the application of indicators within a concise timeframe. Day traders using the Papillon System on the 15-minute chart can quickly identify potential entry and exit points, manage risk effectively, and capitalize on short-term trends.
Deciphering the Entry Rules
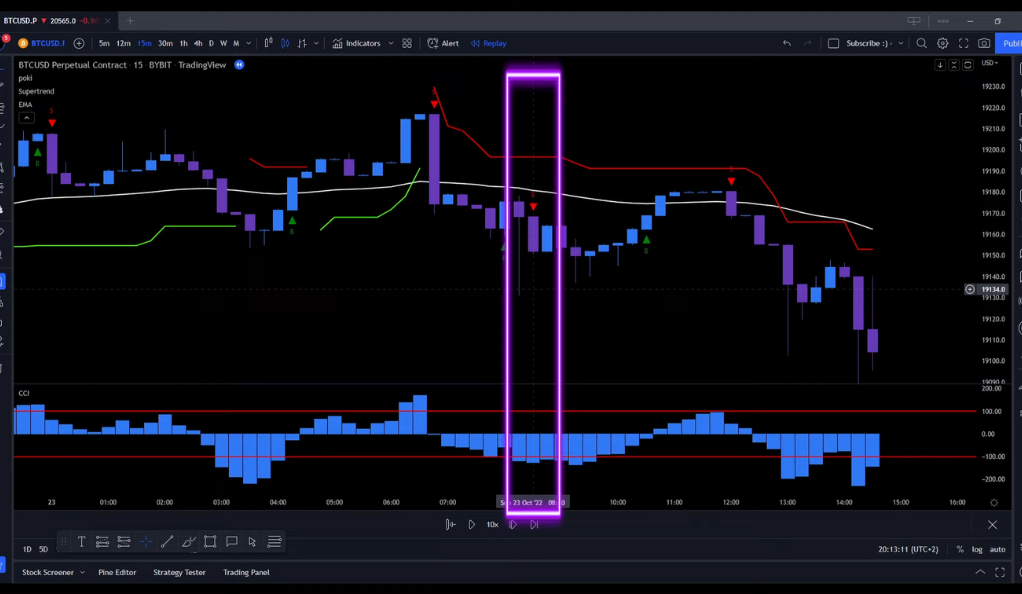
The entry rules for the Papillon System are clear and concise. When initiating a long position, traders must ensure that five specific conditions are met. Firstly, the Supertrend indicator should display a green color, indicating an uptrend. Secondly, a buy signal should be generated by the Poki indicator, providing confirmation for entering the trade. Additionally, the signal candle must close above the white 50-period EMA line, indicating potential support. Moreover, the signal candle should be positioned above the green Supertrend line, reinforcing the bullish sentiment. Lastly, it is important to verify that the CCI candle is not in the overbought area, indicating that the asset is not excessively priced.
Conversely, when considering short positions, traders must follow similar conditions but in a reversed manner. The Supertrend indicator should display a red color, indicating a downtrend. The Poki indicator should generate a sell signal, confirming the decision to enter the trade. The signal candle should close below the white 50-period EMA line, suggesting potential resistance. Furthermore, the signal candle should be positioned below the red Supertrend line, reinforcing the bearish sentiment. Lastly, it is important to ensure that the CCI candle is not in the oversold area, indicating that the asset is not undervalued.
Setting the Stop Loss and Target
In the Papillon System, effective risk management is emphasized alongside identifying entry points. Setting appropriate stop loss levels is crucial for limiting potential losses in case the market moves against the trade. The system suggests placing the stop loss order at the nearest significant line, which could be a moving average or a Supertrend line. By doing so, traders aim to protect their capital and minimize the impact of adverse price movements.
In the Papillon System, traders are advised to set a target that provides a risk-to-reward ratio of 1 to 1.5. This ensures that the potential profit target is 1.5 times greater than the initial risk, balancing risk and reward. By following these risk management guidelines, traders can protect capital, limit losses, and maintain a disciplined approach to trading, contributing to the overall success of the Papillon strategy.
Backtesting: A Crucial Step
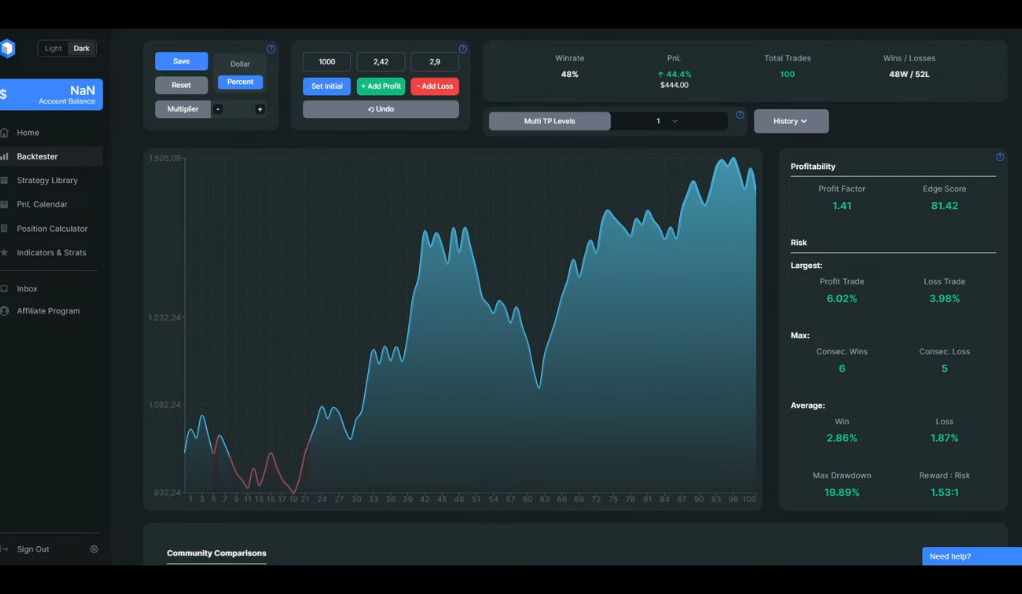
Backtesting is an essential step in evaluating the effectiveness and potential profitability of a trading strategy, and the Papillon System is no exception. To assess its performance, the Papillon System was backtested over a period of two and a half months, specifically from August 9th to October 26th, 2022. During this period, the strategy’s performance was analyzed using historical market data.
The backtesting results for the Papillon System were promising. It achieved a win rate of 48%, indicating that nearly half of the trades taken using the strategy resulted in profitable outcomes. Additionally, the profit and loss (PnL) generated during the backtesting period amounted to 44.4%. These results suggest that the Papillon System has the potential to generate consistent profits when applied to the specified timeframe and conditions. However, it’s important to note that backtesting provides historical performance data and should be complemented with real-time testing and adjustments to optimize its application in live trading scenarios.
Conclusion
The “5M + 15M Trading Strategy: Papillon System With The Best Trading Filters And Maximum Limit” is a comprehensive strategy that combines four different indicators to provide accurate trading signals. While it has shown promising results in backtesting, remember that past performance is not indicative of future results. Always use proper risk management and consider your personal financial situation before implementing any trading strategy. Happy trading!
Ainu Token aims to offer impartial and trustworthy information on cryptocurrency, finance, trading, and shares. However, we don't provide financial advice and recommend users to conduct their own studies and thorough checks.
Comments (No)