Trading in consolidating or sideways markets can be a daunting task, even for seasoned traders. The unpredictability, lack of clear trends, and difficulty in identifying entry or exit points make these markets a challenging terrain. But what if there were strategies to avoid these markets and improve your trading outcomes? Let’s delve into this fascinating topic and unravel some simple and advanced techniques to help you navigate the world of trading more efficiently.
Understanding Consolidating Markets
Consolidating markets, often referred to as sideways markets, are a unique phenomenon in the trading world. They occur when the forces of supply and demand reach a near equilibrium, causing the price to move within a narrow range for an extended period. This sideways movement makes it challenging to predict future price actions, leading to increased uncertainty and risk for traders.
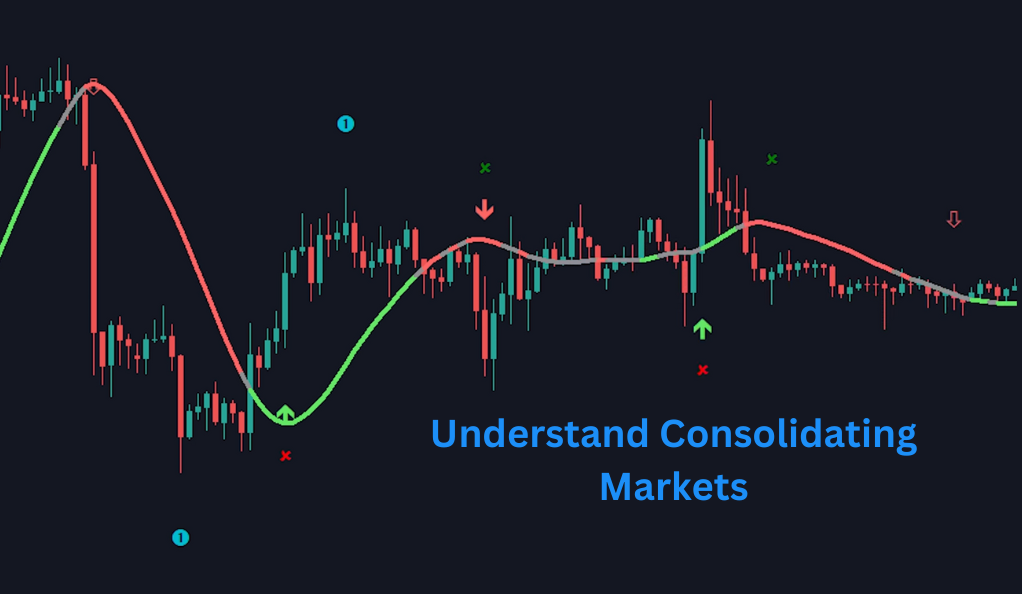
In consolidating markets, the lack of a clear trend is a significant obstacle. In trendingmarkets, traders can make educated guesses about future price movements based on the direction of the trend. However, in consolidating markets, the absence of a trend makes it difficult to predict whether the price will rise or fall. This unpredictability can lead to missed trading opportunities or, worse, significant losses.
Another challenge in consolidating markets is identifying clear entry and exit points. In trending markets, traders can use various technical analysis tools to identify potential entry and exit points. However, in consolidating markets, these tools often provide conflicting signals, making it hard to determine the best time to enter or exit a trade.
Furthermore, trading indicators, which are typically reliable in trending markets, tend to perform less accurately in consolidating markets. This is because most trading indicators are designed to identify trends, and their effectiveness decreases in the absence of a trend. As a result, traders may end up holding onto positions for too long, hoping for a trend to emerge, which can lead to unnecessary losses.
Simple Techniques to Avoid Consolidating Markets
The Power of the 200 EMA
The Exponential Moving Average (EMA) is a widely used technical analysis tool that helps traders identify potential trends in the market. The 200 EMA, in particular, is considered a significant long-term trend indicator. It calculates the average price over the past 200 periods, giving more weight to recent prices. This makes it faster to respond to price changes compared to a simple moving average.
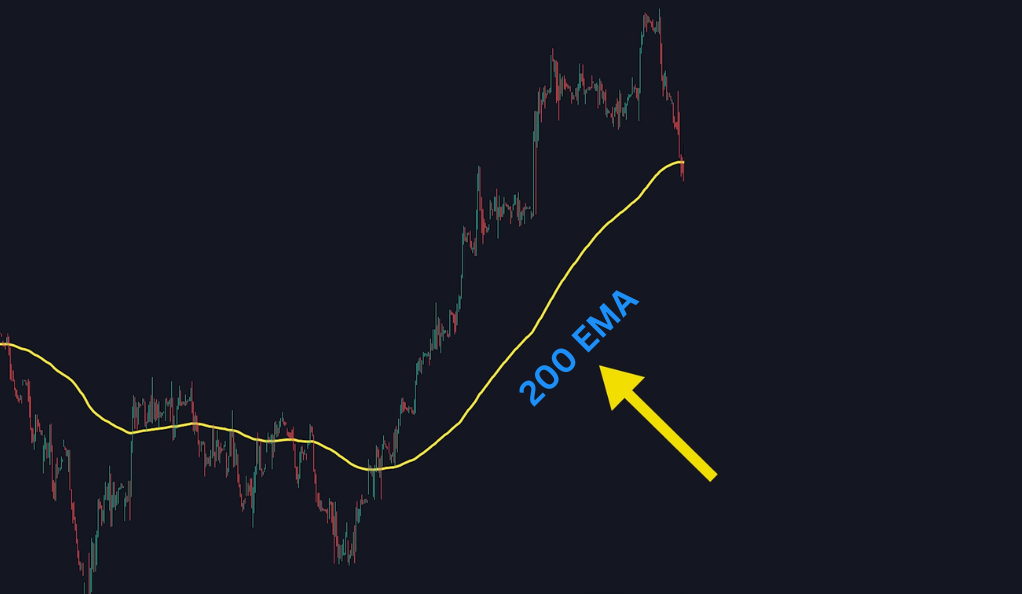
To use the 200 EMA to identify consolidating markets, you need to observe the slope of the EMA line. If the EMA line is moving sideways with only gradual movements, it’s a sign of a consolidating market. This is because the EMA line represents the average price, and a sideways EMA line indicates that the price has been moving within a narrow range.
On the other hand, if the EMA line is steep, it indicates a trending market. A steep EMA line shows that recent prices are significantly higher (in an uptrend) or lower (in a downtrend) than past prices, indicating strong buying or selling pressure.
Distance Between EMA and Price
Another simple yet effective technique to avoid consolidating markets involves observing the distance between the EMA line and the price. In a trending market, the price tends to move away from the EMA line, creating a noticeable distance between the two. This is because strong buying or selling pressure pushes the price away from the average price represented by the EMA line.
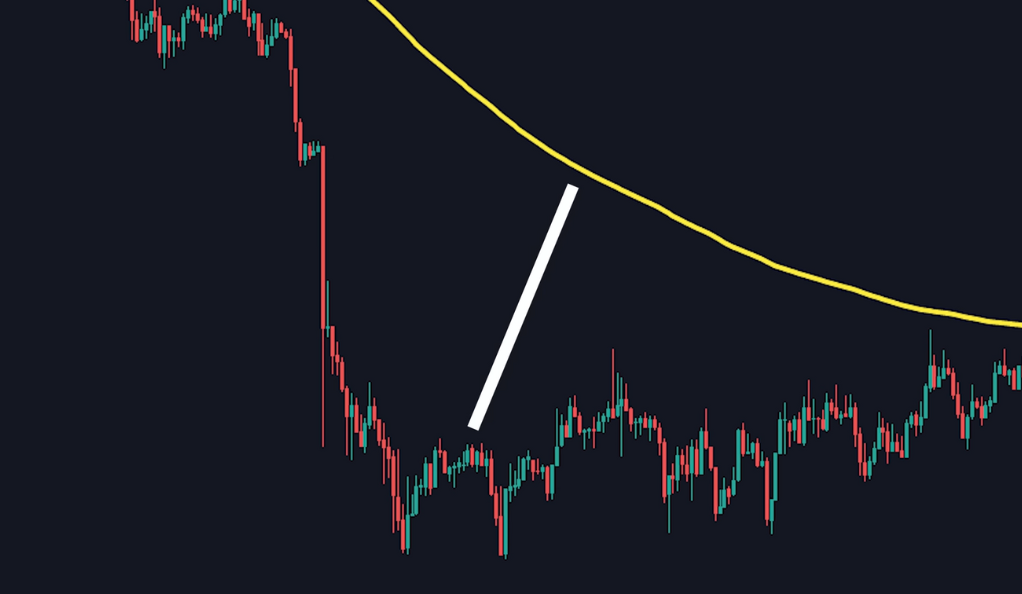
However, in a consolidating market, the price tends to stick around the EMA line, indicating a lack of strong buying or selling pressure. If you notice that the price is frequently crossing the EMA line and staying close to it, it’s a sign that the market is consolidating.
Using Support and Resistance Areas
Support and resistance areas are key levels where the price has historically faced buying or selling pressure. They are like invisible barriers that prevent the price from moving further in a particular direction. Identifying these areas can help you avoid consolidating markets.
In a consolidating market, the price tends to move between a support and resistance area for an extended period. This is because the forces of supply and demand are in balance, preventing the price from breaking out of the range. If you notice that the price is bouncing between a support and resistance area, it’s a sign that the market is consolidating.
On the other hand, in a trending market, the price tends to break through support or resistance areas and establish new ones. This is because there is strong buying or selling pressure that pushes the price beyond the existing support or resistance area. If you notice that the price has broken through a support or resistance area and is moving away from it, it’s a sign that the market is trending.
Advanced Techniques to Dodge Consolidating Markets
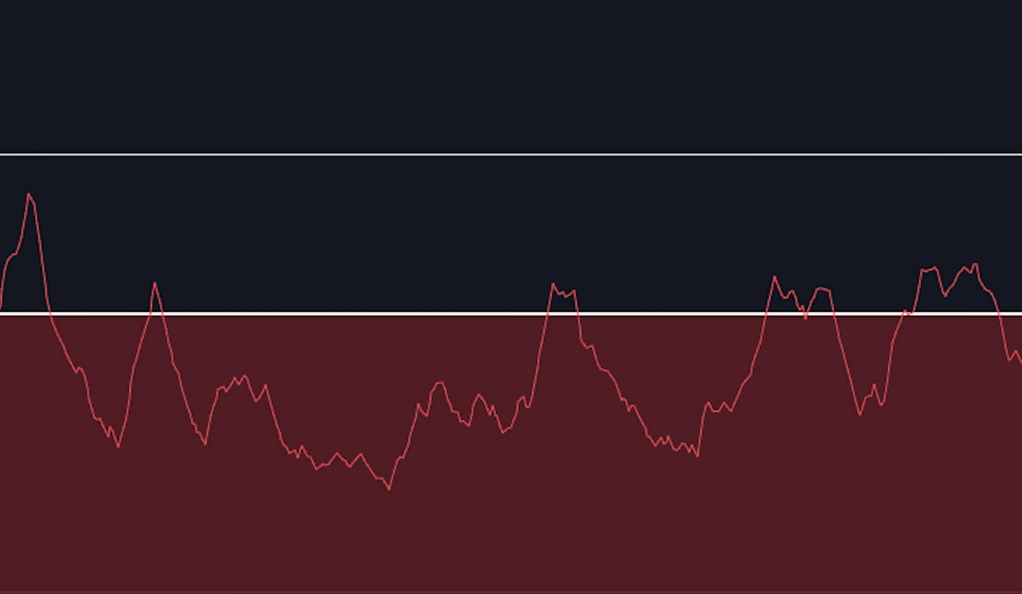
The world of trading offers a variety of advanced techniques that can help traders dodge consolidating markets. One such technique involves the use of the Average Directional Index (ADX), a technical analysis indicator that measures the strength of a trend. The ADX does not provide information about the direction of the trend, but it gives valuable insights into its strength. If the ADX value is below 25, it indicates that the market is likely consolidating, suggesting a lack of strong buying or selling pressure. However, if the ADX value is above 25, it indicates that the market is trending, suggesting strong buying or selling pressure. This information can be instrumental in deciding whether to enter or exit a trade, thereby enhancing trading outcomes.
Another advanced technique involves the use of a trend table in conjunction with a buy/sell indicator. A trend table provides a summary of the current market conditions, including information about the current trend, its strength, and whether the market is consolidating or trending. A buy/sell indicator, on the other hand, provides signals to enter or exit trades based on certain criteria. However, these signals can be less accurate in consolidating markets due to the lack of a clear trend. By using a trend table, traders can filter out these signals and only take trades when the market is trending. If the trend table indicates that the market is consolidating, traders should avoid taking any buy or sell signals from the indicator. Conversely, if the trend table indicates that the market is trending, traders can follow the buy or sell signals from the indicator. This approach can significantly increase the accuracy of trades and improve trading outcomes.
The ADX Indicator
The Average Directional Index (ADX) is a technical analysis indicator that measures the strength of a trend. It does not indicate the direction of the trend, only its strength. The ADX line ranges from 0 to 100, with higher values indicating a stronger trend.
To use the ADX to identify consolidating markets, you need to observe the value of the ADX line. If the ADX value is below 25, it indicates that the market is likely consolidating. This is because a low ADX value shows that the price is moving within a narrow range, indicating a lack of strong buying or selling pressure.
On the other hand, if the ADX value is above 25, it indicates that the market is trending. A high ADX value shows that the price is moving in a particular direction with strong buying or selling pressure.
The Trend Table and Buy/Sell Indicator
A trend table is a tool that provides a summary of the current market conditions. It can include information about the current trend, its strength, and whether the market is consolidating or trending. Using a trend table in conjunction with a buy/sell indicator can significantly improve your trading outcomes.
A buy/sell indicator provides signals to enter or exit trades based on certain criteria. However, these signals can be less accurate in consolidating markets due to the lack of a clear trend. By using a trend table, you can filter out these signals and only take trades when the market is trending.
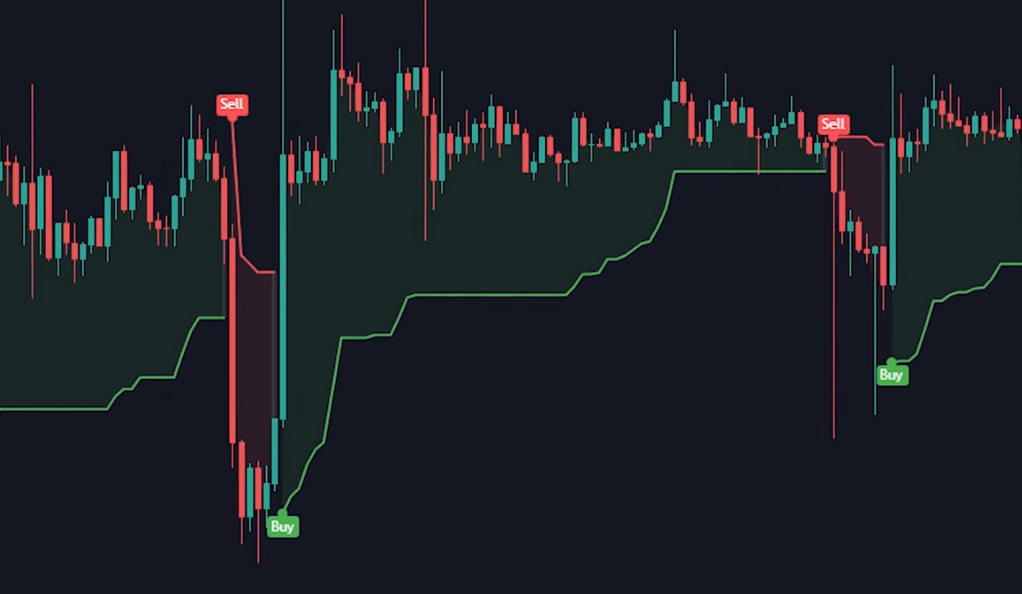
If the trend table indicates that the market is consolidating, you should avoid taking any buy or sell signals from the indicator. This is because the likelihood of false signals is higher in consolidating markets. On the other hand, if the trend table indicates that the market is trending, you can follow the buy or sell signals from the indicator. This can increase the accuracy of your trades and improve your trading outcomes.
The Role of Brokers and Indicators
Choosing the right broker and trading indicator can have a significant impact on your trading outcomes. A good broker provides a reliable trading platform, fast execution times, and competitive pricing. For example, Lightspeed is a broker that offers these features and more, making it a popular choice among active traders.
Trading indicators are tools that provide signals to enter or exit trades based on certain criteria. They can help you identify potential trading opportunities and make informed trading decisions. However, not all trading indicators are created equal. Some indicators perform better in trending markets, while others perform better in consolidating markets.One such indicator is the buy/sell indicator with a trend table. This indicator provides buy or sell signals based on certain criteria and includes a trend table that indicates whether the market is consolidating or trending. By using this indicator, you can filter out false signals in consolidating markets and improve the accuracy of your trades.
Conclusion
Trading in consolidating markets can be challenging, but with the right strategies and tools, you can navigate these markets more efficiently. By understanding the nature of consolidating markets and employing techniques to avoid them, you can significantly improve your trading outcomes.
Ainu Token aims to offer impartial and trustworthy information on cryptocurrency, finance, trading, and shares. However, we don't provide financial advice and recommend users to conduct their own studies and thorough checks.
Comments (No)