In the dynamic world of cryptocurrency trading, having a robust strategy is the key to success. This article delves into a unique Bitcoin trading strategy that combines four distinct indicators. The world of Bitcoin trading is akin to navigating a ship through a storm. The volatility of the market, the sudden shifts in price, and the constant need to stay updated with the latest trends can be overwhelming. However, with a well-crafted strategy, traders can not only survive these storms but also find profitable opportunities. This strategy, which combines the Exponential Moving Average (EMA), SSL Channel, Heat Map Volume, and ATR Stop Loss Finder, is one such beacon in the tumultuous sea of Bitcoin trading. Let’s embark on this journey to understand how these indicators work together to create a profitable trading strategy.
The Four Pillars of the Strategy
The strategy in focus is built on four indicators: Exponential Moving Average (EMA), SSL Channel, Heat Map Volume, and ATR Stop Loss Finder. Each of these plays a crucial role in the overall trading strategy. Just like a building needs a strong foundation to withstand external forces, a trading strategy needs robust indicators to navigate the volatile crypto market. These four indicators, each with its unique function, work together to provide a comprehensive view of the market, helping traders make informed decisions.
Exponential Moving Average (EMA)
The Exponential Moving Average (EMA) is a cornerstone of this Bitcoin trading strategy. It’s a type of moving average that places a greater emphasis on the most recent data points. Unlike the Simple Moving Average (SMA) that assigns equal weight to all data points, the EMA gives more importance to the latest data. This unique characteristic makes it highly responsive to recent price changes, providing traders with a more accurate reflection of the current market trends. Think of the EMA as a speedometer in your car that responds quickly to changes in speed, providing you with real-time data. In the fast-paced world of Bitcoin trading, having access to such real-time data is invaluable.
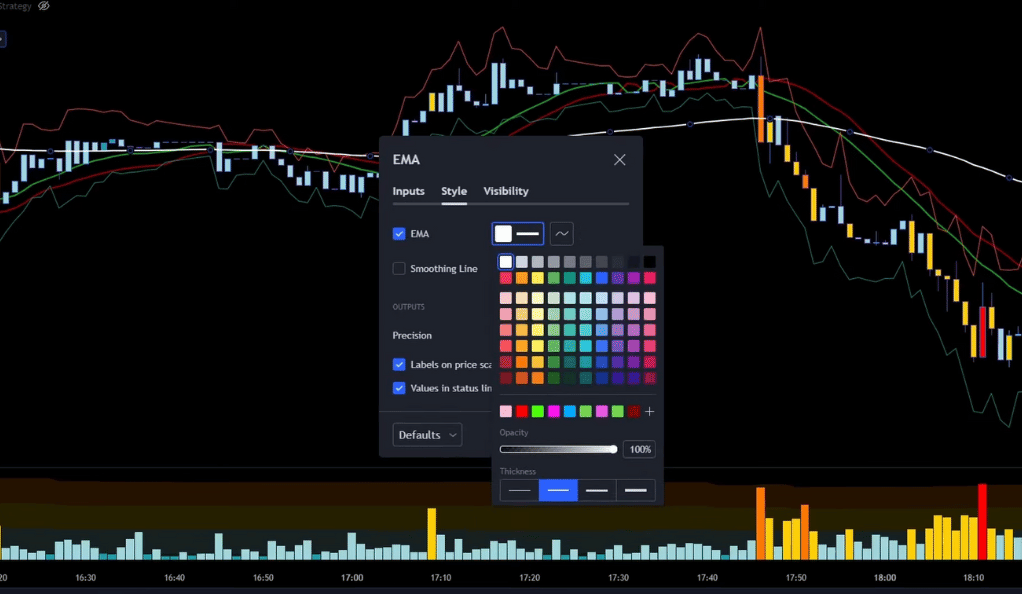
The EMA’s emphasis on recent data points allows traders to react swiftly to market changes. This is particularly crucial in the volatile world of cryptocurrency trading, where prices can fluctuate wildly within a short span. The EMA, with its real-time responsiveness, provides traders with the information they need to make timely decisions. Whether it’s deciding when to buy or sell, the EMA serves as a reliable guide, helping traders navigate the turbulent Bitcoin market. In essence, the EMA is not just a tool; it’s a trusted companion for every Bitcoin trader, providing vital insights that can potentially lead to profitable trades.
SSL Channel
The SSL Channel is another integral component of this Bitcoin trading strategy. It’s a technical indicator that helps traders identify whether they should go long (buy) or short (sell). The SSL Channel creates a channel based on High, Low, and Close prices, providing a clear visual representation of market trends. It’s a reliable tool to spot trend changes, guiding traders through the often choppy waters of the crypto market. In the vast ocean of Bitcoin trading, the SSL Channel acts as a reliable compass, pointing traders in the right direction and helping them navigate the market currents.
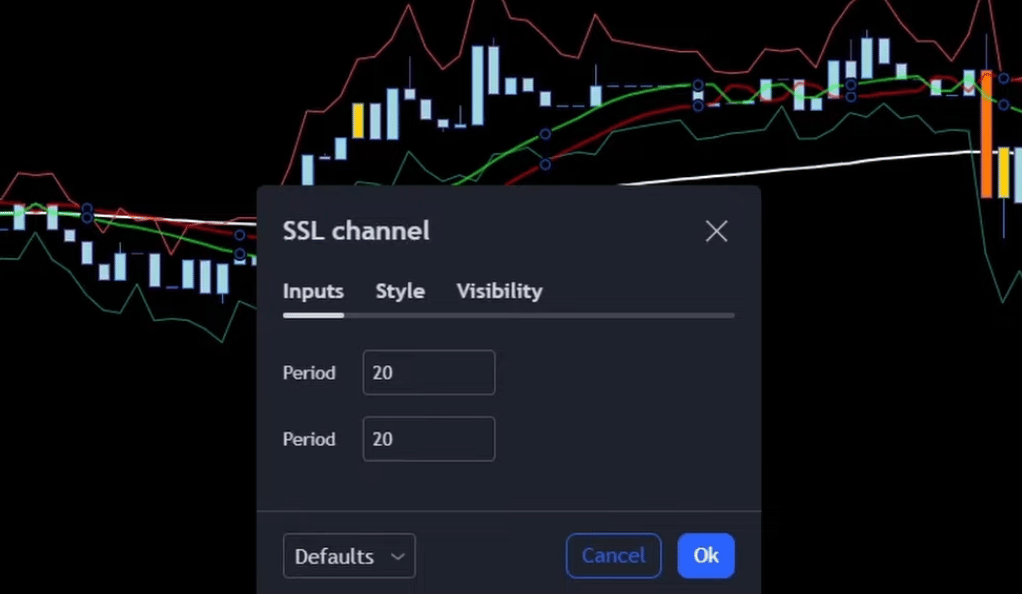
The SSL Channel’s ability to identify trend changes is particularly beneficial in the volatile world of cryptocurrency trading. Market trends can change rapidly, and being able to spot these changes early can be the difference between a profitable trade and a loss. The SSL Channel, with its clear visual cues, provides traders with this vital information, enabling them to react swiftly to market changes. Whether it’s deciding when to enter a trade or when to exit, the SSL Channel serves as a trusted guide. It’s like having a seasoned sailor on board your trading ship, someone who understands the ebb and flow of the market and can guide you towards making informed trading decisions. In essence, the SSL Channel is more than just a tool; it’s a trusted ally in the unpredictable world of Bitcoin trading.
Heat Map Volume
The Heat Map Volume is a powerful tool in this Bitcoin trading strategy. It’s a type of visualization that uses color to represent variations in the values of trading volume. By providing a color-coded representation of trading activity, the Heat Map Volume allows traders to quickly identify where the majority of trading activity is happening. It’s like a thermal camera, highlighting the hotspots in the market where the action is. In the complex world of Bitcoin trading, the Heat Map Volume acts as a visual guide, helping traders understand the market dynamics at a glance.
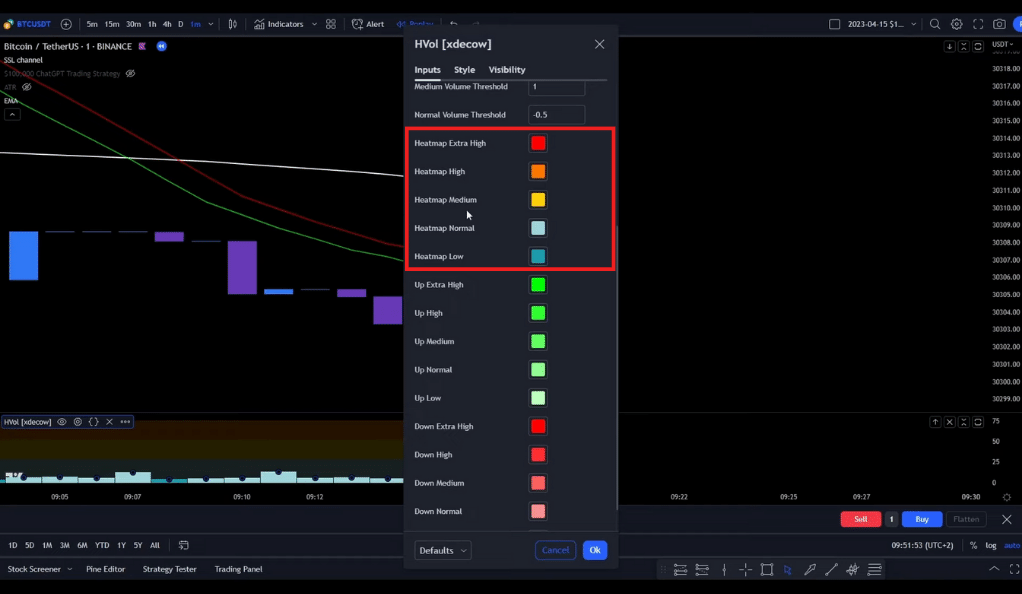
The ability to visualize trading volume is particularly beneficial in the fast-paced world of cryptocurrency trading. With prices fluctuating rapidly, being able to quickly identify areas of high trading activity can provide traders with valuable insights. The Heat Map Volume, with its color-coded visual cues, provides traders with this crucial information, enabling them to spot potential trading opportunities. Whether it’s identifying a sudden surge in trading activity or spotting a quiet market, the Heat Map Volume serves as a trusted guide. It’s like having a bird’s eye view of the market, providing you with a comprehensive picture of trading activity. In essence, the Heat Map Volume is more than just a tool; it’s a trusted companion that helps traders navigate the vibrant and volatile world of Bitcoin trading.
ATR Stop Loss Finder
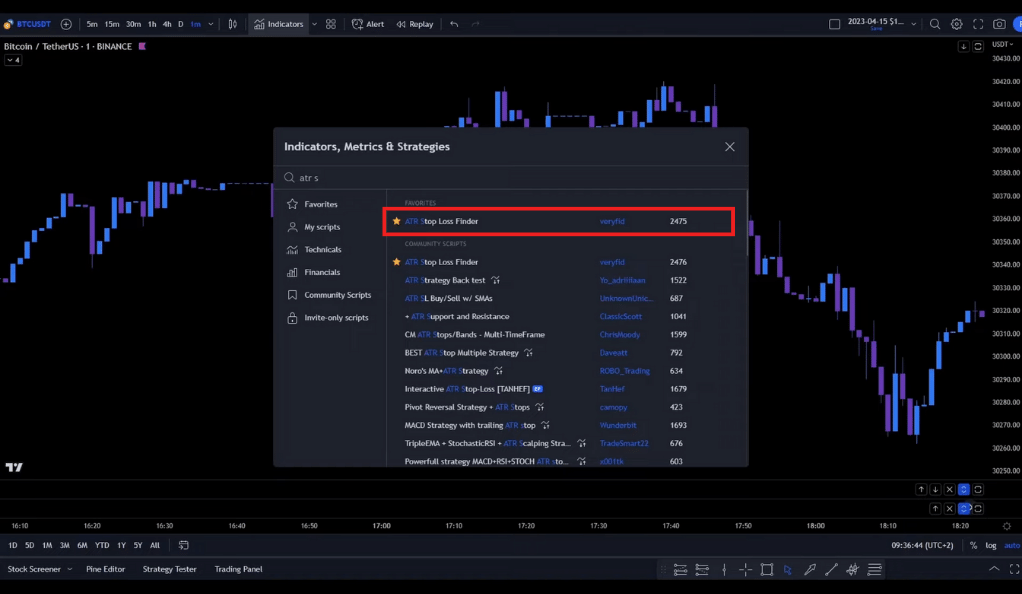
The ATR Stop Loss Finder is a crucial component of this Bitcoin trading strategy. ATR, or Average True Range, is a technical analysis volatility indicator originally developed by J. Welles Wilder, Jr. It’s primarily used to calculate stop loss levels, allowing traders to manage their risk in volatile markets. Consider it as your safety net, ready to catch you when the market takes an unexpected plunge. In the high-risk world of Bitcoin trading, the ATR Stop Loss Finder is a vital tool for risk management. By calculating stop loss levels, it helps traders limit their potential losses, thereby protecting their investments.
The ability to calculate stop loss levels is particularly beneficial in the volatile world of cryptocurrency trading. With prices fluctuating wildly, being able to limit potential losses can be the difference between a successful trader and a failed one. The ATR Stop Loss Finder, with its focus on volatility, provides traders with this crucial information, enabling them to manage their risk effectively. Whether it’s deciding when to cut losses or when to let profits run, the ATR Stop Loss Finder serves as a trusted guide. It’s like having a seasoned risk manager on your trading team, someone who understands the importance of risk management and can guide you towards making informed trading decisions. In essence, the ATR Stop Loss Finder is more than just a tool; it’s a trusted ally in the unpredictable world of Bitcoin trading.
Testing and Backtesting
The author of the strategy has rigorously tested it on different timeframes. Backtesting, or testing a strategy on prior time periods, is like a time machine. It allows traders to gauge the strategy’s effectiveness and fine-tune it based on historical data. In the world of Bitcoin trading, backtesting is a crucial step in developing a successful strategy. By testing the strategy on historical data, traders can identify potential flaws and make necessary adjustments, thereby increasing their chances of success in the future.
5-Minute Strategy Script
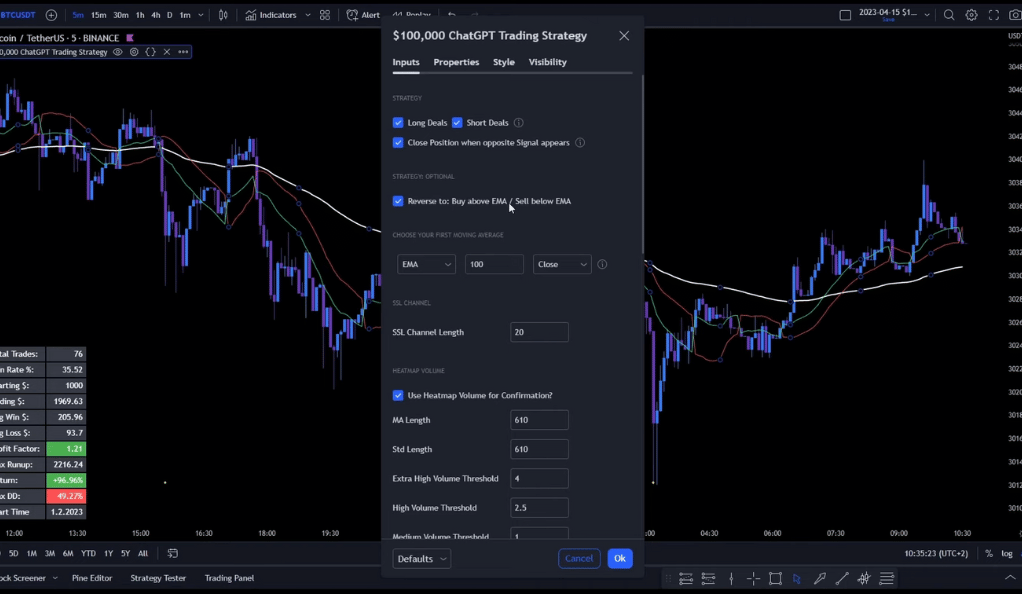
The 5-Minute Strategy Script is a unique tool designed for the fast-paced world of cryptocurrency trading. It’s a script that applies a specific trading strategy to 5-minute intervals, allowing traders to make quick decisions based on short-term market trends. This approach is particularly beneficial in the volatile world of Bitcoin trading, where prices can fluctify rapidly. The 5-Minute Strategy Script, with its focus on quick, short-term trades, provides traders with the ability to capitalize on these rapid price changes, potentially leading to profitable trades. It’s like having a rapid response team in your trading toolkit, ready to take advantage of every market movement.
Profit Factor
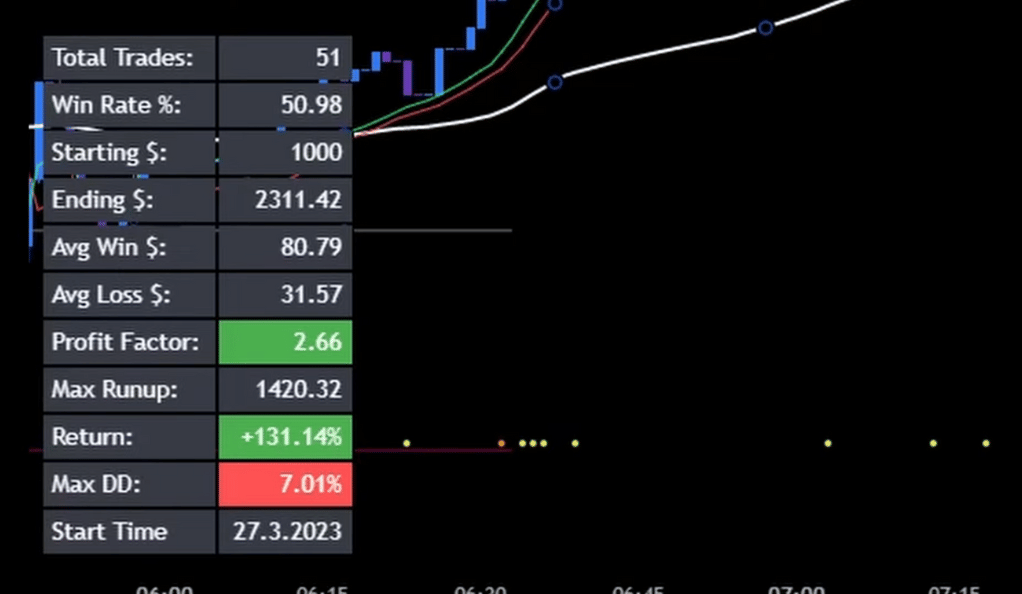
Profit Factor is a crucial metric in the world of trading. It’s a measure of the effectiveness of a trading strategy, calculated by dividing the gross profit by the gross loss. A Profit Factor greater than 1 indicates a profitable strategy, while a value less than 1 suggests a losing strategy. In the volatile world of Bitcoin trading, the Profit Factor serves as a reliable gauge of a strategy’s success. It provides traders with a clear picture of their strategy’s performance, helping them make informed decisions and refine their approach. In essence, the Profit Factor is like a report card for your trading strategy, providing a clear and concise evaluation of its profitability.
Conclusion
In conclusion, this Bitcoin trading strategy, with its unique combination of four indicators, offers a promising approach to navigating the volatile crypto market. However, the full potential of the strategy remains locked behind the private script. As the crypto world waits for the script’s unveiling, traders can experiment with these indicators and perhaps, discover their own secret recipe for success. In the world of Bitcoin trading, a good strategy can be the difference between success and failure. This strategy, with its unique combination of indicators, offers a promising approach. However, the full potential of the strategy remains to be seen. As we wait for the unveiling of the private script, traders can experiment with these indicators and perhaps, discover their own path to success.
Ainu Token aims to offer impartial and trustworthy information on cryptocurrency, finance, trading, and shares. However, we don't provide financial advice and recommend users to conduct their own studies and thorough checks.
Comments (No)