In the dynamic world of trading, having the right strategy can be the key to success. It’s not only about analyzing numbers and data; it’s also about grasping the rhythm of the market and utilizing indicators that can steer you towards profitable decisions. This comprehensive guide aims to delve into the top 5 high win rate trading strategies that have demonstrated their effectiveness in increasing the likelihood of profit. By exploring these strategies, traders can gain valuable insights and equip themselves with powerful tools to navigate the ever-changing trading landscape. So, fasten your seatbelts and get ready for an in-depth exploration of these strategies that can potentially enhance your trading outcomes.
Within this guide, we will delve into each strategy, unraveling its intricacies and exploring the underlying principles that contribute to its high win rate. By understanding the mechanics behind these proven strategies, traders can develop a comprehensive approach to decision-making and capitalize on opportunities with confidence. It is crucial to stay attentive, as we uncover the nuances and key factors that influence the success of each strategy. Remember, effective trading is a blend of strategy, analysis, and adaptability. So, let’s embark on this journey together and equip ourselves with the knowledge and skills necessary for achieving profitable results in the exciting world of trading.
Alligator Indicator: A New Approach
The Alligator Indicator has gained popularity among traders as a tool to identify trends and potential trading opportunities. However, the traditional approach of waiting for all three lines (the green, red, and blue) to cross over each other may not always yield optimal results. A more efficient strategy involves focusing on the green line crossing over the purple line. This modified approach provides an earlier entry signal, allowing traders to capitalize on emerging trends at an earlier stage.
By waiting for the green line to cross over the purple line, traders can potentially enter trades earlier and benefit from the initial momentum of a developing trend. This method aims to capture the early stages of price movement, maximizing profit potential. It is important to note that no strategy guarantees 100% success, and traders should consider other technical indicators, market conditions, and risk management techniques for comprehensive analysis. By adopting this alternative approach to the Alligator Indicator, traders can potentially enhance their timing and make more informed trading decisions in their pursuit of profitable outcomes.
The Exit Strategy
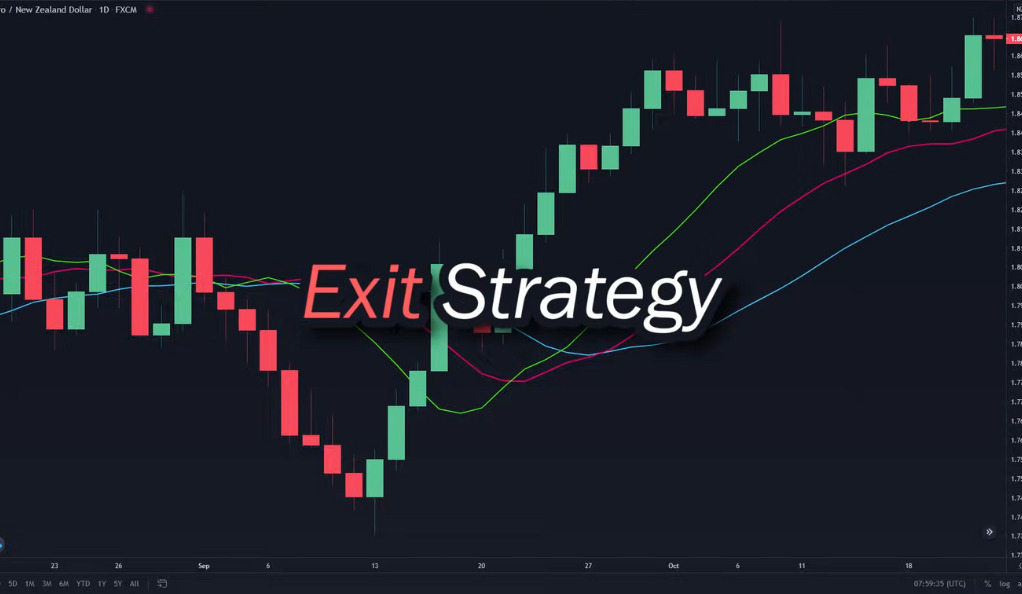
Knowing when to exit is just as crucial as knowing when to enter. With this approach, you should close your trade once a candle closes below the purple line. This strategy ensures you exit at the right time, preserving your profits and minimizing losses.
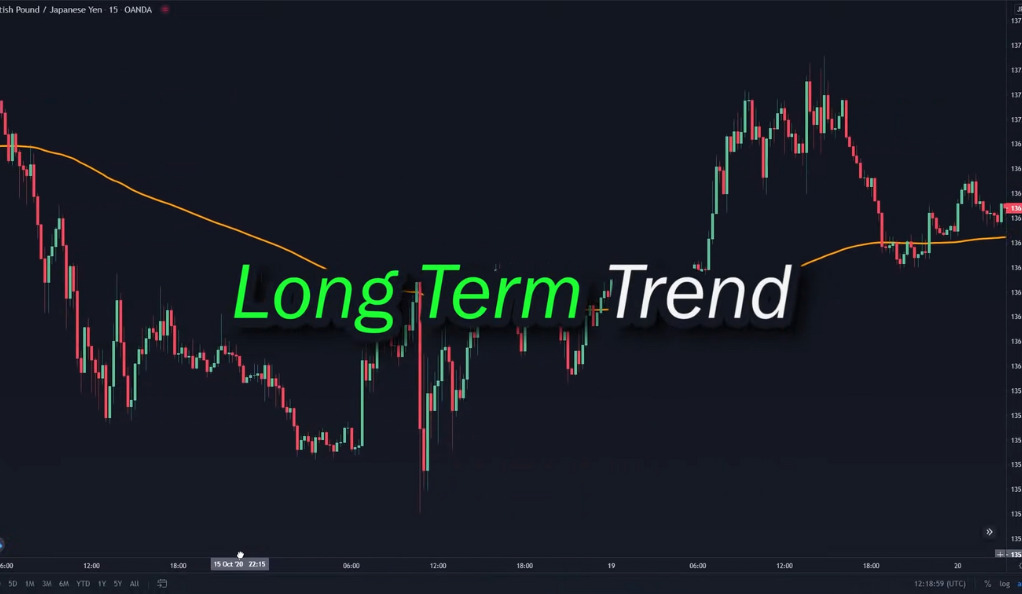
200 EMA: The Long-Term Trend Indicator
The 200 EMA (Exponential Moving Average) is a widely recognized and effective indicator for identifying the long-term trend in the market. Its simplicity and reliability make it a valuable tool for traders. However, to further enhance its performance and win rate, traders can combine the 200 EMA with other indicators. By doing so, they can potentially increase the accuracy of their trading signals and improve their overall success rate.
One popular indicator to pair with the 200 EMA is the MACD (Moving Average Convergence Divergence). The MACD can provide additional confirmation signals and help traders identify potential entry and exit points in conjunction with the 200 EMA. By combining these two indicators, traders can potentially increase their win rate from the typical range of 35-40% to approximately 45-48%. It’s important to note that while the combination of the 200 EMA and the MACD can be a powerful strategy, traders should conduct thorough analysis, consider market conditions, and practice proper risk management to optimize their trading outcomes. By utilizing the 200 EMA alongside complementary indicators, traders can harness the potential of this long-term trend indicator and make more informed decisions in their trading endeavors.
The Golden Rule
The rule of thumb with the 200 EMA is straightforward: if the price is above the 200 EMA, only take buy positions, and if the price is below the 200 EMA, only take sell positions. This rule ensures you’re always trading in line with the long-term trend.
RSI: The Versatile Indicator
The Relative Strength Index (RSI) is a highly versatile indicator that offers traders valuable insights into market dynamics. One of its primary applications is detecting overbought and oversold levels in the market. The RSI operates on a scale of 0 to 100 and measures the speed and magnitude of price movements. When the RSI value exceeds 70, it indicates that the market may be overbought, suggesting a potential reversal or pullback. Conversely, an RSI value below 30 suggests oversold conditions, indicating a possible upward price correction or trend reversal. Traders can utilize these overbought and oversold signals to make informed decisions and identify potential entry or exit points.
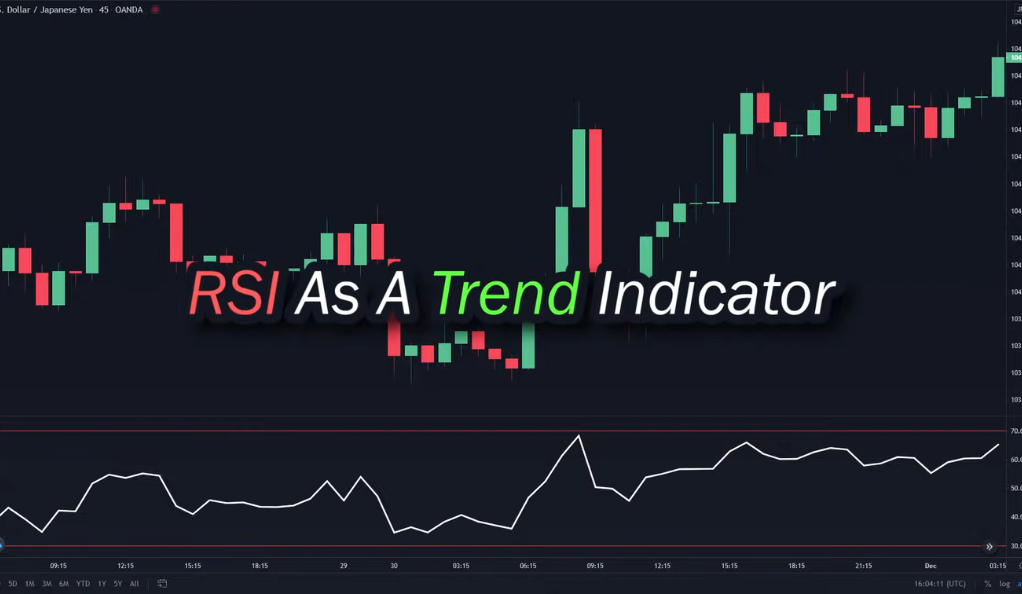
The RSI (Relative Strength Index) is a versatile indicator that not only helps identify overbought and oversold levels but also serves as a trend indicator. Traders can determine the prevailing market trend by analyzing the RSI’s position relative to a midline value of 50. An RSI reading above 50 suggests a bullish trend, while a reading below 50 indicates a bearish trend. However, it’s important to use the RSI in conjunction with other technical indicators, market conditions, and risk management techniques for a comprehensive analysis and better trading decisions.
Key Levels and Trend Indication
When using the RSI, it’s essential to wait for key levels before making a move. An oversold RSI doesn’t mean much unless the price is on a key support level. You can also adjust the RSI settings to 50 for trend indication, providing a clear signal for when to buy or sell.
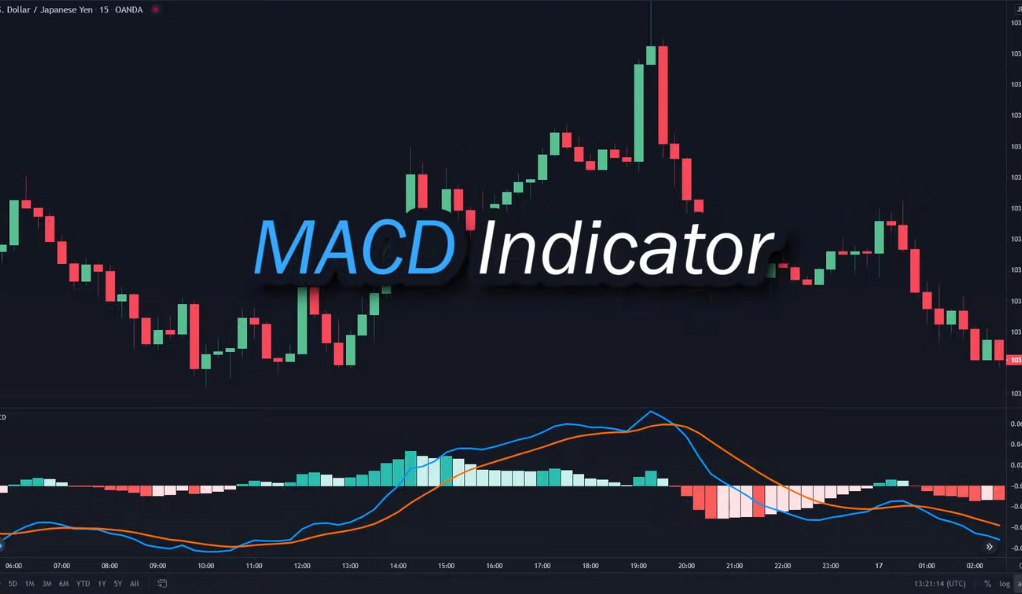
MACD: The High Win Rate Indicator
The MACD (Moving Average Convergence Divergence) is widely recognized for its high win rate and is a popular indicator among traders. One particularly effective strategy involving the MACD is the divergence strategy. Divergence occurs when the MACD line and the price move in opposite directions, signaling a potential trend reversal or continuation. Traders can capitalize on this divergence by identifying bullish or bearish divergences and taking corresponding trading positions. By incorporating the MACD divergence strategy into their trading approach, traders can potentially achieve a higher win rate and improve their overall trading outcomes.
Combining the MACD divergence strategy with the 200 EMA can enhance its effectiveness and increase the win rate. The 200 EMA helps identify the market direction, while the MACD divergence strategy identifies potential trend reversals. However, no strategy guarantees 100% success, and traders should analyze the market, consider risk management, and adapt their approach accordingly. By integrating the MACD divergence strategy with the 200 EMA, traders can potentially improve their trading outcomes.
The Simplicity of MACD
The MACD is simple to use, making it a favorite among traders. If the MACD is below the histogram and the blue line crosses above the orange line while the price is above the 200 EMA, you take a buy position. The same logic applies for short positions.
ATR: The Market Predictor
The Average True Range (ATR) is a powerful tool that serves as a market volatility predictor. It provides valuable insights into the level of price fluctuation within a given period. A low ATR indicates a relatively flat market with low volatility, suggesting smaller price movements and potentially less trading opportunity. On the other hand, a high ATR suggests greater price volatility, indicating larger and potentially more profitable trading opportunities.
The ATR (Average True Range) helps traders determine optimal levels for stop loss and take profit orders by considering market volatility. In highly volatile conditions, wider stop loss levels may be suitable, while in less volatile conditions, tighter stop loss levels may suffice. Using the ATR in conjunction with other indicators provides a comprehensive understanding of market conditions. Proper risk management techniques, such as setting stop loss and take profit levels, are crucial for consistent trading success. By leveraging the ATR to gauge market volatility, traders can optimize their strategies and improve performance.
The Power of ATR
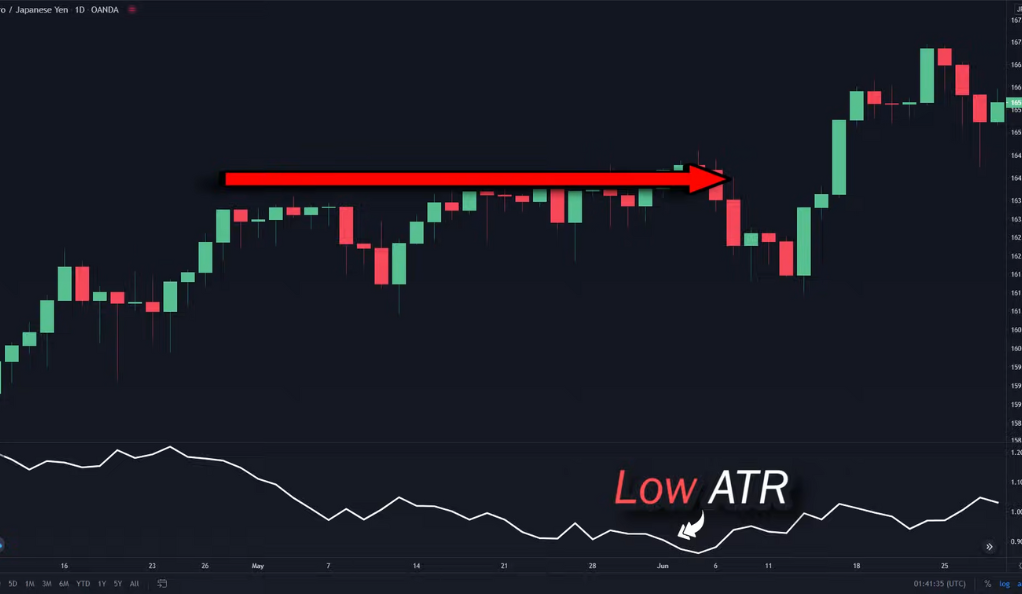
The ATR is more than just a single line; it’s a powerful tool that can predict when a price breakout is coming. By using the ATR, you can anticipate when a big price movement is about to happen and take advantage of it.
Conclusion
In the dynamic and competitive world of trading, having the right strategies at your disposal can be the key to success. The Alligator Indicator’s new approach, the long-term trend indication of the 200 EMA, the versatility of the RSI, the high win rate of the MACD, and the predictive power of the ATR are all valuable tools that traders can utilize to their advantage. Each strategy offers unique advantages and insights into market dynamics. By understanding and applying these strategies effectively, traders can significantly increase their chances of profitable trading outcomes.
It’s important to remember that the market is a complex and ever-changing entity. While these strategies provide valuable frameworks, they should not be seen as foolproof methods for guaranteed success. Successful trading requires a combination of thorough analysis, adaptability to changing market conditions, and risk management techniques. By embracing these strategies and continuously expanding your knowledge and skills, you can navigate the trading landscape with confidence and seize the opportunities that the market presents. With the right tools and strategies at hand, the vast world of trading becomes a realm of potential and possibility.
Ainu Token aims to offer impartial and trustworthy information on cryptocurrency, finance, trading, and shares. However, we don't provide financial advice and recommend users to conduct their own studies and thorough checks.
Comments (No)