In the realm of trading, where countless strategies and indicators abound, it can be challenging to find a reliable path to success. However, within this complex landscape, there exists a proven high win rate trading strategy that merges three formidable indicators: the Moving Average Convergence Divergence (MACD), Parabolic Stop and Reverse (SAR), and the 200 Exponential Moving Average (EMA). This strategy has undergone rigorous backtesting, encompassing 100 iterations on the EUR/USD 30-minute timeframe. The results have demonstrated a commendable win rate of 69%. With such promising statistics, it is worthwhile to explore the intricacies of this strategy and understand how these indicators synergistically contribute to its success.
The first component of this trading strategy is the MACD, which is renowned for its ability to identify trend reversals and generate buy/sell signals. By comparing short-term and long-term moving averages, the MACD offers insights into the market’s momentum and potential trading opportunities. The second indicator, the Parabolic SAR, aids in determining optimal entry and exit points. It dynamically adjusts its position based on the price action, thereby providing effective stop-loss and trailing stop mechanisms. Lastly, the 200 EMA acts as a crucial support/resistance level, serving as a reliable measure of long-term trend direction. It helps traders gauge the overall market sentiment and make informed decisions. By combining these indicators, traders can potentially enhance their chances of success by capitalizing on the strengths of each component and achieving a higher win rate in their trading endeavors.
Understanding the Indicators
The success of the high win rate trading strategy lies in a comprehensive understanding of the indicators involved. The first indicator, the Moving Average Convergence Divergence (MACD), consists of two lines: the MACD line and the signal line. The MACD line represents the difference between two exponential moving averages, typically the 12-day and 26-day moving averages. The signal line is a 9-day exponential moving average of the MACD line. Traders closely monitor the MACD line crossing above or below the signal line, as it generates buy and sell signals respectively. Additionally, the MACD histogram, which represents the difference between the MACD line and the signal line, offers insights into the strength of the trend. By comprehending these components, traders can effectively interpret the MACD’s signals and integrate it into their trading decisions.
The second indicator in the strategy is the Parabolic Stop and Reverse (SAR). This indicator provides valuable information regarding potential stop-loss and trailing stop levels. The SAR dots appear above or below the price, indicating potential reversal points. When the price surpasses the SAR dot, it signifies a change in the trend direction. Traders often utilize SAR in conjunction with other indicators to confirm entry and exit points. The dynamic nature of the SAR, which adjusts its position based on price action, ensures that stop-loss levels adapt to market conditions. By understanding the behavior of the SAR dots and integrating them into their trading analysis, traders can enhance risk management and optimize their trading performance.
MACD: The Momentum Detector
The Moving Average Convergence Divergence (MACD) is a widely employed trading indicator that serves as an effective momentum detector. It consists of three integral parts that work in tandem to provide valuable insights into market dynamics.
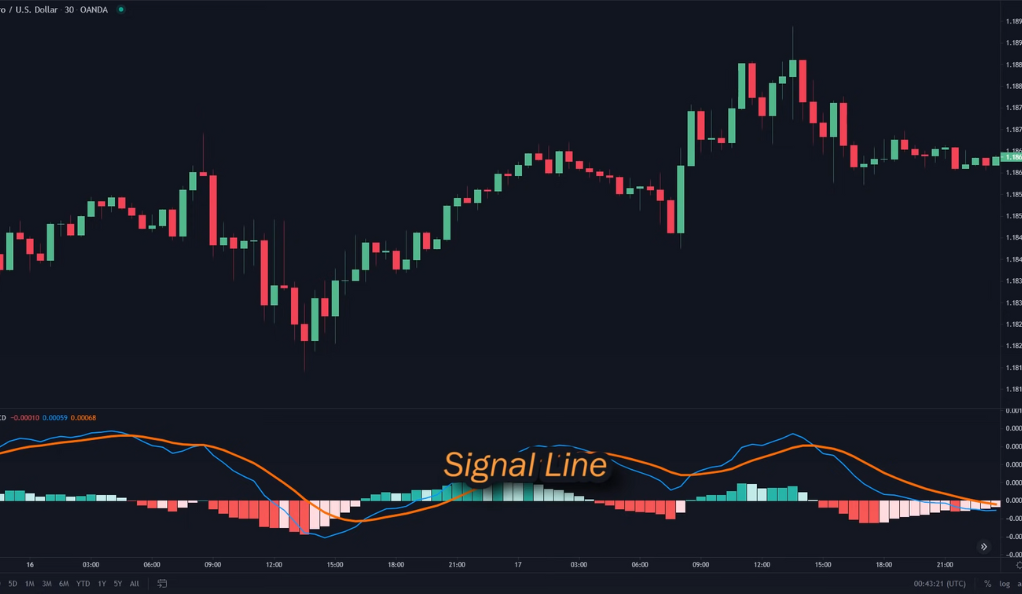
Firstly, the MACD line, represented by the blue line, takes center stage in this indicator. It is calculated by subtracting the longer-term exponential moving average (typically the 26-day EMA) from the shorter-term exponential moving average (usually the 12-day EMA). The MACD line is highly responsive to price changes, allowing traders to identify potential shifts in momentum and trends. When the MACD line rises above zero, it signifies bullish momentum, while a dip below zero indicates bearish momentum.
The second component of the MACD is the signal line, depicted by the orange line. It is a 9-day exponential moving average of the MACD line and acts as a smoother, slower-reacting line. By filtering out short-term price fluctuations and noise, the signal line provides a more reliable indication of the overall trend. Traders often look for the MACD line crossing above or below the signal line as a potential signal to buy or sell, respectively. These crossovers can serve as confirmation of trend reversals or continuations.
Lastly, the histogram, which appears as vertical bars on the MACD chart, reflects the difference between the MACD line and the signal line. When the MACD line is above the signal line, the histogram bars are positive, indicating bullish momentum. Conversely, when the MACD line falls below the signal line, the histogram bars turn negative, suggesting bearish momentum. The size and magnitude of the histogram bars provide additional insight into the strength of the momentum.
Parabolic SAR: The Trend Identifier
The Parabolic SAR is a simple yet powerful indicator used to identify market trends. It consists of multiple dots positioned either above or below the candle. If the dots are below the candle, it indicates an uptrend, and if they are above, it signals a downtrend.
200 EMA: The Long-Term Trend Director
The 200 EMA is used to identify the long-term trend direction. If the price is above the 200 EMA, it indicates an uptrend, and if it’s below, it suggests a downtrend.
The High Win Rate Strategy: Step-by-Step Guide
The high win rate trading strategy offers a systematic approach to maximize trading success. This step-by-step guide provides a clear framework for implementing the strategy effectively. The first step is to identify a suitable timeframe and market to apply the strategy. Once the market is chosen, the next step involves setting up the necessary indicators, such as the Moving Average Convergence Divergence (MACD), Parabolic Stop and Reverse (SAR), and the 200 Exponential Moving Average (EMA). Traders need to configure these indicators according to their preferences and trading goals. The third step entails understanding the signal generation process by observing the crossovers, trends, and reversal points indicated by the indicators. Traders should pay attention to the specific conditions that trigger buy and sell signals. Lastly, risk management is crucial for maintaining consistency and minimizing losses. Traders must determine appropriate stop-loss and take-profit levels, as well as consider position sizing and overall portfolio management. By following this step-by-step guide, traders can increase their chances of achieving a high win rate and potentially improve their overall trading performance.
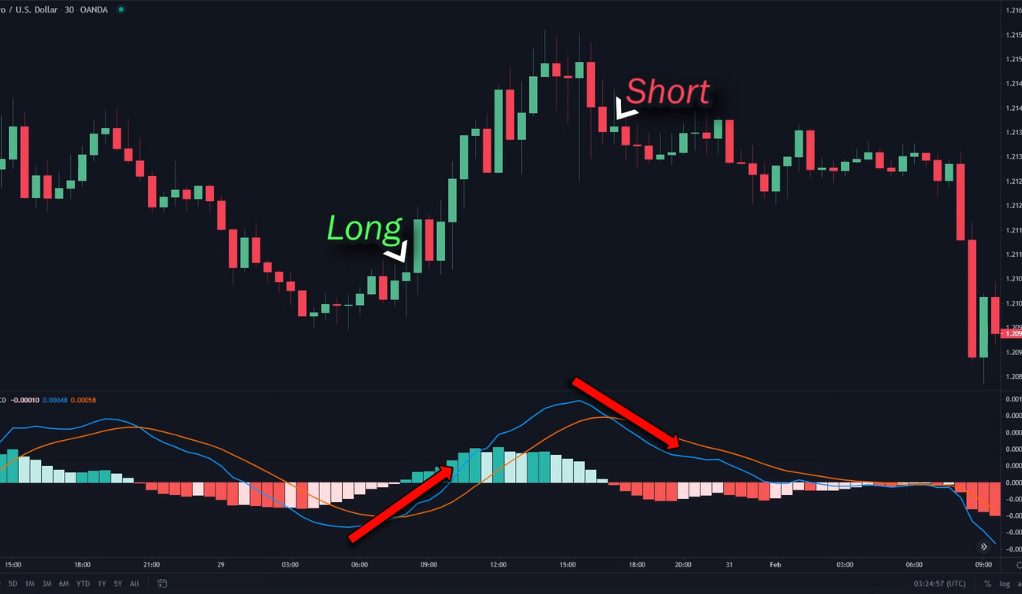
Going Long
To take long positions, ensure the price is above the 200 EMA. Next, look for the MACD line crossing above the signal line while the Parabolic SAR is positioned below the candle. This combination signals a potential long entry.
Going Short
For short positions, the price should be below the 200 EMA, the MACD line should cross below the signal line, and the Parabolic SAR should be positioned above the candle. This combination indicates a potential short entry.
Risk Management in Trading
Effective risk management is paramount in the world of trading to safeguard capital and optimize long-term profitability. This involves a set of practices and strategies designed to mitigate potential losses and protect against adverse market conditions. Traders employ various techniques to manage risk, such as setting stop-loss orders to limit losses on individual trades and diversifying their portfolios to spread risk across different assets. Additionally, position sizing plays a crucial role in risk management, as traders carefully determine the appropriate amount of capital to allocate to each trade based on their risk tolerance and the specific trade setup. Implementing risk management measures also includes continuously monitoring and adjusting trades as market conditions evolve. By prioritizing risk management, traders can preserve capital, withstand market volatility, and improve their overall trading success over the long term.
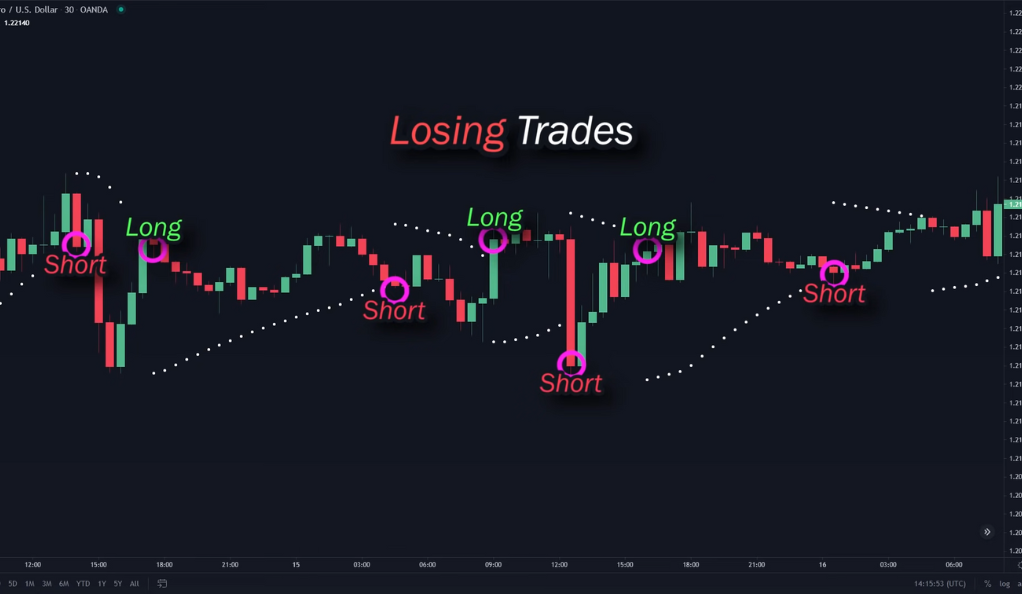
Managing Risk: Stop Loss and Profit Target
In this strategy, the stop loss is placed at the Parabolic SAR, and the profit target is set at a one-to-one risk ratio. To avoid massive losses in certain situations, it’s recommended to limit the stop loss to only 0.7, regardless of the Parabolic SAR’s position.
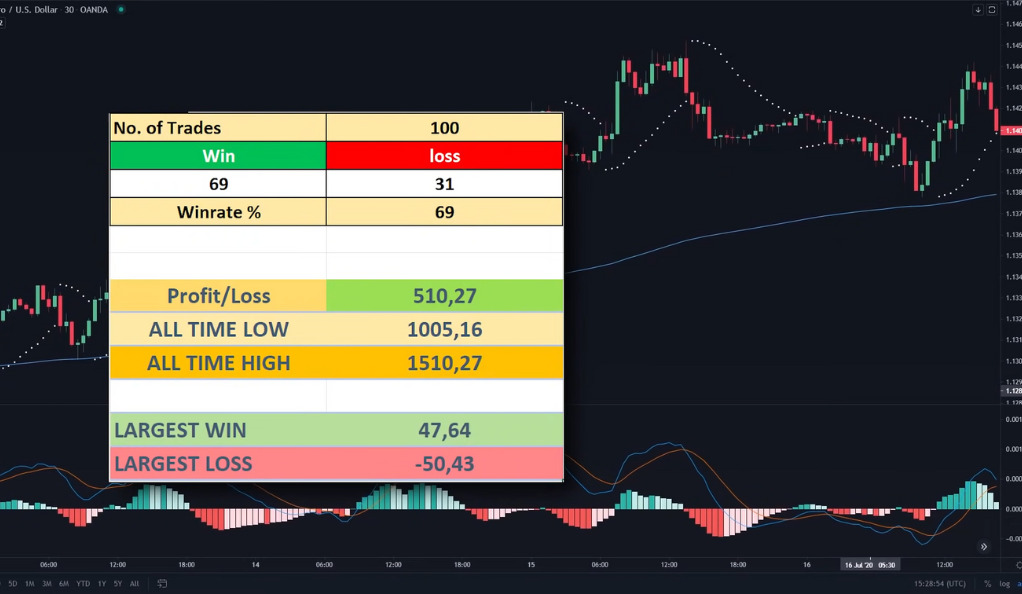
Backtesting: The Key to Confidence in Your Strategy
After backtesting this strategy 100 times on the EUR/USD 30-minute timeframe, the results were impressive. The win rate was 69%, and the total profit was $510.27 from a starting capital of $1000.
Conclusion
The high win rate trading strategy, incorporating the MACD, Parabolic SAR, and 200 EMA, showcases the potential of a well-tested approach in navigating the complexities of the market. While historical backtesting has demonstrated promising results, it is essential to approach trading strategies with caution and recognize that future outcomes may vary. Traders should conduct thorough research, analyze current market conditions, and consider their individual risk tolerance before implementing any strategy. It is crucial to adapt the strategy to fit one’s specific trading style and objectives, making adjustments as needed. By employing disciplined risk management practices and continuously monitoring and evaluating trade outcomes, traders can harness the power of this strategy and potentially increase their chances of achieving consistent profitability.
The high win rate trading strategy offers a robust framework supported by a combination of powerful indicators. However, success in trading requires more than just relying on a single strategy. Traders should continuously educate themselves, stay updated on market trends, and develop a comprehensive trading plan. Combining a well-tested strategy like the one described here with sound risk management practices can position traders for long-term success in the dynamic world of trading. Remember, trading is inherently speculative, and prudent decision-making based on thorough analysis and risk management is paramount to navigate the ever-changing financial landscape successfully.
Ainu Token aims to offer impartial and trustworthy information on cryptocurrency, finance, trading, and shares. However, we don't provide financial advice and recommend users to conduct their own studies and thorough checks.
Comments (No)