The trading landscape is replete with a myriad of indicators, each offering a unique lens through which to view and predict market trends. Among these, the Ichimoku Cloud Indicator stands out, often misunderstood due to its seemingly intricate structure. However, with a clear understanding of its components and their application, it can become an indispensable part of your trading toolkit. This detailed guide aims to unravel the complexities of the Ichimoku Cloud Indicator, providing a clear understanding of its structure and demonstrating how to leverage it effectively in your trading approach.
Deep Dive into the Ichimoku Cloud Indicator
The Ichimoku Cloud Indicator is a comprehensive analytical tool that provides a wealth of information in one comprehensive view. It stands out in the crowded field of trading indicators due to its multifaceted nature and the depth of insights it offers. This unique tool goes beyond the capabilities of traditional momentum indicators, such as the MACD crossover, by offering a more nuanced and accurate representation of market trends.
One of the key challenges in trading is the ability to distinguish between genuine market trends and misleading signals, especially when the market is range-bound. This is where the Ichimoku Cloud Indicator truly shines. It has a unique feature, known as the Kumo Cloud, which is specifically designed to filter out false signals. This feature provides a more accurate picture of market trends, reducing the risk of misinterpretation and helping traders make more informed decisions.
The Kumo Cloud: A Unique Feature of the Ichimoku Cloud Indicator
The Kumo Cloud is a distinctive component of the Ichimoku Cloud Indicator that sets it apart from other trading tools. It is this feature that gives the indicator its name and its unique ability to filter out misleading signals when the market is moving sideways. The Kumo Cloud is not just a single line on a chart but a dynamic cloud-like structure that changes shape and color based on market conditions.
The Kumo Cloud is designed to provide a visual representation of support and resistance levels in the market. When the market is in a range-bound state, the Kumo Cloud expands and contracts, providing a clear visual cue of the market’s volatility. This dynamic representation of market conditions helps traders identify potential trading opportunities and avoid false signals. By offering a more accurate and nuanced view of market trends, the Ichimoku Cloud Indicator helps traders navigate the often complex and unpredictable world of trading.
The Conversion Line and Baseline: The Core of the Indicator
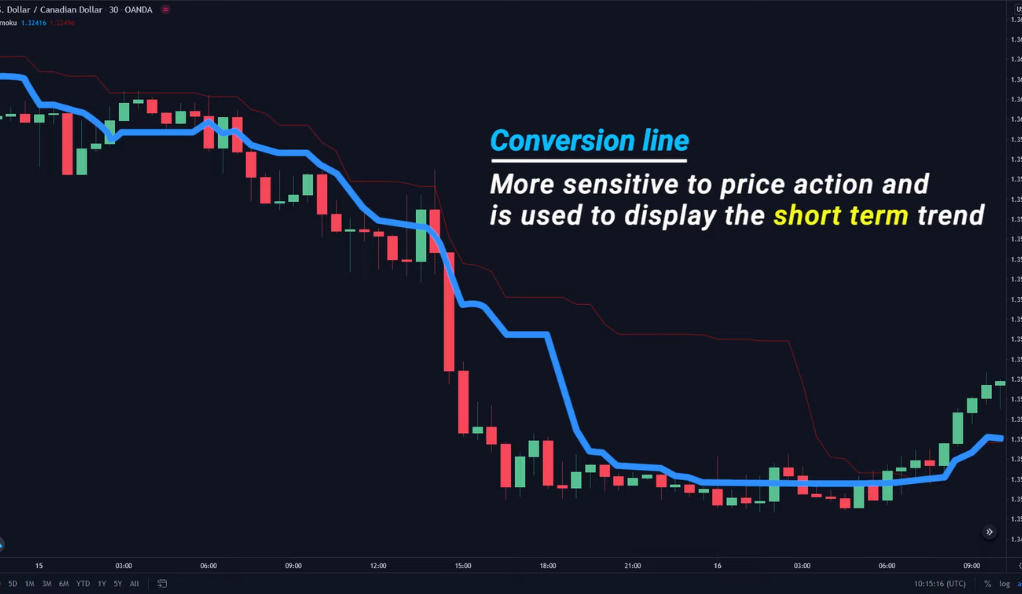
The Conversion Line and Baseline are integral components of the Ichimoku Cloud Indicator, serving as the backbone of this analytical tool. They function similarly to a moving average crossover system, but with unique characteristics. The Conversion Line, represented in blue on the chart, is highly sensitive to price fluctuations. It reacts swiftly to changes in price action, making it an excellent tool for identifying short-term market trends and potential trading opportunities.
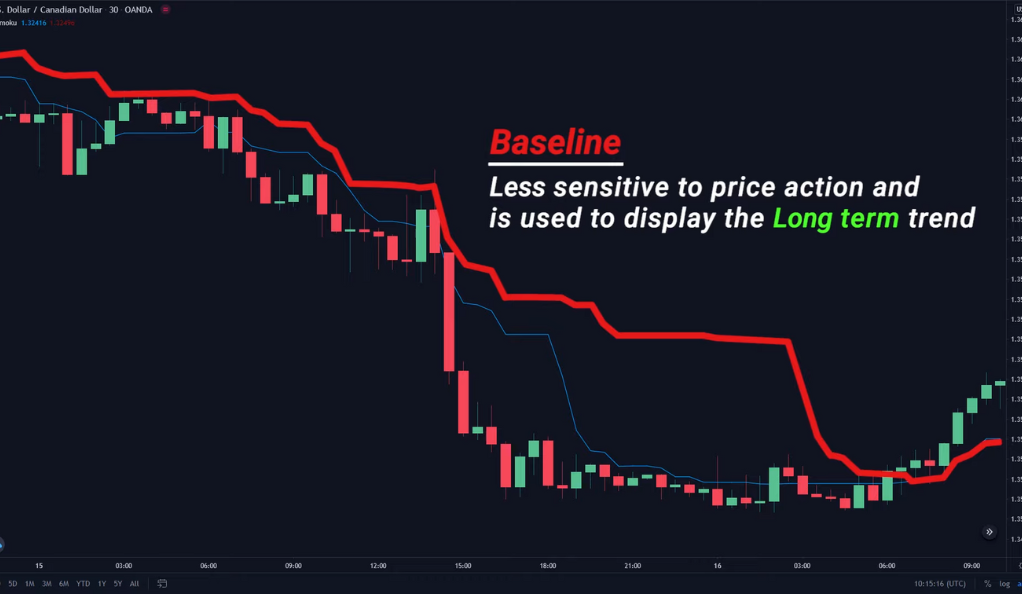
On the other hand, the Baseline, represented in red, is less responsive to immediate price changes. It smooths out short-term price volatility to provide a clearer picture of the market’s longer-term trend direction. This can be particularly useful for traders looking to hold positions over a more extended period, as it helps to identify the overall bullish or bearish market sentiment.
Together, the Conversion Line and Baseline offer a comprehensive overview of market momentum at both micro and macro levels. By understanding how these two components interact, traders can make more informed decisions, whether they’re looking for short-term trading opportunities or assessing the longer-term market trend.
The Kumo Cloud: The Distinguishing Feature
The Kumo Cloud is a standout feature of the Ichimoku Cloud Indicator, setting it apart from other technical analysis tools. It’s a dynamic, cloud-like structure on the chart that changes in shape and color based on market conditions, providing a visual representation of volatility and trend direction.
The Kumo Cloud is formed by two lines known as Senkou Span A and B. The interaction between these two spans creates a shaded area on the chart, known as the cloud. The cloud’s color provides a quick visual cue about the market’s direction. A green cloud suggests a bullish trend, indicating strong upward momentum. Conversely, a red cloud signifies a bearish trend, indicating strong downward momentum.
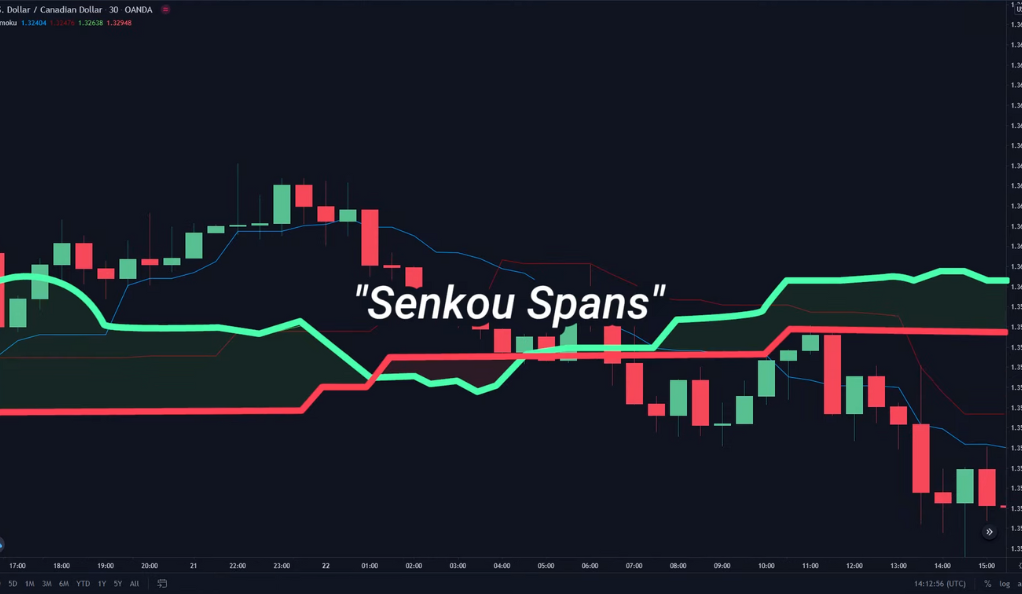
The cloud’s thickness is another crucial aspect. It represents the level of support or resistance faced by the price. A thicker cloud suggests stronger support or resistance, making it harder for the price to break through. Conversely, a thinner cloud indicates weaker support or resistance, making price breakthroughs more likely.
In essence, the Kumo Cloud offers a three-dimensional view of the market, providing insights into trend direction, momentum, and volatility. It’s this unique feature that makes the Ichimoku Cloud Indicator a powerful tool for traders.
Trading Rules: Charting a Course through the Clouds
“Trading Rules: Charting a Course through the Clouds” refers to the specific guidelines that traders using the Ichimoku Cloud Indicator should follow to make informed trading decisions. These rules are based on the position of the price candle in relation to the Kumo Cloud.
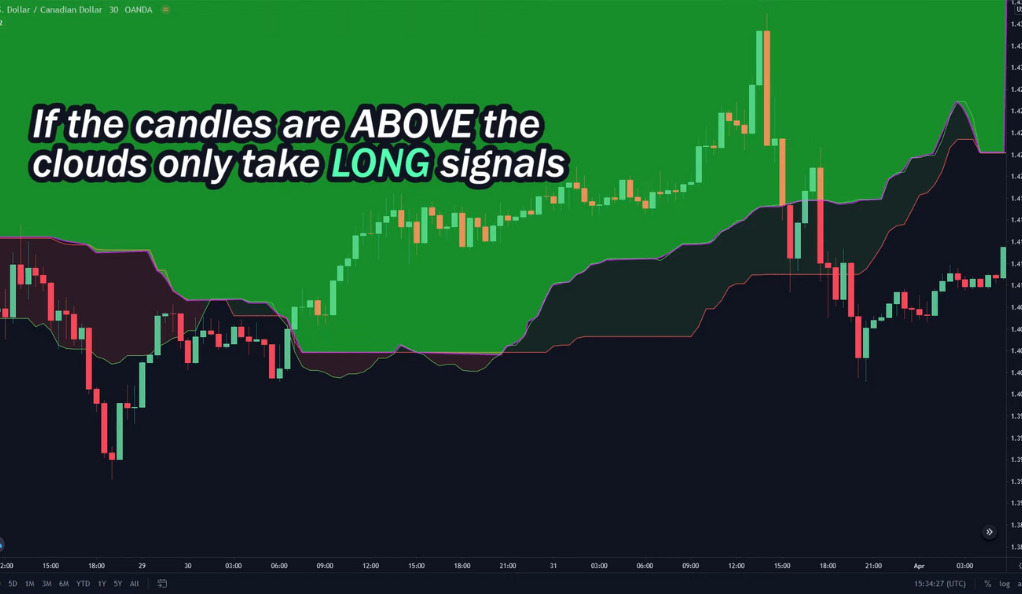
The first rule pertains to when the price candle is above the Kumo Cloud. In this scenario, the market is considered bullish, and traders are advised to consider only long positions. This is because the price being above the cloud indicates strong upward momentum, making it an opportune time to buy.
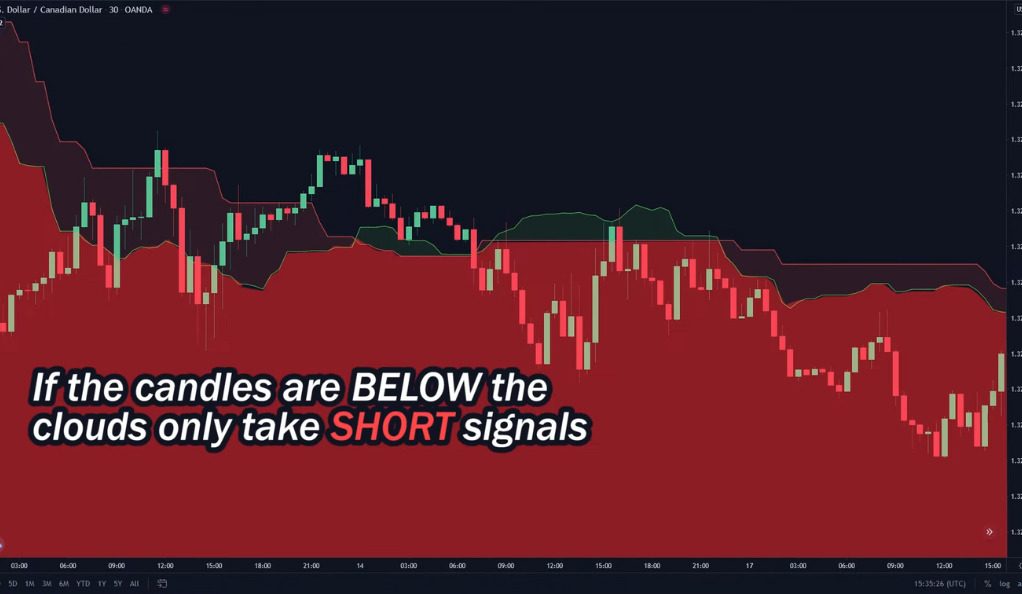
Conversely, if the price candle is below the Kumo Cloud, the market is in a bearish phase. Traders are advised to consider only short positions in this scenario, as the downward position of the price suggests a strong downward momentum, indicating a potential selling opportunity.
Lastly, if the price candle is within the Kumo Cloud, the market is considered to be in a state of equilibrium or indecision, with no clear upward or downward trend. In such situations, traders are advised to refrain from taking any positions until a clearer trend emerges. This is because the price being inside the cloud indicates a lack of strong momentum in either direction, making it a risky time to enter the market.
The Lagging Span: An Optional Confirmation
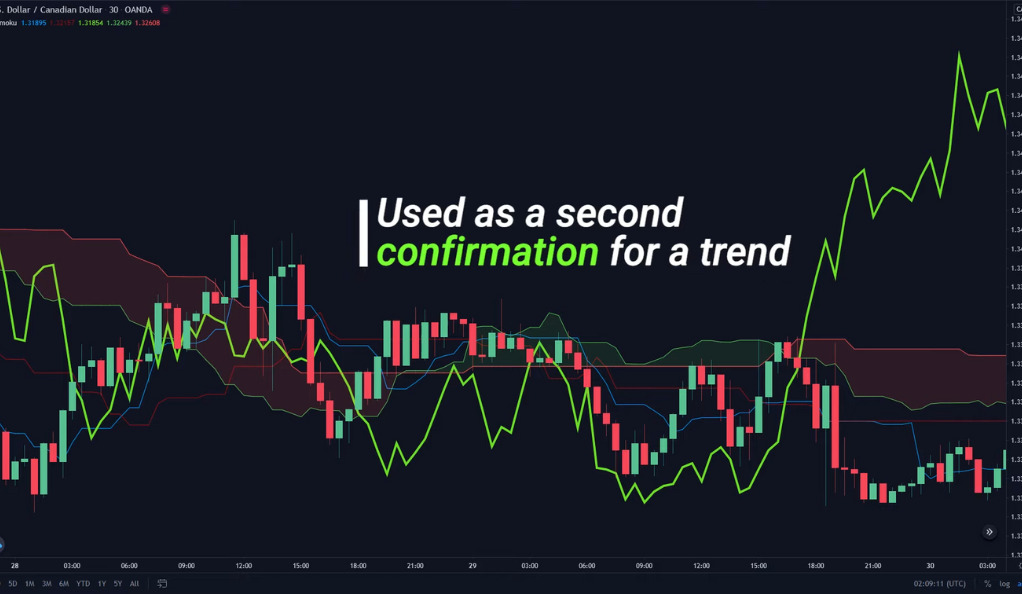
The Lagging Span, an optional component of the Ichimoku Cloud Indicator, serves as a secondary confirmation of market trends. It trails behind the price action, reflecting past market movements. If the Lagging Span aligns with the current trend direction, it provides additional confirmation of the trend’s strength, offering traders an extra layer of assurance before making a trading decision.
Trading Strategies: Maximizing the Potential of the Ichimoku Cloud Indicator
“Trading Strategies: Maximizing the Potential of the Ichimoku Cloud Indicator” refers to the various approaches traders can employ to fully leverage this powerful tool. These strategies, such as the Baseline Crossover Strategy and the Kumo Cloud Crossover, utilize different components of the indicator to identify trading opportunities. Additionally, the Ichimoku Cloud can be combined with other indicators like the Chaikin Money Flow and the Parabolic SAR for a more comprehensive trading strategy.
A Piece of Advice: Tailoring the Indicator to Your Needs
“A Piece of Advice: Tailoring the Indicator to Your Needs” emphasizes the importance of adapting the Ichimoku Cloud Indicator to fit your unique trading style and objectives. While the indicator comes with standard settings and guidelines, it’s crucial to experiment and adjust these parameters to align with your risk tolerance, trading goals, and market understanding. This customization can lead to more effective trading strategies and potentially higher success rates.
Conclusion
The Ichimoku Cloud Indicator, with its unique approach to identifying market trends and momentum, is an indispensable asset for any trader. Its multifaceted nature, which may initially seem intimidating, is in fact its greatest strength. By understanding the interplay between its various components, traders can unlock a treasure trove of insights that can significantly enhance their trading decisions.
This powerful tool goes beyond merely identifying trends. It provides a nuanced view of market momentum, filters out noise, and offers visual cues for support and resistance levels. It’s this depth and breadth of information that sets the Ichimoku Cloud Indicator apart from other trading indicators.
Moreover, the flexibility of the Ichimoku Cloud Indicator allows it to be tailored to individual trading styles and strategies. Whether you’re a short-term trader looking for quick market entries and exits, or a long-term trader seeking to understand broader market trends, the Ichimoku Cloud Indicator can be adapted to meet your specific needs.
Ainu Token aims to offer impartial and trustworthy information on cryptocurrency, finance, trading, and shares. However, we don't provide financial advice and recommend users to conduct their own studies and thorough checks.
Comments (No)