Trading in the financial markets can indeed be overwhelming for beginners, but employing the right strategy and tools can turn it into a profitable venture. One popular approach is trading on a 15-minute timeframe, which involves analyzing price movements and making trading decisions based on short-term trends. To effectively use this strategy, the first step is to select a reliable trading platform that provides real-time data and technical analysis tools. Next, beginners should familiarize themselves with key technical indicators, such as moving averages, Relative Strength Index (RSI), and MACD (Moving Average Convergence Divergence), which can help identify potential entry and exit points. Additionally, learning to read candlestick charts is crucial for recognizing patterns and understanding market sentiment.
Once the basic tools and knowledge are in place, beginners can proceed to develop a trading plan. This plan should outline clear entry and exit rules, risk management strategies, and a defined set of goals. Before executing any trades, it is essential to practice using a demo account to gain confidence and refine the strategy without risking real money. As the 15-minute timeframe is relatively short, traders should be prepared to make quick decisions and stay disciplined to avoid emotional trading. Regularly reviewing and adjusting the strategy based on market conditions is also vital for long-term success. By following this step-by-step guide and continuously honing their skills, beginners can navigate the complexities of trading on a 15-minute timeframe and increase their chances of becoming successful traders in the financial markets.
Understanding the 15-Minute Trading Strategy
The success of the 15-minute trading strategy lies in its ability to capitalize on short-term price movements. Within this relatively small timeframe, various factors such as market sentiment, economic data releases, and news events can cause rapid fluctuations in asset prices. Traders using this strategy closely monitor these developments and employ technical analysis tools to identify trends, support and resistance levels, and momentum indicators. The goal is to make swift and well-informed decisions to enter or exit positions at opportune moments, aiming to capture quick profits while managing risks effectively.
One key advantage of the 15-minute trading strategy is that it offers a more dynamic and action-packed approach compared to longer-term strategies. Day traders can execute multiple trades throughout the day, enhancing their opportunities to profit from short bursts of market movements. However, it is essential to acknowledge that this strategy also carries higher risks, as market conditions can change rapidly, and there may be increased noise and false signals in such short timeframes. As a result, traders need to stay disciplined, implement strict risk management practices, and be prepared to adapt their strategies based on market conditions. While the 15-minute trading strategy may not be suitable for everyone, those who can handle its fast-paced nature and are well-versed in technical analysis can find it to be a rewarding and potentially lucrative approach to navigate the financial markets.
Key Indicators for the 15-Minute Trading Strategy
The success of the 15-minute trading strategy hinges on three key indicators:
Supertrend
Supertrend is a popular technical indicator used by traders to determine the prevailing market trend. It assists traders in understanding whether the market is in an uptrend or a downtrend, enabling them to align their trading strategies with the current direction of the market. The Supertrend indicator is displayed on the price chart as a line that changes color based on the market’s trend. When the line is green, it suggests an uptrend, indicating that the price is likely to move higher. On the other hand, when the line turns red, it signifies a downtrend, suggesting that the price is expected to decline. This visual representation simplifies the process of identifying trends and helps traders make informed decisions about their positions.
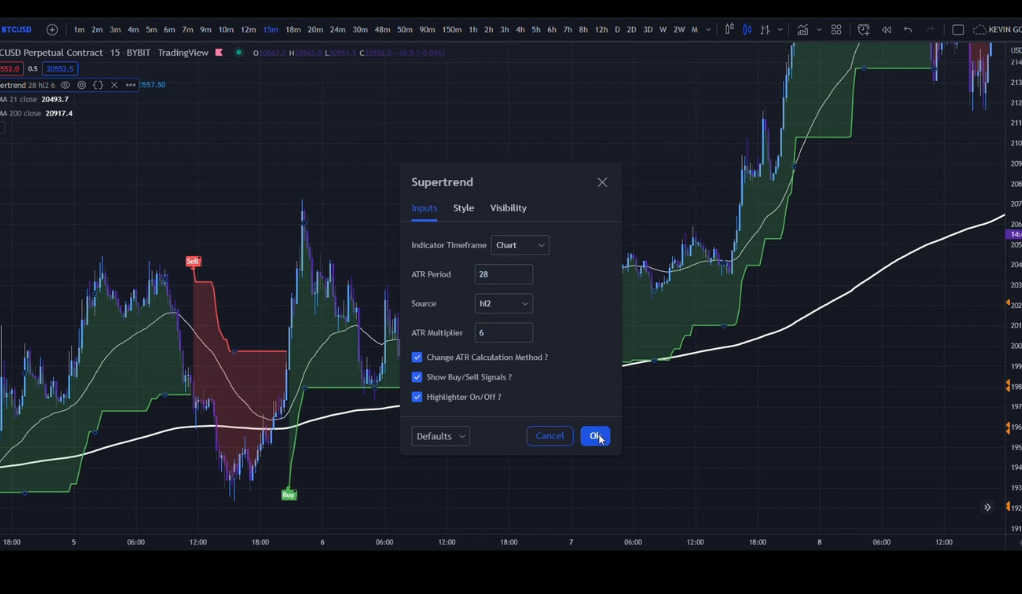
The Supertrend indicator is a valuable tool for traders in various financial markets like stocks, forex, cryptocurrencies, and commodities. It helps traders avoid trading against the trend, reducing the risk of losses. When combined with other technical analysis tools and strategies, it can further enhance trading performance. However, traders should use it alongside other forms of analysis and risk management techniques, as no indicator is infallible. When applied prudently within a comprehensive trading plan, the Supertrend can provide valuable insights into prevailing market trends.
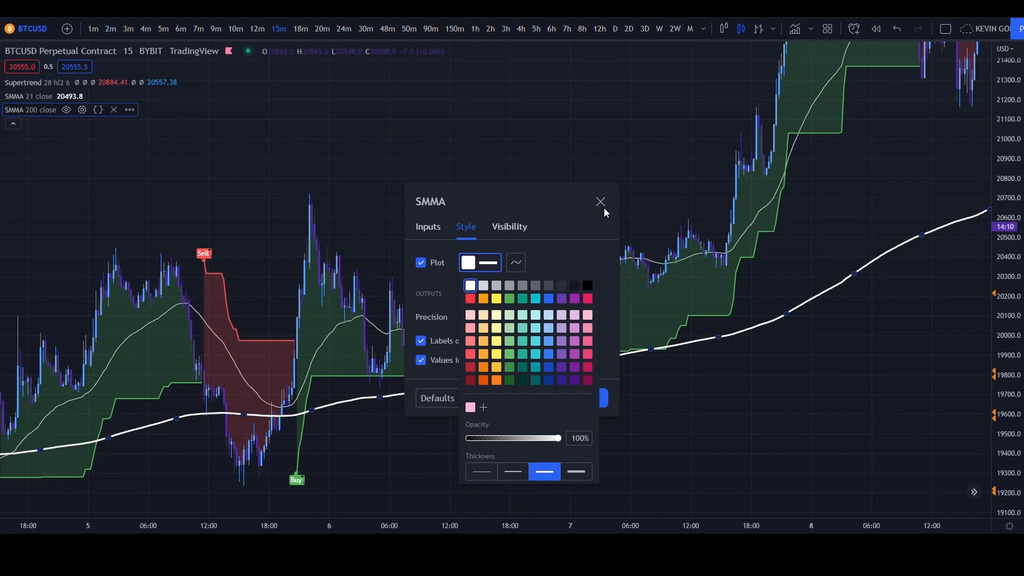
Smoothed Moving Average (SMA)
The Smoothed Moving Average (SMA) is a widely used technical indicator in financial markets that helps traders analyze price trends with reduced noise and volatility. It achieves this by calculating a constantly updated average of the asset’s price over a specific period, smoothing out short-term fluctuations and providing a clearer picture of the underlying market trend. Unlike simple moving averages, which equally weigh all data points in the period, the SMA assigns more weight to recent price data, making it more responsive to current market conditions. By doing so, the SMA helps traders identify the overall direction of the market, whether it is in an uptrend, downtrend, or trading sideways, allowing them to make more informed trading decisions.
The SMA is a valuable tool for traders and investors across different timeframes. Long-term investors use it to identify major trends and potential reversal points for strategic decisions. Short-term traders use the SMA for gauging short-term trends and entry/exit points. It can be combined with other indicators or chart patterns to enhance effectiveness. However, no indicator is foolproof, so risk management and other forms of analysis are essential for validating trading decisions.
2nd Smoothed Moving Average (SMA)
The 2nd Smoothed Moving Average (SMA) indicator is a variation of the traditional SMA that offers further smoothing of price data. It is designed to reduce noise and provide a clearer representation of the underlying trend. Similar to the regular SMA, this indicator calculates the average of an asset’s price over a specified period, but it applies additional smoothing techniques. By assigning more weight to recent price data, the 2nd SMA is more responsive to current market conditions, making it a valuable tool for traders seeking a smoother trend-following indicator. This enhanced smoothing helps traders identify major price movements and potential reversal points with greater accuracy, aiding in making well-informed trading decisions across various financial markets.
The 2nd Smoothed Moving Average indicator is particularly useful for traders who prefer a more stable and less volatile trend signal. By filtering out short-term fluctuations, it offers a clearer view of the market’s overall direction. Traders can use the 2nd SMA in combination with other technical analysis tools to validate trends and potential trade setups. As with any indicator, it is essential to use the 2nd SMA in conjunction with proper risk management and comprehensive market analysis for optimal results. By harnessing the power of the 2nd Smoothed Moving Average, traders can gain valuable insights into market trends and enhance their trading strategies.
Taking Long and Short Positions
Understanding when to take long and short positions is crucial in the 15-minute trading strategy. Long positions are taken when the market trend is upward, while short positions are taken when the trend is downward. The Supertrend, SMA, and ATR indicators guide these decisions.
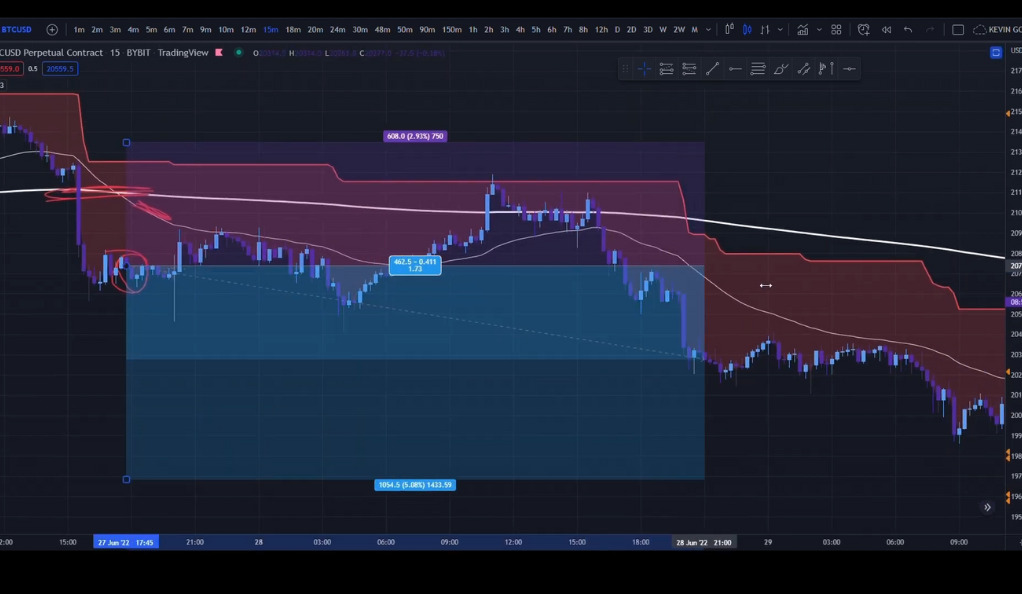
Setting Stop-Loss and Exit Points
Risk management is a key aspect of any trading strategy. Setting stop-loss and exit points helps protect your capital and secure profits. The ATR indicator is particularly useful in this regard, as it helps determine the level of market volatility and thus, the optimal stop-loss and exit points.
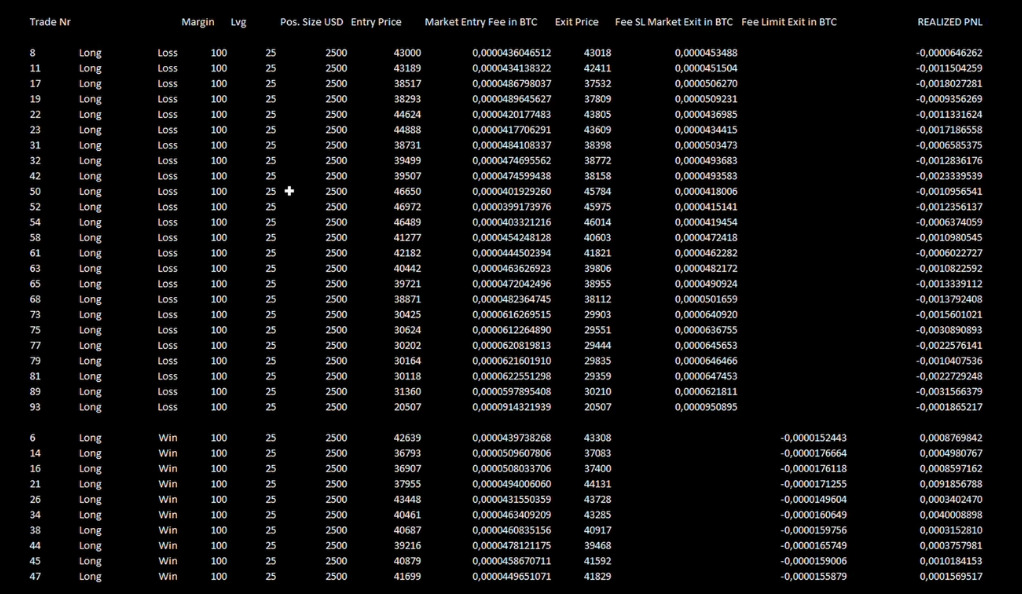
Backtesting: A Crucial Step
Before implementing the 15-minute trading strategy, it’s important to backtest it. Backtesting involves testing the strategy on historical data to evaluate its effectiveness. The article provides an example of backtesting using a leverage of 25x and a starting capital of 100 USD.
Reality check
In the context of mastering the 15-minute trading strategy, a reality check is crucial. Trading, especially in short timeframes, can often be influenced by emotions and hasty decisions. A reality check here would involve regularly assessing your trading performance, ensuring that the strategy is working as intended, and not being swayed by temporary market fluctuations. It’s about understanding that while this strategy can be profitable, it’s not a guaranteed path to quick riches. It requires discipline, a solid understanding of the market indicators, and a willingness to adapt based on market conditions. This reality check can help maintain a balanced perspective, encouraging responsible trading and risk management.
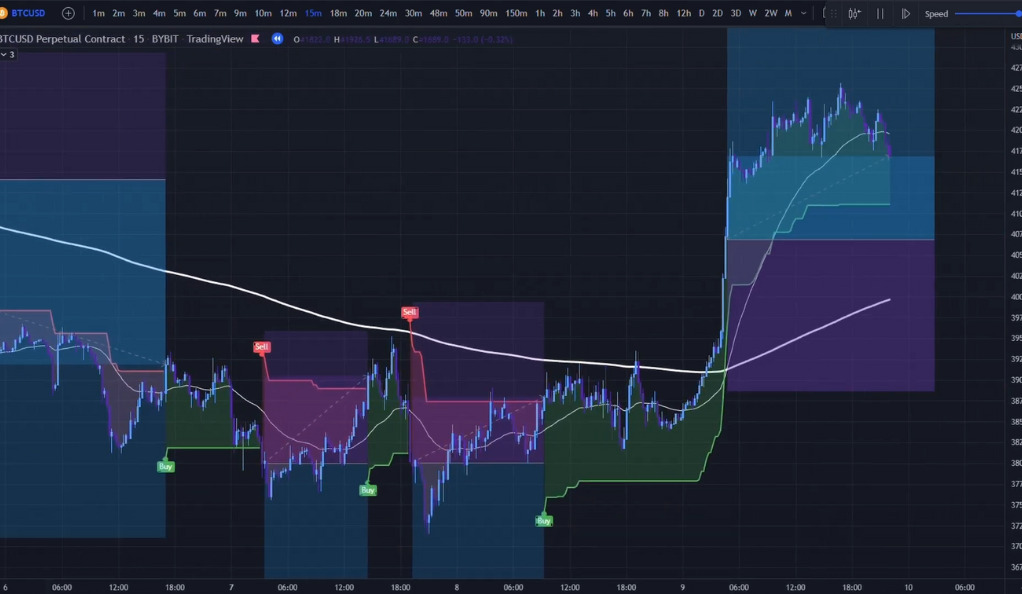
Final Result of Backtesting
In the “Mastering the 15-Minute Trading Strategy: A Comprehensive Guide,” the final result of backtesting is a crucial component. It provides a tangible measure of the strategy’s effectiveness before it’s implemented in real-time trading. The backtesting, conducted with a starting capital of 100 USD and a leverage of 25x, demonstrates the potential profitability of the strategy within the 15-minute timeframe. However, it’s important to remember that backtesting results are based on historical data and do not guarantee future performance. They serve as an indicator of the strategy’s potential, reinforcing the importance of risk management and adaptability in the ever-changing market conditions.
Conclusion
The 15-minute trading strategy, with its reliance on the Supertrend, SMA, and ATR indicators, provides a robust framework for short-term trading. By understanding when to take long and short positions, setting appropriate stop-loss and exit points, and backtesting the strategy, traders can potentially reap significant profits. However, as with any trading strategy, it’s important to remember that trading involves risk. Always trade responsibly and within your means.
Ainu Token aims to offer impartial and trustworthy information on cryptocurrency, finance, trading, and shares. However, we don't provide financial advice and recommend users to conduct their own studies and thorough checks.
Comments (No)