In the dynamic world of trading, having a reliable strategy is essential for achieving consistent profits. One popular technical indicator that traders often utilize is the Stochastics indicator. This article will delve into the best strategy for using the Stochastics indicator effectively, highlighting its potential when combined with the 200 EMA (Exponential Moving Average) and another confirming indicator, such as simple support resistance or MACD. By incorporating these tools and understanding how to interpret their signals, traders can gain valuable insights into potential reversals and make informed trading decisions.
Understanding the Stochastics Indicator
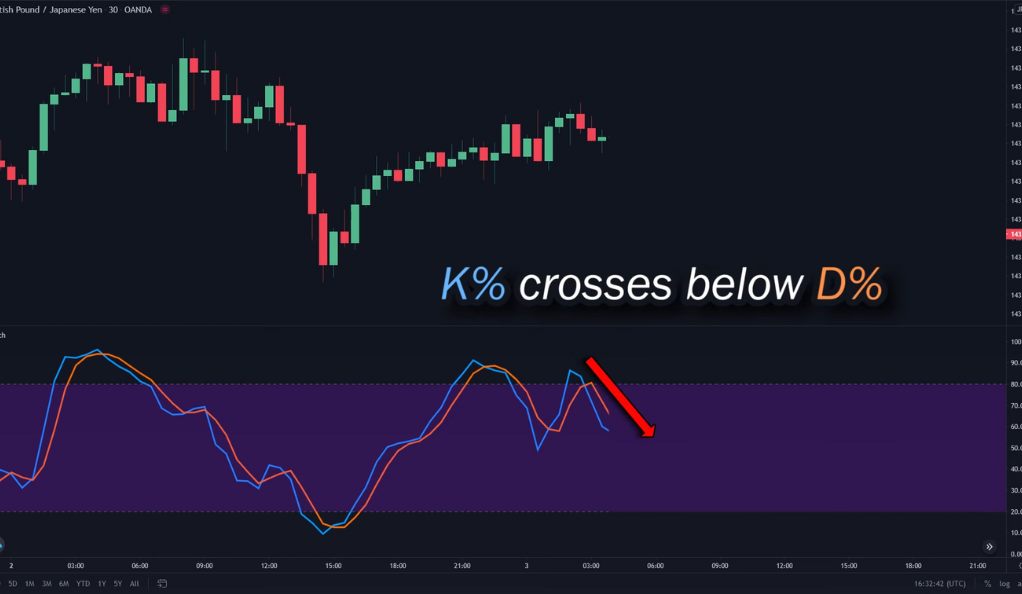
The Stochastics indicator is a momentum oscillator that compares the current closing price of an asset to its price range over a specific period. It consists of two lines: the %K line and the %D line. The %K line represents the current price’s position relative to the highest and lowest prices within a given timeframe, while the %D line is a moving average of the %K line.
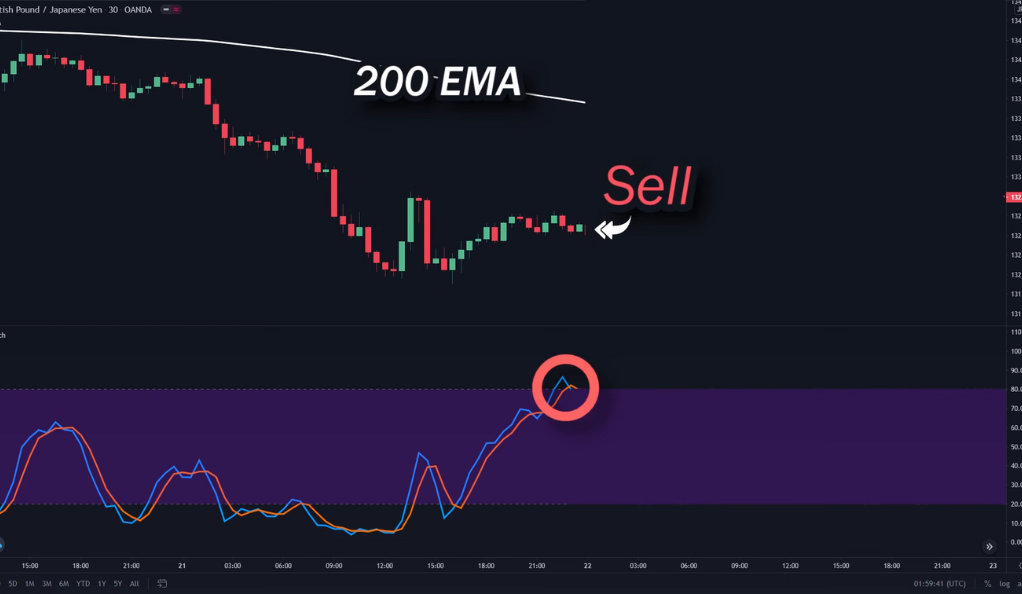
When the Stochastics lines move into overbought (above 80) or oversold (below 20) territory, it suggests a potential reversal in price direction. However, using the Stochastics indicator alone may not provide sufficient confirmation for traders to enter or exit trades. This is where combining it with other indicators becomes valuable.
Combining Stochastics with the 200 EMA
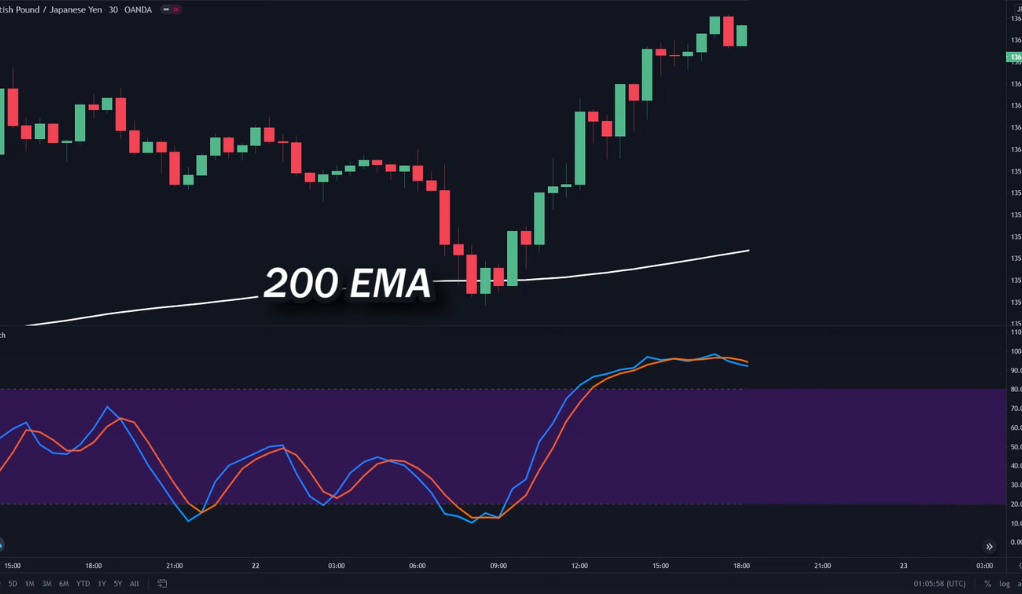
The 200 EMA is a widely used technical indicator that shows the average price of an asset over the past 200 periods. When the price is above the 200 EMA, it indicates a bullish trend, while a price below the 200 EMA suggests a bearish trend.
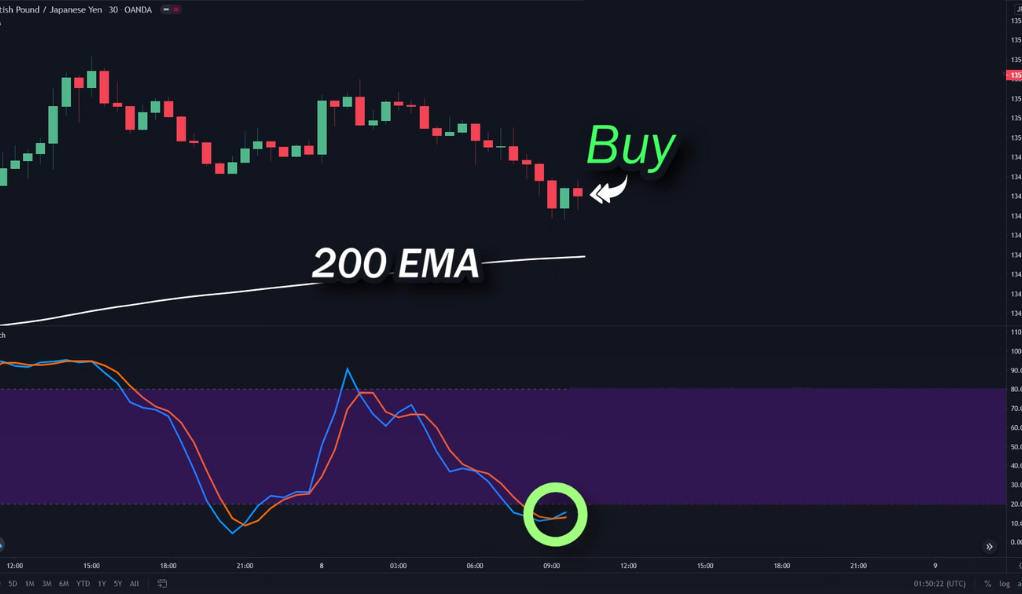
By combining the Stochastics indicator with the 200 EMA, traders can identify potential reversal signals with greater accuracy. When the Stochastics lines enter overbought or oversold territory, traders should look for a corresponding cross of the price with the 200 EMA. For example, if the Stochastics lines are in the oversold region and the price crosses above the 200 EMA, it may signal a bullish reversal.
Confirming with Additional Indicators
While the Stochastics indicator combined with the 200 EMA provides a powerful foundation for identifying reversal signals, it is always prudent to seek confirmation from additional indicators. Simple support resistance and MACD are two popular choices.
Support and resistance levels are price levels where buying or selling pressure tends to be strong. When the Stochastics lines signal a potential reversal and coincide with a break of a significant support or resistance level, it strengthens the validity of the signal. Traders can use horizontal lines or trendlines to identify these levels and adjust their strategies accordingly.
The MACD (Moving Average Convergence Divergence) indicator is another valuable tool for confirming Stochastics signals. MACD consists of two lines: the MACD line and the signal line. When the MACD line crosses above the signal line, it generates a bullish signal, while a crossover below the signal line suggests a bearish signal. When these crossovers align with Stochastics reversal signals, it enhances the likelihood of a successful trade.
Implementing the Strategy

Identify the Asset
The first step in implementing an effective Stochastics trading strategy is to carefully identify the specific financial instrument you wish to trade. The world of trading offers a wide array of assets, including stocks, forex pairs, commodities, cryptocurrencies, and more. Each asset class has its unique characteristics, behaviors, and market dynamics.
To begin, consider your trading goals, risk tolerance, and level of expertise. Are you interested in trading individual stocks, where you can focus on specific companies and their financial performance? Or are you drawn to the fast-paced world of forex trading, where you can take advantage of currency fluctuations? Perhaps commodities, such as gold or oil, appeal to you due to their intrinsic value and economic significance.
Understanding the characteristics and behavior of the chosen asset is crucial for successful trading. Research the historical price movements, volatility, liquidity, and any fundamental factors that may impact the asset’s value. Stay up to date with relevant news, economic indicators, and geopolitical events that could influence the asset’s performance.
Set up the Chart
After identifying the asset you wish to trade, the next step in implementing an effective Stochastics trading strategy is to set up the chart. The chart serves as a visual representation of the price movements and allows you to analyze the asset’s historical data and identify potential trading opportunities.
One of the key considerations in chart setup is selecting an appropriate timeframe. The timeframe you choose should align with your trading goals, preferences, and trading style. Different timeframes offer varying levels of detail and insights into price movements.
For day traders or those seeking shorter-term trades, intraday charts, such as 15-minute, 30-minute, or 1-hour charts, are commonly used. These charts provide a more granular view of price fluctuations and allow for quick decision-making based on short-term trends and patterns.
Apply the Stochastics Indicator
Once you have set up the chart for your chosen asset, the next step in implementing your Stochastics trading strategy is to apply the Stochastics indicator. The Stochastics indicator is a popular momentum oscillator that helps identify potential trend reversals and overbought or oversold conditions in the market.
To add the Stochastics indicator to your trading platform, locate the indicator menu or toolbar. From there, select the Stochastics indicator and apply it to the chart of your chosen asset. Once applied, you can customize the indicator’s settings according to your preferred parameters.
The most common settings for the Stochastics indicator are 14, 9, and 5 for the %K, %D, and slowing periods, respectively. These settings determine the number of periods used in the calculations and can be adjusted based on your trading style and the timeframe you are using.
The Stochastics indicator consists of two lines: the %K line and the %D line. The %K line represents the current price’s position relative to the highest and lowest prices within a given timeframe. It is more sensitive to price changes and tends to be more volatile.
Add the 200 EMA
In order to further enhance the effectiveness of the Stochastics indicator, it is recommended to incorporate the 200 EMA (Exponential Moving Average) onto your chart. The 200 EMA is a widely used technical indicator that provides valuable insights into the overall trend of the asset.
The 200 EMA represents the average price of the asset over the past 200 periods, whether that be days, hours, or any other timeframe that aligns with your trading strategy. The Exponential Moving Average places more weight on recent price data, making it more responsive to current market conditions compared to a simple moving average.
To add the 200 EMA to your chart, locate the indicator menu or toolbar on your trading platform. Choose the Exponential Moving Average indicator and set the period to 200. Once applied, the 200 EMA line will be plotted on your chart, representing the average price of the asset over the specified period.
Confirm with Support Resistance or MACD
While the Stochastics indicator and the 200 EMA provide a strong foundation, confirming the reversal signals with additional indicators further strengthens the strategy. Two commonly used confirming indicators are support resistance and MACD.
Support and resistance levels are significant price levels where buying or selling pressure tends to be strong. When the Stochastics lines indicate a potential reversal and coincide with a breakout or breakdown of a crucial support or resistance level, it strengthens the validity of the signal. By utilizing horizontal lines or trendlines, traders can identify these levels and adjust their trading strategies accordingly.
The MACD (Moving Average Convergence Divergence) indicator is another valuable tool for confirming Stochastics signals. Comprised of two lines, the MACD line and the signal line, it provides insights into the momentum and direction of an asset’s price movement. When the MACD line crosses above the signal line, it generates a bullish signal, while a crossover below the signal line suggests a bearish signal. When these crossovers align with Stochastics reversal signals, it further enhances the likelihood of a successful trade.
Define Stop Loss and Profit Targets
To effectively manage risk, it is essential to define appropriate stop loss and profit targets. Stop loss orders are placed to limit potential losses in case the trade goes against expectations, while profit targets help secure profits when the trade moves favorably. These levels should be determined based on your risk tolerance, reward objectives, and consideration of price volatility.
Conclusion
In conclusion, the Stochastics indicator, when combined with the 200 EMA and other confirming indicators, can greatly enhance a trader’s ability to identify potential reversals and make informed trading decisions. By utilizing this strategy, traders can gain a deeper understanding of market dynamics and improve their chances of success. However, it is crucial to remember that no strategy guarantees 100% accuracy, and risk management remains a vital aspect of trading. Continual learning, practice, and adaptation are key to achieving long-term profitability in the dynamic world of trading.
Ainu Token aims to offer impartial and trustworthy information on cryptocurrency, finance, trading, and shares. However, we don't provide financial advice and recommend users to conduct their own studies and thorough checks.
Comments (No)