The world of financial trading is a complex labyrinth that requires a well-thought-out strategy to navigate successfully. Among the myriad of trading strategies available, the Trade Pro strategy stands out due to its simplicity, effectiveness, and the use of free, easily accessible tools. This article aims to provide an in-depth understanding of this strategy, its components, trading rules, and the results of its backtesting.
Decoding the Trade Pro Strategy
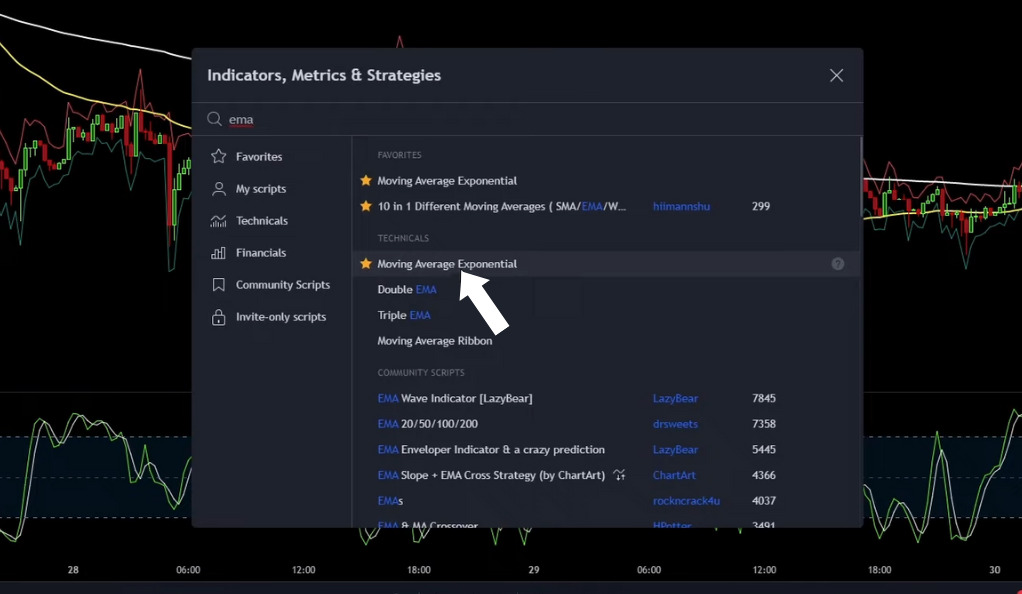
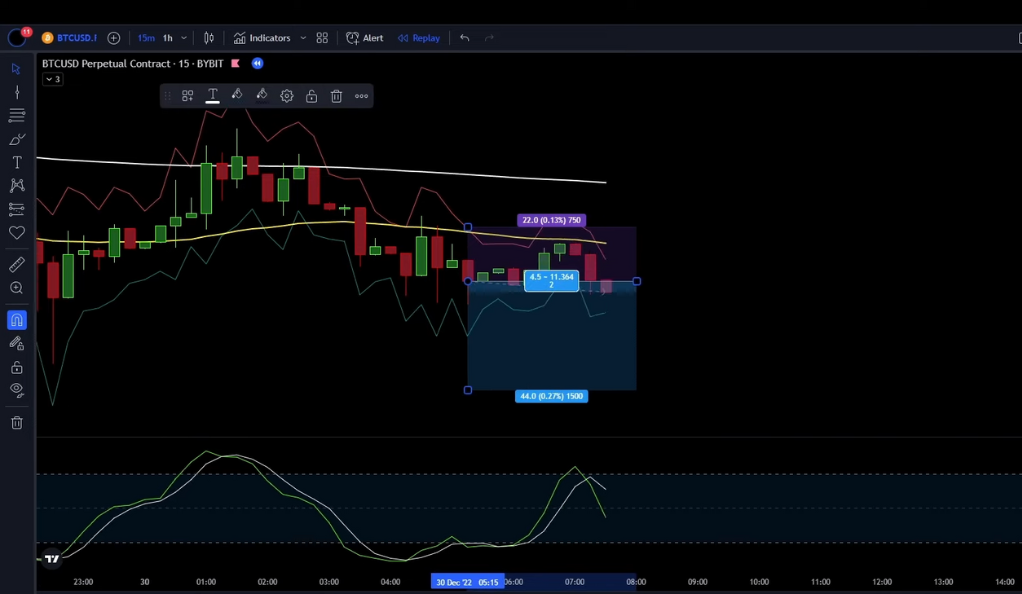
The Trade Pro strategy is a trading approach that utilizes three free TradingView indicators. These include two Exponential Moving Averages (EMAs), the ATR Stop Loss finder, and the Stochastic RSI. But what makes these indicators so special? Let’s delve deeper into each of these components.
The Power of Exponential Moving Averages (EMAs)
Exponential Moving Averages (EMAs) are a powerful tool in the arsenal of many traders. They are a type of moving average that gives more importance to recent data, making them more responsive to the latest market changes compared to their counterpart, the Simple Moving Average (SMA). This unique characteristic of EMAs makes them a preferred tool for traders who need to quickly adapt to market changes.
EMAs are calculated by applying a percentage of today’s closing price to yesterday’s moving average. This calculation method allows EMAs to react more quickly to price changes than SMAs, which assign equal weight to all periods. This responsiveness is particularly beneficial in volatile markets where price changes can be sudden and significant.
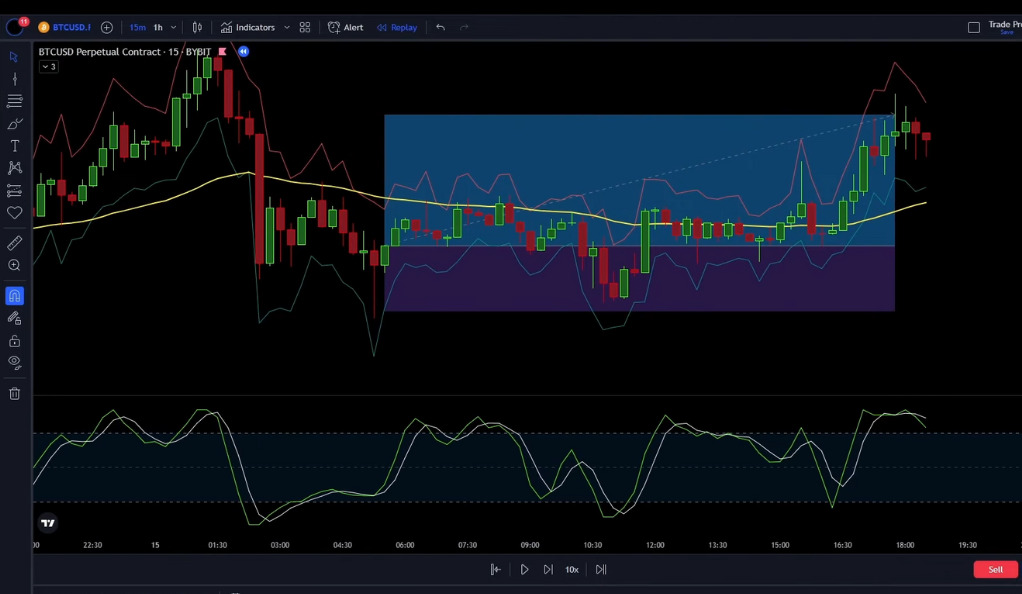
In the Trade Pro strategy, two EMAs are used with different lengths: one set to a length of 50 and the other set to a length of 200. These lengths are not chosen at random; they are carefully selected to provide valuable insights into market trends.
The ATR Stop Loss Finder: Your Risk Management Ally
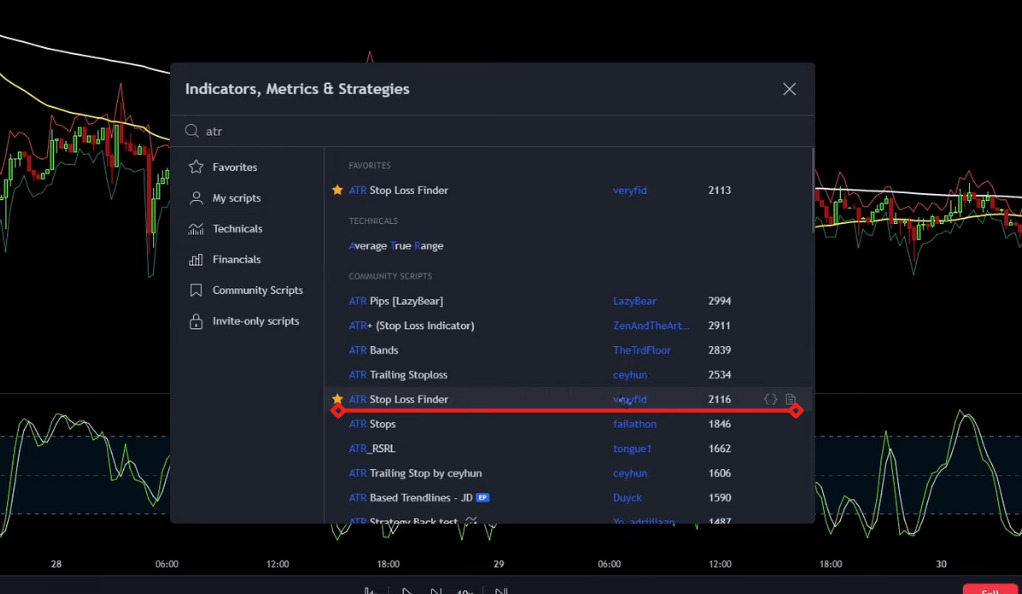
Risk management is a cornerstone of successful trading. One of the most effective tools for managing risk in trading is the ATR Stop Loss Finder. This tool leverages the concept of Average True Range (ATR), a volatility indicator, to set stop loss levels that adapt to market volatility. This dynamic approach to risk management can be particularly beneficial in volatile markets where price swings can be substantial.
The ATR was introduced by J. Welles Wilder Jr. in his book “New Concepts in Technical Trading Systems.” It measures market volatility by calculating the average range between the high and low prices over a specified period. The ATR is not a directional indicator; instead, it provides an objective measure of price volatility.
The ATR Stop Loss Finder takes this concept a step further by using the ATR to set a dynamic stop loss level. Instead of setting a fixed stop loss, the ATR Stop Loss Finder adjusts the stop loss level based on market volatility. This means that in periods of high volatility, the stop loss level will be further from the entry point, giving the trade more room to breathe. Conversely, in periods of low volatility, the stop loss level will be closer to the entry point, reducing the potential loss if the trade goes against the trader.
The Stochastic RSI: A Window into Market Momentum
The Stochastic RSI is a momentum oscillator that provides valuable insights into the speed or velocity of a security’s price movement. This indicator is a derivative of the Relative Strength Index (RSI), one of the most popular momentum indicators in technical analysis. The Stochastic RSI applies the Stochastic oscillator formula to the RSI values, resulting in an indicator that fluctuates between 0 and 1 and can be used to identify overbought and oversold conditions.
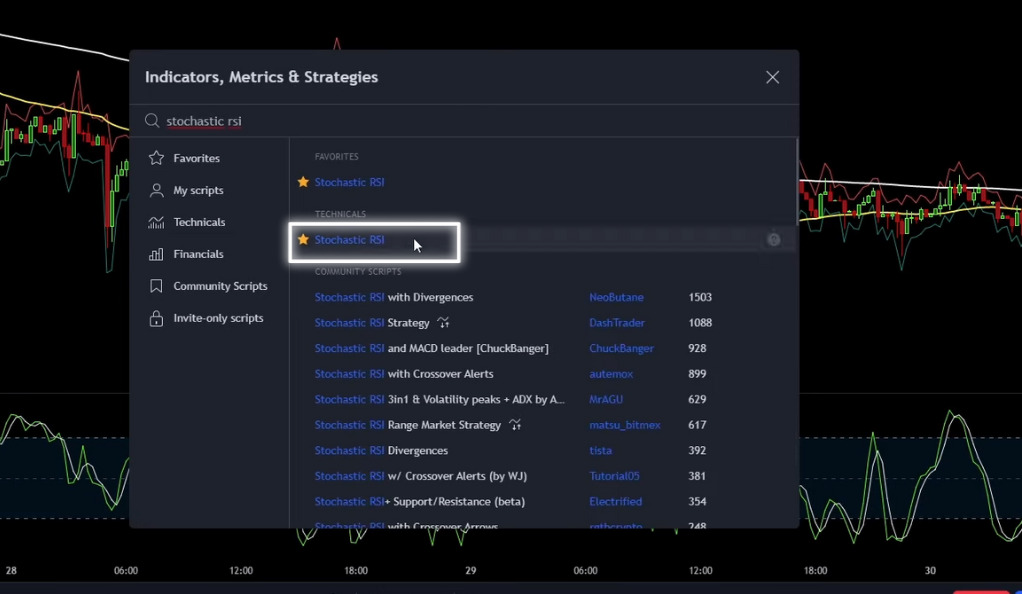
The concept of overbought and oversold conditions is central to many trading strategies. An overbought condition is typically seen as a situation where the price of a security has risen so high, usually due to over-enthusiastic buying, that an adjustment or a reversal is likely. Conversely, an oversold condition is a scenario where the price has fallen so low, usually due to excessive selling, that a bounce or reversal is anticipated.
In the context of the Stochastic RSI, an asset is considered overbought when the Stochastic RSI value is above 0.8 and oversold when it is below 0.2. These thresholds can be adjusted based on market conditions and the trader’s risk tolerance.
The Trading Rules of the Trade Pro Strategy
A trading strategy is only as good as its rules. The Trade Pro strategy has specific rules for both long and short positions, providing clear guidelines for traders.
Rules for Long Positions
In trading parlance, a long position is when you buy a security with the expectation that its price will rise. In the Trade Pro strategy, a long position is considered when the 50 EMA is above the 200 EMA. But how do you know when to enter and exit a trade? Let’s explore.
- Entry and Exit Rules for Long Positions
For a long entry to be valid in the Trade Pro strategy, the price action must make a valid pullback into the 50 EMA, indicating a potential upward price movement. Simultaneously, the Stochastic RSI must have gone into the oversold territory, suggesting that the security is undervalued and likely to increase in price. The stop loss is set at the lower ATR line, providing a safety net against potential market downturns. The target is a risk to reward ratio of 1 to 2, balancing potential profits with risk.
Rules for Short Positions: Navigating the Downward Trend
In the world of trading, a short position refers to selling a security with the expectation that its price will fall. This is a common strategy used by traders to profit from declining prices. However, short selling comes with its own set of rules and risks, and understanding these is crucial for successful trading. In the Trade Pro strategy, specific rules are set for short positions, providing a clear framework for traders to follow.
- Identifying a Short Position in the Trade Pro Strategy
In the Trade Pro strategy, a short position is considered when the 50-period EMA (Exponential Moving Average) is below the 200-period EMA. This is a common technical analysis technique used to identify the overall trend of a market. When the shorter-term EMA (50-period) is below the longer-term EMA (200-period), it typically indicates a bearish or downward trend. This is the first signal that traders using the Trade Pro strategy look for when considering a short position.
- Entry Rules for Short Positions
Once a potential short position has been identified, the next step is to determine the precise entry point. In the Trade Pro strategy, a valid entry for a short position requires two conditions to be met:
Price Action Pullback: The price action must make a valid pullback into the 50 EMA, with the price closing above the yellow line (50 EMA). This pullback is important as it can provide a better entry point and potentially increase the risk-to-reward ratio of the trade.
Stochastic RSI Indicator: The Stochastic RSI must have gone into the overbought territory (lines of the Stochastic printed above the 80 level). This indicates that the security may be overpriced and could be due for a price correction or reversal.
Once these conditions are met, a short position can be entered.
Exit Rules for Short Positions
Knowing when to exit a trade is just as important as knowing when to enter. In the Trade Pro strategy, the exit rules for a short position are clearly defined:
Stop Loss: The stop loss is set at the upper ATR (Average True Range) line. This dynamic stop loss adjusts to market volatility, providing protection against potential price increases that could result in a loss.
Profit Target: The profit target is set with a risk to reward ratio of 1 to 2. This means that for every unit of risk taken (defined by the distance between the entry point and the stop loss), the trader aims to make twice as much in profit.
Backtesting the Trade Pro Strategy
Backtesting is a critical step in validating the effectiveness of a trading strategy. It involves testing the strategy using historical data to see how it would have performed.
The Results of the Backtesting
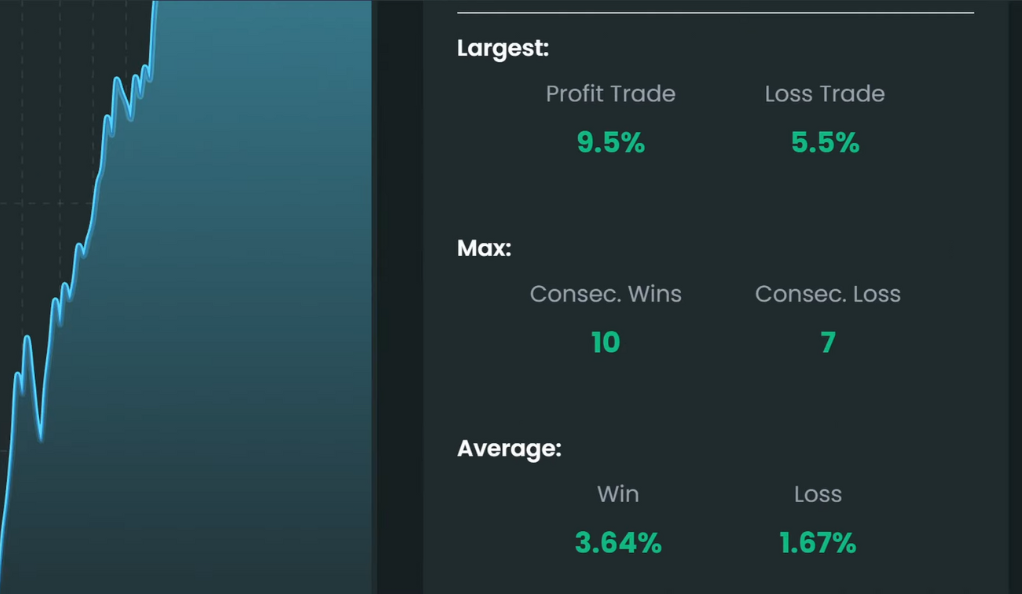
The backtesting of the Trade Pro strategy showed a win rate of 51% and a profit of 168%. The initial account balance of 1000 USD grew to 2681 USD, demonstrating the strategy’s potential for account growth. The largest profit trade was 9.5%, and the largest loss trade was 5.5%, highlighting the importance of risk management. The strategy had 10 consecutive wins and 7 consecutive losses, showing its potential for both winning and losing streaks.
Conclusion
The Trade Pro strategy, with its simple yet effective approach, has proven to be a viable trading method. Its use of EMAs, the ATR Stop Loss finder, and the Stochastic RSI, combined with clear trading rules, makes it a strategy worth considering for both novice and experienced traders. However, like any trading strategy, it’s essential to understand it fully and practice it extensively before implementing it in live trading. Remember, successful trading is not just about the strategy but also about discipline, patience, and risk management.
Ainu Token aims to offer impartial and trustworthy information on cryptocurrency, finance, trading, and shares. However, we don't provide financial advice and recommend users to conduct their own studies and thorough checks.
Comments (No)