In the complex and fast-paced world of financial trading, the right tools and strategies can be the difference between success and failure. Among the wide array of tools available to traders, two stand out due to their effectiveness and versatility: the Dynamic Support and Resistance Indicator and the Oscillator Matrix Indicator. When used in combination, these tools can provide a robust strategy for analyzing price action and predicting market trends, making them invaluable for both short-term day traders and long-term investors.
Contents
Unpacking the Dynamic Support and Resistance Indicator
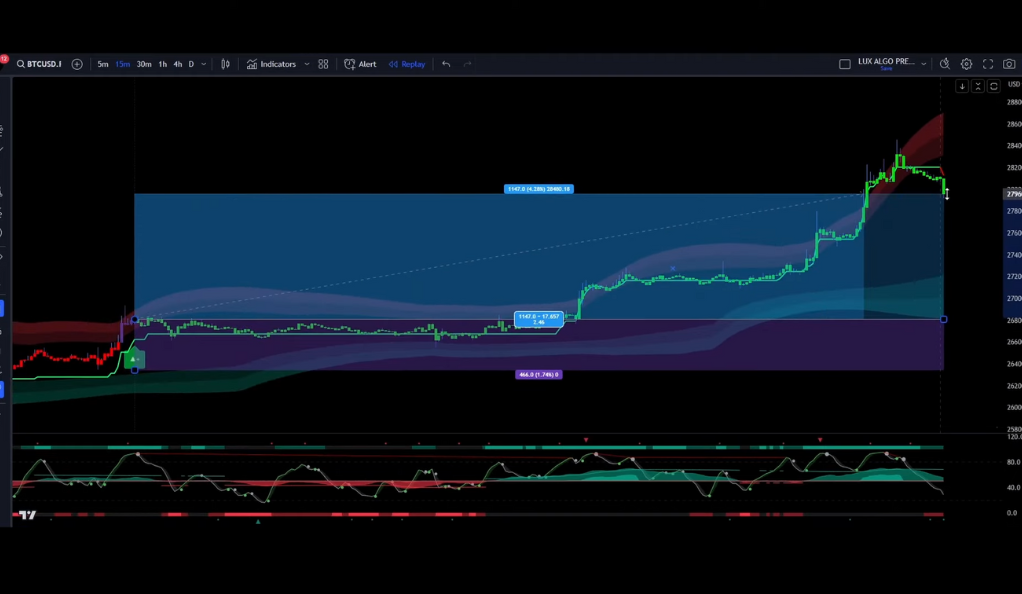
Involves understanding its role as a key tool in technical analysis. This indicator offers a real-time, adaptive approach to identifying crucial price levels in financial trading. Unlike static lines, it adjusts to market volatility, creating a visual channel around a security’s price. This dynamic nature provides traders with accurate, timely signals, aiding in predicting market trends and making informed trading decisions.
- Understanding the Dynamic Support and Resistance Indicator
The Dynamic Support and Resistance Indicator is a pivotal tool in technical analysis. It offers a real-time, adaptive approach to identifying key price levels. Unlike static lines, this indicator adjusts to market volatility, creating a channel around a security’s price to visually represent its typical range. This dynamic nature provides traders with accurate, timely signals, aiding in predicting whether a breakout will sustain or a reversal is imminent. - The Mechanics of Dynamic Support and Resistance
At its core, the Dynamic Support and Resistance Indicator is a volatility-based technical analysis tool. Unlike static support and resistance lines that remain constant, dynamic support and resistance levels adjust in real-time, providing more accurate and timely signals. This indicator creates a channel around the price of a security, offering traders a visual representation of the security’s normal price range. - The Significance of Dynamic Support and Resistance
The dynamic nature of this indicator is what sets it apart. It adapts to changing market conditions, providing traders with a more accurate picture of the market’s movements. This can be particularly useful in volatile markets, where price levels can change rapidly and unpredictably. By providing a dynamic view of support and resistance levels, this indicator can help traders determine whether a breakout is likely to hold or if a reversal is about to take place.
Equity Curve
The equity curve is a vital tool in trading that provides a visual representation of the performance and growth of an investment or trading strategy over time. It plots the cumulative profit or loss generated from a series of trades, allowing traders to assess the effectiveness and consistency of their trading approach. By analyzing the equity curve, traders can identify periods of profitability, drawdowns, and overall trends in their trading performance.
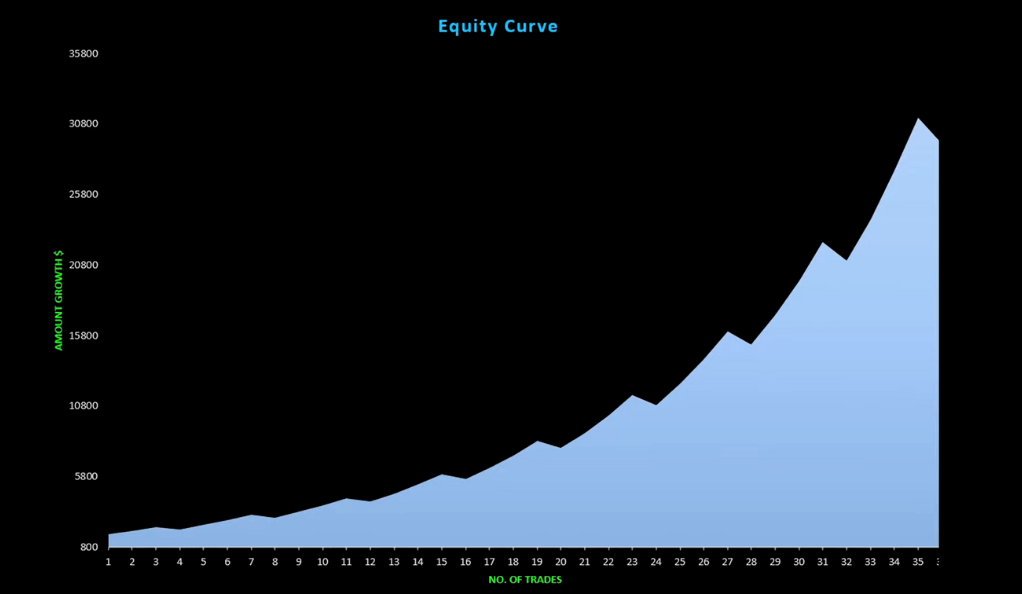
This information enables traders to make informed decisions about their strategies, adjust risk management techniques, and optimize their trading approach for long-term success. The equity curve serves as a valuable performance metric, helping traders track their progress and make data-driven adjustments to enhance their trading outcomes.
Exploring the Oscillator Matrix Indicator
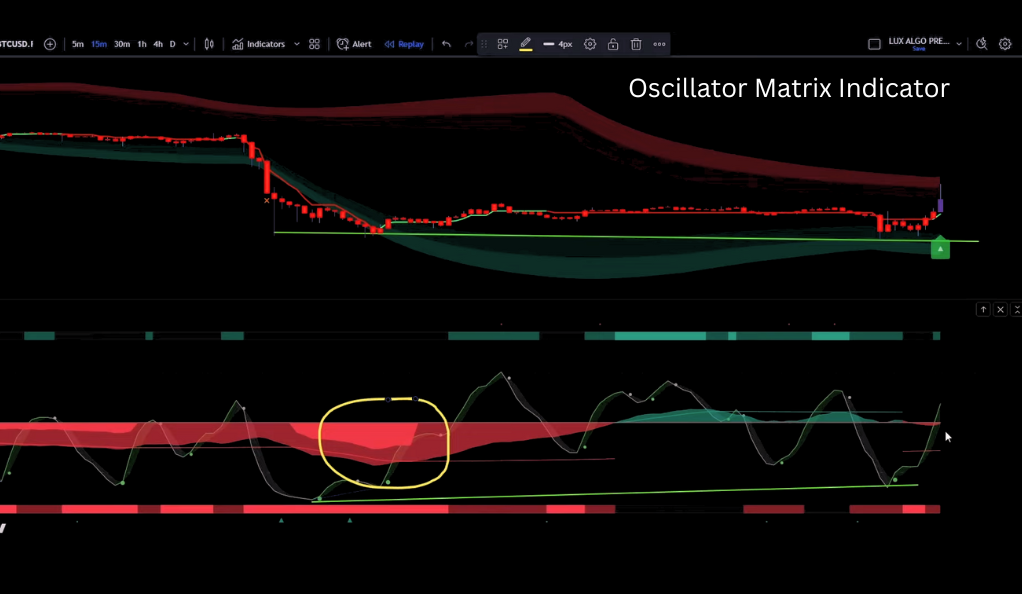
Reveals its function as a complementary tool to the Dynamic Support and Resistance Indicator. It serves as a confirmation tool, validating the signals given by the dynamic indicator. The Oscillator Matrix Indicator identifies bullish and bearish divergences, providing traders with additional confidence before entering a trade. Its ability to provide a deeper understanding of market momentum makes it an invaluable tool in a trader’s arsenal.
- An Overview of the Oscillator Matrix Indicator
The Oscillator Matrix Indicator is a tool that complements the Dynamic Support and Resistance Indicator. It serves as a confirmation tool, validating the signals given by the Dynamic Support and Resistance Indicator. This indicator helps identify bullish and bearish divergences, providing additional confidence before entering a trade. - The Mechanics of the Oscillator Matrix Indicator
The Oscillator Matrix Indicator works by comparing the price action of a security with its momentum. When the price of a security is moving in one direction and the oscillator is moving in the opposite direction, this is known as a divergence. Bullish divergences occur when the price is moving downwards and the oscillator is moving upwards, indicating a potential upward reversal. Bearish divergences occur when the price is moving upwards and the oscillator is moving downwards, indicating a potential downward reversal. - The Value of the Oscillator Matrix Indicator
The Oscillator Matrix Indicator provides a deeper understanding of market momentum. By identifying divergences between price action and oscillator readings, it can signal potential reversals before they happen. This can give traders a significant edge, allowing them to enter trades at the most opportune moments. Furthermore, it can help traders avoid false signals, increasing the overall effectiveness of their trading strategy.
Crafting a Winning Strategy with Dynamic Support and Resistance and Oscillator Matrix Indicators
Involves using these two powerful tools in tandem. The strategy provides a systematic approach to trading, reducing emotional influence and increasing chances of success. By identifying key market trends and confirming these signals, traders can make more informed decisions, increasing their chances of profitable trades. This strategy also provides clear entry and exit points, simplifying trade management.
The Strategy
The strategy involves using the Dynamic Support and Resistance Indicator and the Oscillator Matrix Indicator in tandem. For a long trade, several conditions must be met: a green triangle must be printed on the chart, the trend catcher line must be green, and the oscillator should print a bullish divergence. Additionally, the money flow should be in the green or at least not in deep red. The stop loss is set at the recent swing low or below the reversal zones, and profit is booked as soon as the trend catcher line turns red.
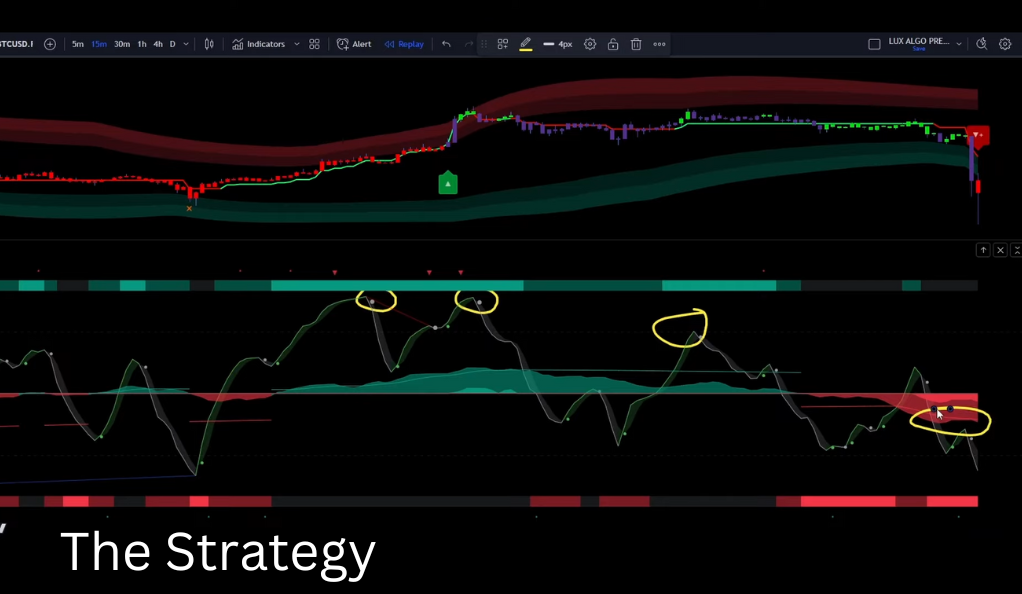
For a short trade, a red triangle must be printed, the trend catcher line must be red, and the oscillator should show bearish signs. The stop loss is set at the recent swing high or above the reversal zone, and profit is booked as soon as the trend catcher line turns green.
The Benefits of this Strategy
The benefits of this strategy are multifaceted and can significantly enhance a trader’s overall success. Firstly, by offering a systematic approach to trading, the strategy helps reduce the impact of emotions on decision-making. Emotions, such as fear and greed, can often cloud judgment and lead to impulsive or irrational trading choices. However, by relying on a structured methodology that combines the Dynamic Support and Resistance Indicator and the Oscillator Matrix Indicator, traders can follow a predefined set of rules and criteria, allowing them to make more objective and disciplined decisions. This systematic approach promotes consistency and reduces the likelihood of impulsive actions based on short-term market fluctuations.
Secondly, the strategy’s effectiveness is derived from the combination of two powerful indicators, which provides traders with a more comprehensive view of the market. The Dynamic Support and Resistance Indicator helps identify key price levels and dynamic support and resistance areas, allowing traders to gauge potential breakouts or reversals. The Oscillator Matrix Indicator, on the other hand, offers insights into market momentum and validates the signals generated by the dynamic indicator. By utilizing both indicators in tandem, traders can gain a deeper understanding of the market dynamics and potential trends, enabling them to make more informed and well-timed trading decisions.
Additionally, the strategy’s clear entry and exit points further contribute to its advantages. With predefined criteria for entering a trade, such as the presence of specific chart patterns or divergences, traders can confidently identify opportune moments to initiate a trade. Likewise, the strategy’s predefined exit points, such as when the trend catcher line changes color, help traders manage their trades effectively and book profits at appropriate levels. These clear entry and exit points eliminate ambiguity and provide a structured framework for trade management, enhancing overall trading efficiency.
Conclusion
One such tool that can make a significant difference in trading success is the Dynamic Support and Resistance Indicator. This tool provides a real-time, adaptive approach to identifying key price levels. Unlike static lines, this indicator adjusts to market volatility, creating a channel around a security’s price to visually represent its typical range. This dynamic nature provides traders with accurate, timely signals, aiding in predicting whether a breakout will sustain or a reversal is imminent.
The Oscillator Matrix Indicator is another powerful tool that complements the Dynamic Support and Resistance Indicator. It serves as a confirmation tool, validating the signals given by the Dynamic Support and Resistance Indicator. This indicator helps identify bullish and bearish divergences, providing additional confidence before entering a trade.
When used together, the Dynamic Support and Resistance Indicator and the Oscillator Matrix Indicator can provide a powerful trading strategy. The combination of these tools offers a comprehensive view of the market, allowing traders to identify potential trading opportunities and make informed decisions. This can lead to more successful trades and increased profitability.
The key to successful trading lies not only in having the right tools but also in understanding how to use them effectively. With these tools in your trading arsenal, you’re well on your way to mastering the art of trading. Remember, the journey to becoming a successful trader is not just about having the right tools, but also about understanding the market, developing a solid strategy, and maintaining discipline in your trading. Happy trading!
Ainu Token aims to offer impartial and trustworthy information on cryptocurrency, finance, trading, and shares. However, we don't provide financial advice and recommend users to conduct their own studies and thorough checks.
Comments (No)