Trading in the financial markets can often feel like trying to navigate a labyrinth. However, certain tools and strategies can help traders predict market trends and make informed decisions. One such tool is the concept of divergences. But what exactly are divergences, and how can they be effectively used in trading? Let’s dive in.
Understanding Divergences
In the realm of trading, understanding divergences is crucial for predicting potential market reversals and making informed trading decisions. Divergences occur when there’s a discrepancy between the price trend of an asset and the movement of a specific market indicator. This concept is deeply rooted in the field of technical analysis, which traders use to predict future price movements based on historical data.
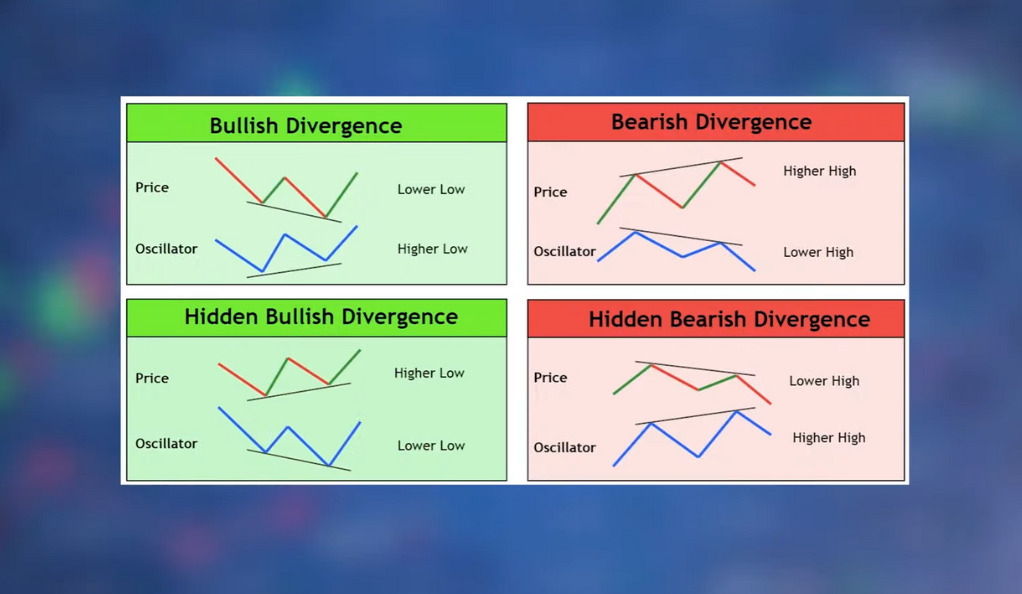
A divergence is essentially a conflict between the price action and the indicator action. For instance, if the price of a stock is making higher highs while the indicator (like the RSI or MACD) is making lower highs, this is considered a bearish divergence. Conversely, if the price is making lower lows while the indicator is making higher lows, this is considered a bullish divergence. These discrepancies often signal a potential market reversal, making divergences a valuable tool for predicting market trends.
Understanding divergences can provide traders with a unique perspective on market conditions, offering insights that can help them make more informed trading decisions. For example, a bearish divergence could signal that the current uptrend may be losing steam and a reversal could be on the horizon. This could prompt a trader to close long positions or even open short positions in anticipation of a downward price movement.
On the other hand, a bullish divergence could indicate that a downtrend is losing momentum and a reversal to the upside could be imminent. This could be a signal for a trader to close short positions or consider opening long positions.
However, it’s important to note that divergences are not foolproof signals of market reversals. They are just one tool among many in a trader’s toolbox and should be used in conjunction with other technical analysis tools and indicators. Furthermore, divergences can sometimes form over extended periods, and the anticipated market reversal may not occur immediately. Therefore, patience and discipline are key when trading based on divergences.
The Role of Momentum Indicators
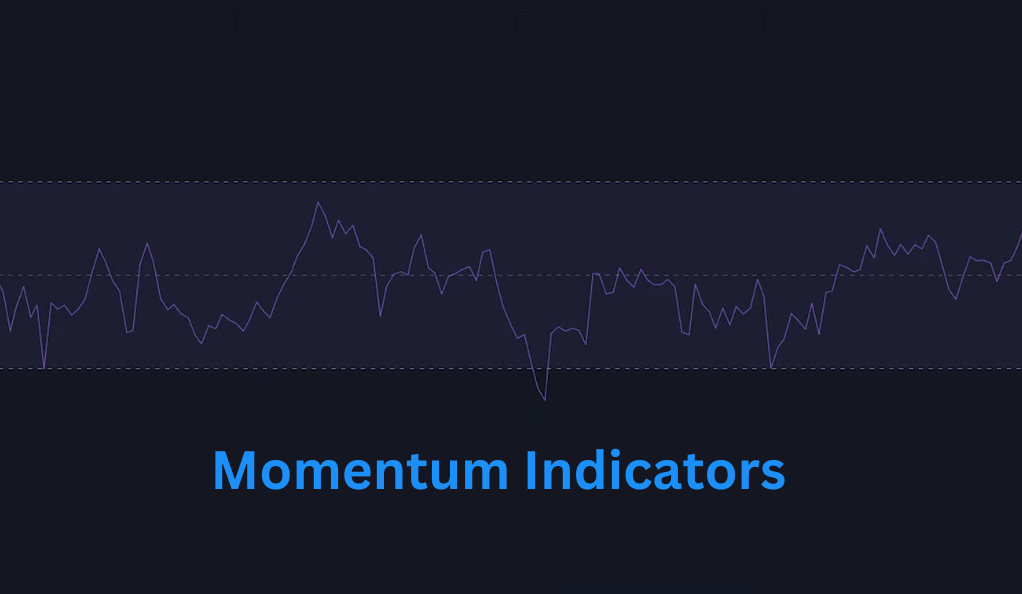
Momentum indicators are essential tools in the identification of divergences. These indicators, which include the Relative Strength Index (RSI), Moving Average Convergence Divergence (MACD), and others, measure the speed and strength of a price movement. When the price of an asset swings and the indicator doesn’t correlate, it’s a sign that the price is losing momentum. This loss of momentum can hint at an impending reversal, either upwards or downwards. By understanding how to interpret these indicators in the context of divergences, traders can gain valuable insights into potential market reversals, providing them with a strategic advantage.
Choosing the Right Momentum Indicator
The choice of momentum indicator can significantly influence the effectiveness of a divergence signal. There are numerous indicators to choose from, each with its own strengths and weaknesses. The key is to choose an indicator that aligns with your trading strategy and risk tolerance. Once you’ve chosen an indicator, it’s crucial to backtest it thoroughly to ensure its effectiveness in identifying divergences.
The Relative Strength Index (RSI) is one of the most commonly used momentum indicators. It measures the speed and change of price movements and is particularly useful for identifying overbought and oversold conditions. When used in divergence trading, the RSI can help traders identify potential market reversals.
The Moving Average Convergence Divergence (MACD) is another popular momentum indicator. It tracks the relationship between two moving averages of a security’s price and can be used to identify potential buy and sell signals. When the MACD line crosses above the signal line, it generates a bullish signal, and when it crosses below, it generates a bearish signal. In divergence trading, a discrepancy between the MACD line and the price action can signal a potential market reversal.
The Stochastic Oscillator is another momentum indicator that can be used in divergence trading. It compares a particular closing price of a security to a range of its prices over a certain period. The Stochastic Oscillator generates readings between zero and 100, with readings over 80 considered overbought and readings under 20 considered oversold. In divergence trading, if the price forms a new high or low that isn’t confirmed by the Stochastic Oscillator, it can signal a potential market reversal.
Choosing the right momentum indicator is a matter of personal preference and should align with your overall trading strategy. Some traders may prefer the simplicity of the RSI, while others may prefer the more detailed insights provided by the MACD or the Stochastic Oscillator. The key is to understand how each indicator works, how it fits into your trading strategy, and how it can help identify divergences.
The Importance of Backtesting
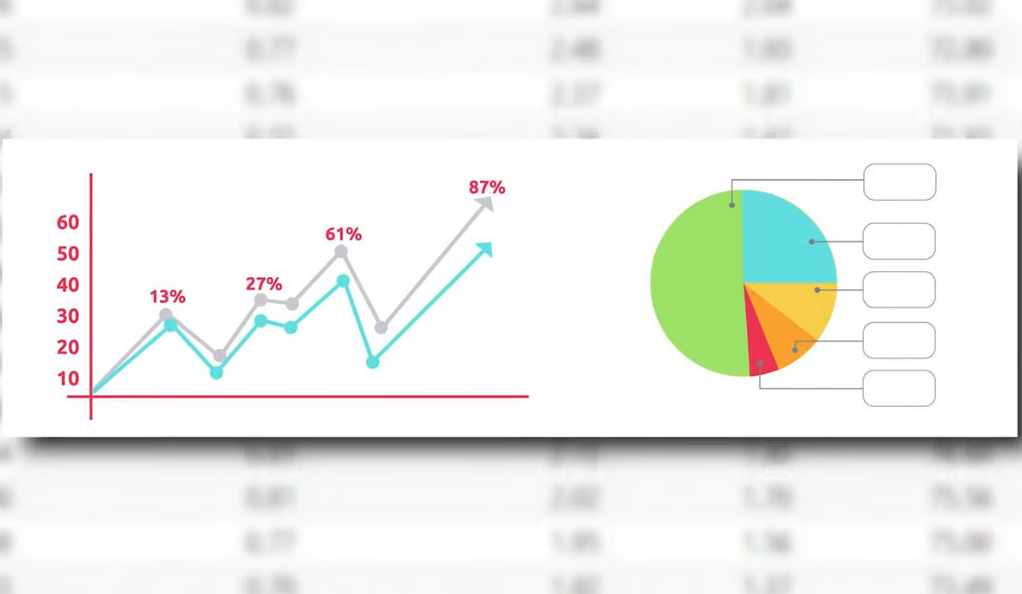
Backtesting is a critical component in the development and refinement of any trading strategy, including those based on divergences. It involves applying a trading strategy to historical market data to assess its theoretical performance. This process can provide traders with valuable insights into how a strategy would have performed in the past, which can be indicative of its potential future performance.
One of the primary benefits of backtesting is that it allows traders to evaluate a strategy’s profitability before risking any actual capital. By seeing how a strategy would have performed under different market conditions, traders can assess whether it has the potential to be profitable in the future. This can help traders avoid strategies that are unlikely to be successful, saving them time and money.
Backtesting also provides an opportunity to assess a strategy’s risk level. By analyzing a strategy’s historical trades, traders can determine how much risk the strategy typically takes on. This can help traders choose strategies that align with their personal risk tolerance. For instance, a trader who is risk-averse might opt for a strategy that has historically resulted in smaller, more consistent gains, while a risk-tolerant trader might prefer a strategy that has the potential for larger, albeit less consistent, returns.
In addition to evaluating profitability and risk, backtesting can also help traders fine-tune their strategies. By analyzing the outcomes of individual trades, traders can identify any weaknesses in their strategy and make necessary adjustments. For example, if a strategy consistently generates losses under certain market conditions, a trader might modify the strategy to avoid trading under these conditions in the future.
While backtesting can be a powerful tool, it’s important to remember that past performance is not always indicative of future results. Market conditions can change, and a strategy that was successful in the past may not necessarily be successful in the future. Therefore, backtesting should be used as one tool among many in a trader’s toolbox, rather than being relied upon exclusively.
Back Test Data
Back Test Data refers to historical data used by traders and financial analysts to evaluate the performance of a trading strategy or financial model. This data, which can include price movements, volume, volatility, and other market conditions, is used to simulate trades and assess how a strategy would have performed in the past. By analyzing Back Test Data, traders can gain insights into the potential profitability, risk level, and overall effectiveness of a strategy. However, it’s important to remember that past performance is not always indicative of future results, and backtesting should be used as one tool among many in a trader’s toolbox.
Maximizing Profit Potential
While divergences can provide valuable insights into potential market reversals, trading solely based on divergences may not always yield high profits. This is where the integration of other trading techniques becomes crucial. By combining divergences with these techniques, traders can create a more robust and comprehensive trading strategy.
One such technique is price action analysis. This involves studying past market data, primarily price and volume, to predict future market behavior. By understanding how price has moved in the past, traders can make educated guesses about how it might move in the future. For instance, if a divergence is spotted at a key level of support or resistance, this could strengthen the case for a potential market reversal.
Support and resistance levels are another important aspect to consider. These levels represent key junctures where the forces of supply and demand meet. When combined with divergences, they can provide powerful signals. For instance, if a bearish divergence occurs at a strong resistance level, it could indicate a strong selling opportunity.
Multi-indicator Divergence
Multi-indicator divergence refers to a situation in trading where multiple technical indicators are showing divergences from the price action simultaneously. This could involve indicators such as the Relative Strength Index (RSI), Moving Average Convergence Divergence (MACD), or Stochastic Oscillator, among others. When these indicators are moving in the opposite direction to the price, it’s a strong signal of a potential market reversal. The advantage of multi-indicator divergence is that it combines the strengths of different indicators, thereby increasing the reliability of the divergence signal. However, as with any trading strategy, it’s essential to use it in conjunction with other analysis tools and not rely on it exclusively.
Conclusion
In conclusion, divergences offer a powerful tool for traders looking to predict market reversals and capitalize on potential trading opportunities. By understanding divergences, choosing the right momentum indicator, backtesting strategies, and leveraging advanced trading tools, traders can harness the power of divergences to enhance their trading performance. Remember, the financial markets may seem like a labyrinth, but with the right tools and strategies, you can navigate it successfully.
Ainu Token aims to offer impartial and trustworthy information on cryptocurrency, finance, trading, and shares. However, we don't provide financial advice and recommend users to conduct their own studies and thorough checks.
Comments (No)