In the fast-paced and volatile world of cryptocurrency trading, having a robust and reliable strategy is crucial for success. Among the myriad of strategies available, one that has recently caught the attention of traders is the “15 Minute Trading Strategy: Pullback Magnetic System Vs The Best Bollinger Bands Secret (100% New)”. This innovative approach, discovered on the “Online Trading Signals (Scalping Channel)”, has piqued the interest of many due to its simplicity and potential effectiveness.
The strategy operates on a 15-minute timeframe, specifically focusing on the Bitcoin chart. What sets this strategy apart is its minimalistic approach, requiring only one indicator: the Bollinger Bands. The Bollinger Bands, a popular tool among traders, provides a relative definition of high and low prices of a market. By using this single indicator, the strategy aims to identify potential buy and sell signals, making it an attractive option for traders looking for a straightforward yet effective trading strategy.
Understanding the Bollinger Bands
The Bollinger Bands are a widely used tool in technical analysis, providing traders with a relative understanding of high and low prices in the market. Developed by John Bollinger, this indicator encompasses a simple concept: prices are high at the upper band and low at the lower band. This understanding allows traders to identify potential overbought and oversold conditions, which can be instrumental in making informed trading decisions.
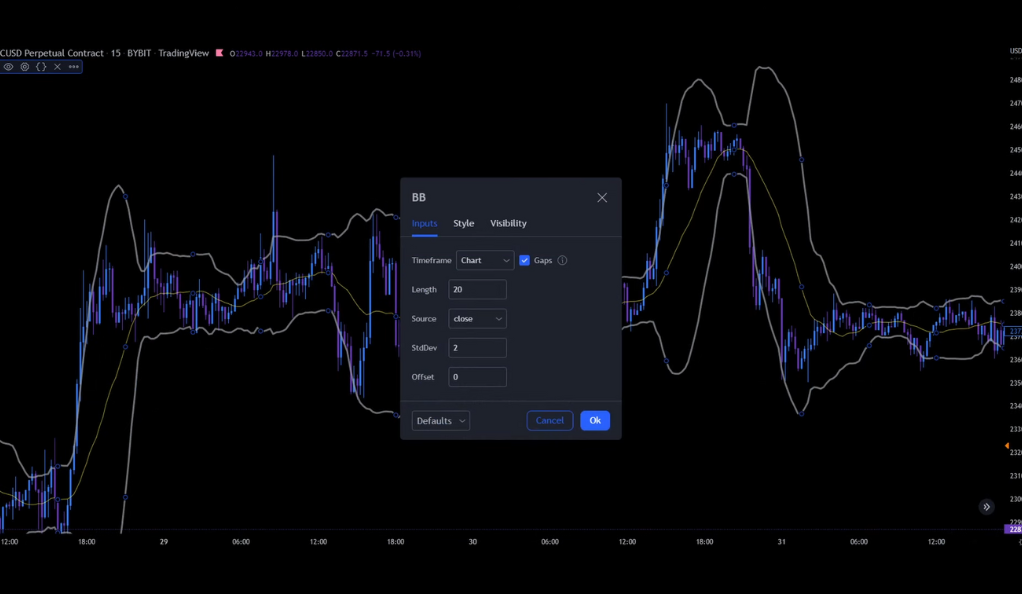
Pullback Magnetic System Vs The Best Bollinger Bands Secret (100% New)”, the Bollinger Bands play a pivotal role. The default settings for this indicator are typically 20, 2, and 0, representing the period, standard deviation, and the moving average type respectively. This strategy specifically looks for long positions, meaning it aims to profit from rising prices. By leveraging the insights provided by the Bollinger Bands, traders can identify potential entry points for long positions, aiming to capitalize on upward price movements.
The Three Rules of the Strategy
The “15 Minute Trading Strategy: Pullback Magnetic System Vs The Best Bollinger Bands Secret (100% New)” operates on three core rules. First, it identifies potential entry points when the price touches the lower Bollinger Band, indicating an oversold condition. Second, it waits for a bullish candle to form as a confirmation of the upward price movement. Finally, it sets a stop loss below the recent swing low and a take profit at the upper Bollinger Band, aiming to capitalize on the full potential of the price swing. These rules collectively form the backbone of this strategy, guiding traders in making informed decisions.
Rule 1: The Upper Bollinger Band
The first rule revolves around the upper Bollinger Band. This part of the Bollinger Bands is a significant area of interest for traders as it can provide valuable insights into market conditions. When a candle touches, crosses, or closes above this band, it’s a key signal that traders need to pay attention to.
This occurrence indicates a potential overbought condition in the market. In trading terms, an overbought condition occurs when the price of an asset has risen significantly and may be due for a correction or reversal. This is because the asset may be considered overvalued, and the price could fall as traders start selling off. Therefore, when the candle behaves as described with the upper Bollinger Band, it could signal an impending price reversal, providing a potential trading opportunity.
Rule 2: The Lower Bollinger Band
The second rule focuses on the lower Bollinger Band. This band, like its upper counterpart, serves as a critical indicator of market conditions. Traders are advised to look for a candle that has crossed the lower Bollinger Band by 50% or more, either with the body or the wick, or one that has closed below it.
This behavior of the candle in relation to the lower Bollinger Band suggests a potential oversold condition in the market. In trading parlance, an oversold condition occurs when the price of an asset has fallen sharply and may be due for a rebound or reversal. This is because the asset may be considered undervalued, and the price could rise as traders start buying in. Therefore, when a candle interacts with the lower Bollinger Band as described, it could signal an upcoming price reversal, presenting a potential trading opportunity.
Rule 3: The Middle Band
The third rule pertains to the middle Bollinger Band. This band, also known as the basis, is a simple moving average that serves as a foundation for the upper and lower Bollinger Bands. It provides a baseline from which the price deviations are measured.
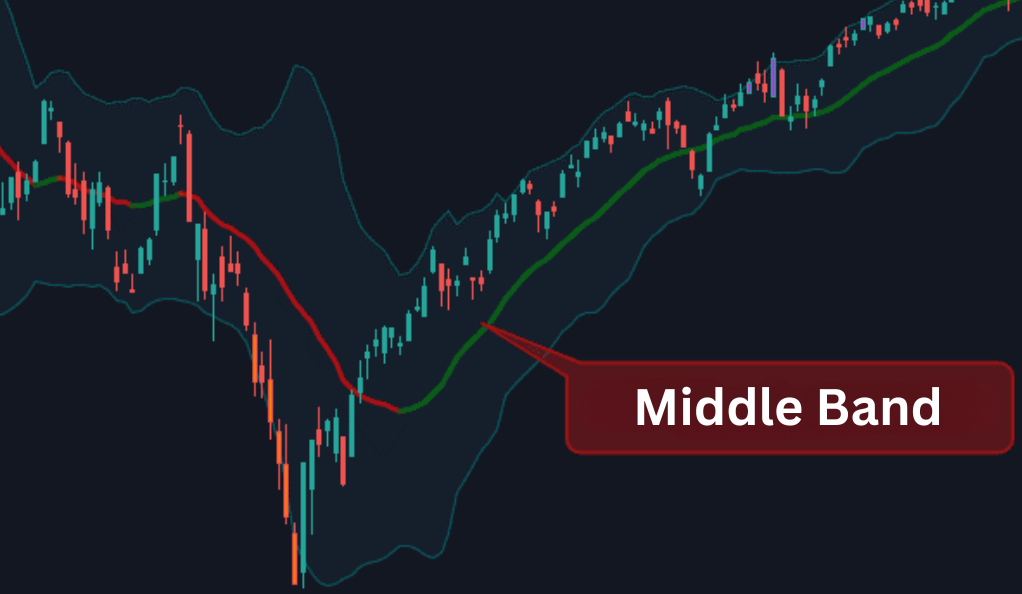
Traders are advised to look for a candle that has bounced off this middle band. This bounce can be a significant signal in the market, indicating a potential shift in price direction. The middle band acts as a line of support or resistance, and a bounce off this line can suggest that the market is respecting this level. This could provide a potential trading opportunity, as it may signal a continuation of the current trend or a possible reversal, depending on the overall market context.
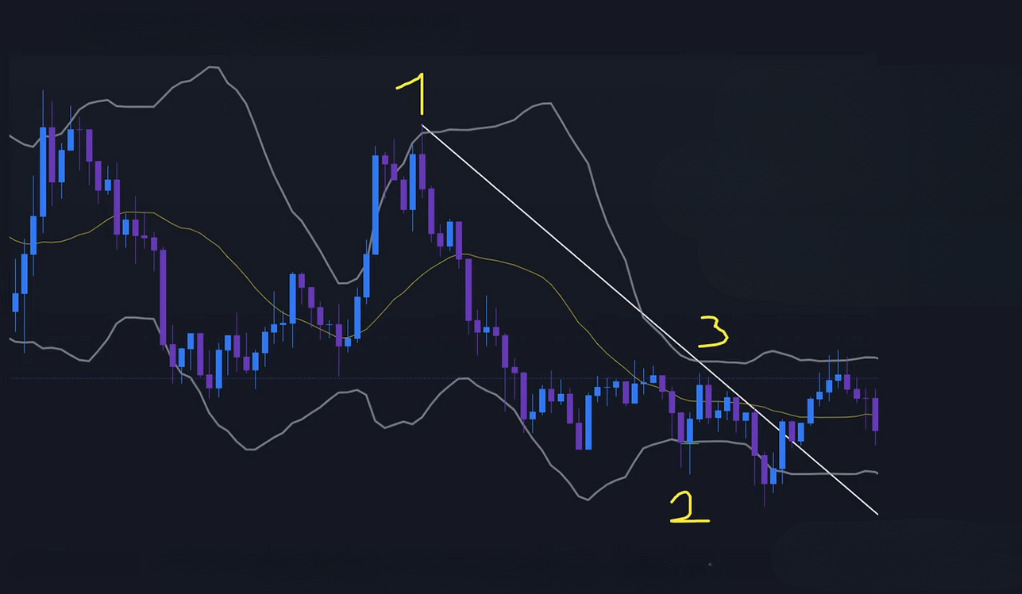
Drawing the Trendline
Drawing the trendline is a crucial step in the “15 Minute Trading Strategy: Pullback Magnetic System Vs The Best Bollinger Bands Secret (100% New)”. After the conditions related to the Bollinger Bands are met, a trendline is drawn from point 1 to point 3. This line serves as a visual representation of the trend, providing a clear picture of the market’s direction.
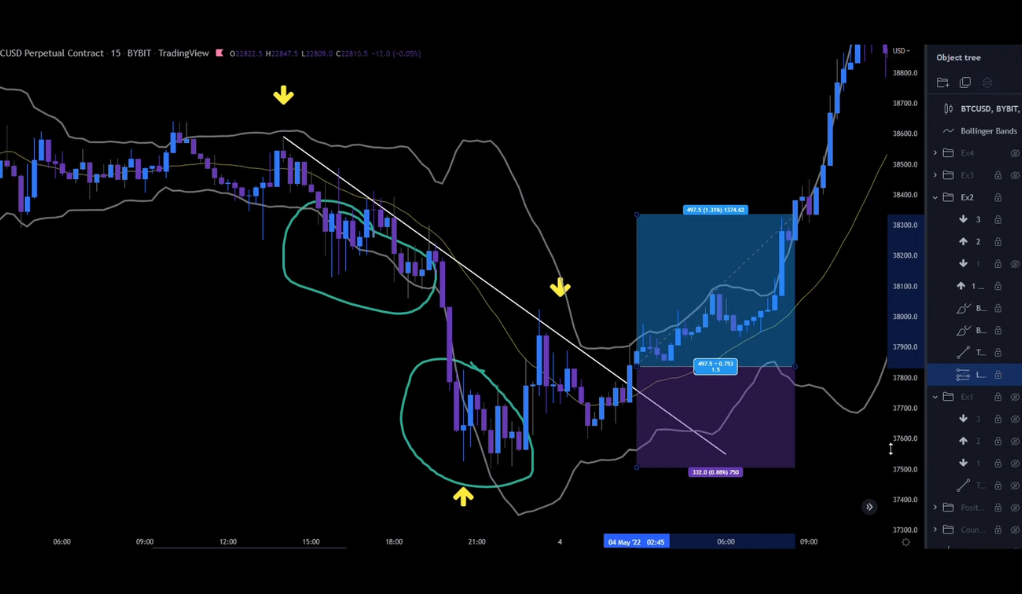
The trendline can cross the upper wicks of the candles on the way down, but it should not cross a candle body. This rule is important as it ensures the integrity of the trendline. The trendline, in essence, serves as a guide for traders, helping them make informed decisions about their trades. It provides a visual cue for potential entry and exit points and can be a powerful tool in a trader’s arsenal.
Awaiting the Break
The next step is to patiently await a confirmed break of the trendline. This is a critical moment in the strategy, as it can signal a significant shift in market dynamics. A break of the trendline can indicate that the prevailing trend may be changing, providing a potential trading opportunity.
A confirmed break is defined as a bullish candle that has not only broken the trendline but also closed above it. This specific condition is crucial as it provides confirmation of the trend reversal. If this condition is met, it signals the right time to enter a long position. This step underscores the importance of patience and precision in trading, as acting prematurely or without confirmation can lead to potential losses.
Setting the Stop Loss and Target
Setting the stop loss and target is a crucial step. This is where risk management comes into play, a vital aspect of any successful trading strategy. The stop loss is typically placed right below the lower Bollinger Band. This placement ensures that if the market moves against the trade, the loss is limited and controlled.
The target, on the other hand, is set with a risk to reward ratio from 1 to 1.5. This means that for every unit of risk taken (the distance from the entry point to the stop loss), the potential reward is 1 to 1.5 units. This ratio ensures that potential profits are maximized while keeping the risk in check. It’s a delicate balance that, when maintained, can lead to consistent trading success over time.
The Results of Backtesting
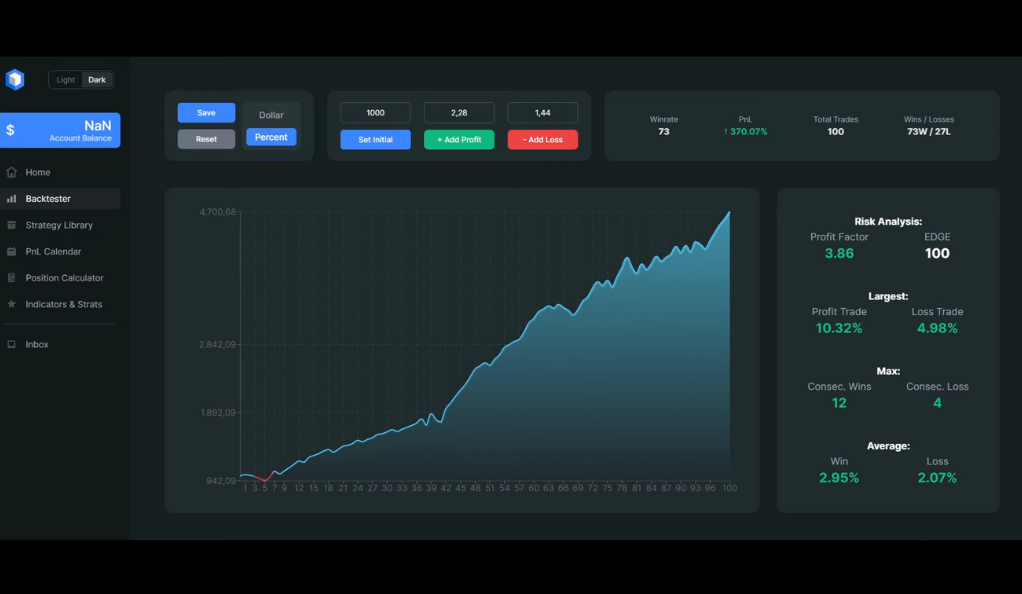
The 15 Minute Trading Strategy underwent rigorous backtesting, with 100 iterations conducted to assess its effectiveness. The results were promising, showcasing a win rate of 73%. In terms of profitability, the strategy yielded around 3700 USD in a span of 3 months. These results underscore the potential effectiveness of the strategy, demonstrating its capacity to generate consistent returns when applied correctly.
The Future of the Strategy
In the next video, the presenter plans to backtest the strategy again, but this time taking 50% profit at a risk to reward ratio from 1 to 1.5, and then moving the stop loss above entry and moving it up from level to level to let the winners ride until they get stopped out. This modification could potentially increase profits.
Conclusion
The 15 Minute Trading Strategy is a promising strategy for cryptocurrency traders. It provides a systematic approach to trading, minimizing risks, and maximizing potential profits. However, like all trading strategies, it requires careful study, understanding, and practice. Always remember, in the world of trading, there are no guarantees, only probabilities.
Ainu Token aims to offer impartial and trustworthy information on cryptocurrency, finance, trading, and shares. However, we don't provide financial advice and recommend users to conduct their own studies and thorough checks.
Comments (No)