In the world of trading, the Heiken Ashi indicator stands out as a powerful tool that is often overlooked by many traders. This Japanese technique, with its unique approach to charting, can be a game-changer when used correctly. Heiken Ashi charts display prices in a different way compared to traditional candlestick charts. Instead of showing the open, high, low, and close prices for each period, Heiken Ashi charts use a modified formula to calculate each candle’s values. These modified values help filter out market noise and provide a smoother representation of price trends.
By using Heiken Ashi charts, traders can gain a clearer view of the market’s direction and momentum. The indicator’s ability to reduce noise and emphasize trends can help traders make more informed trading decisions. For example, Heiken Ashi charts can highlight trend reversals by displaying clear and consistent bullish or bearish candlesticks. Additionally, the indicator can help traders stay in a trend for a longer duration by filtering out temporary price fluctuations. By incorporating the Heiken Ashi indicator into their trading strategy, traders can enhance their ability to identify trends, improve market timing, and ultimately increase their chances of making profitable trades.
Understanding Heiken Ashi
Heiken Ashi charts are constructed using a modified formula that calculates each candle’s values based on the average price of the previous candle. The formula takes into account the open, high, low, and close prices, and uses them to determine the average price for each period. The resulting Heiken Ashi candles are represented by bullish or bearish bodies, depending on whether the average price is higher or lower than the previous period’s average price.
By eliminating the noise caused by temporary price fluctuations, Heiken Ashi charts provide traders with a smoother representation of price trends. This allows them to identify the underlying market direction more easily and make more accurate predictions about future price movements. Moreover, the distinct color-coding of Heiken Ashi candles simplifies the interpretation of the chart, making it particularly useful for traders who prefer visual analysis.
Traders can use Heiken Ashi charts in various ways to enhance their trading strategies. For instance, they can use the presence of a series of bullish or bearish candles to confirm the strength of a trend. Additionally, traders can look for reversal patterns, such as a transition from a series of bullish candles to bearish candles or vice versa, to anticipate potential trend changes. By incorporating Heiken Ashi into their technical analysis, traders gain a valuable perspective on price trends and can make more informed trading decisions.
Identifying Trends with Heiken Ashi
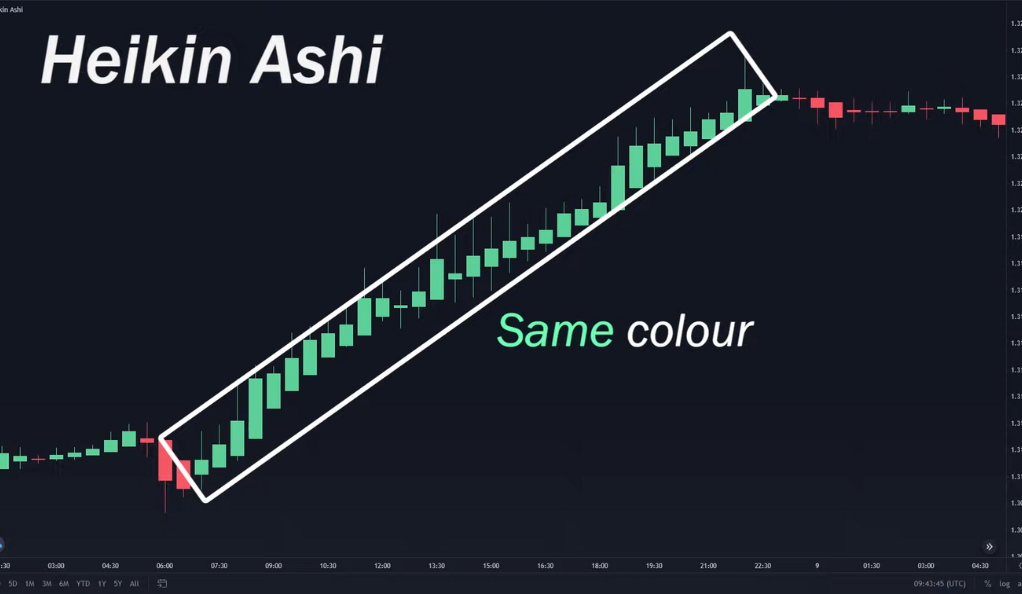
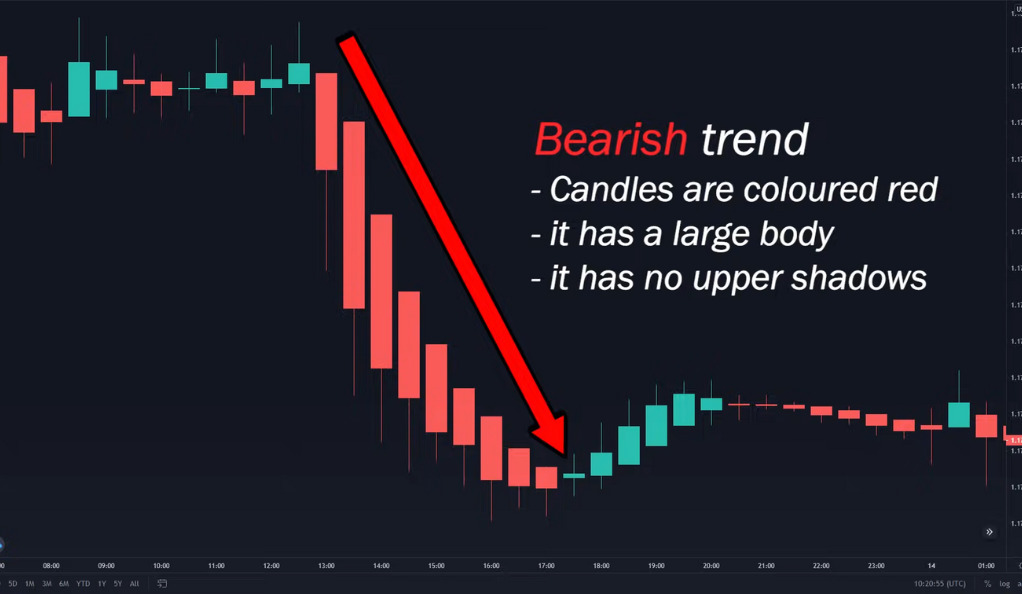
Heiken Ashi charts excel at identifying trends due to their unique representation of price data. Traders can rely on the color-coded candles to quickly determine the prevailing market sentiment. When the candles consistently show a specific color, it signals a strong trend in that direction. The absence of shadows in the candles further emphasizes the dominance of the trend, as it indicates minimal price retracements or pullbacks.
Moreover, Heiken Ashi charts can assist traders in identifying trend reversals. As the market sentiment shifts, the color of the candles changes accordingly. For example, a transition from a series of green candles to red candles indicates a potential reversal from a bullish trend to a bearish one. By closely monitoring these color changes, traders can proactively adjust their trading strategies and take advantage of emerging trends or reversals.
By incorporating Heiken Ashi charts into their technical analysis, traders gain a reliable tool for trend identification. This enables them to align their trades with the prevailing market sentiment and improve their overall trading accuracy. Whether it’s capturing the momentum of a strong trend or spotting potential trend reversals, Heiken Ashi provides traders with a valuable visual representation that enhances their decision-making process.
Detecting Reversals: The Power of the Doji
In addition to its effectiveness in identifying trends, the Heiken Ashi chart provides traders with valuable insights into potential price reversals through the recognition of doji candles. A doji candle, with its small body and two shadows, represents a period of market indecision. It occurs when the open and close prices are very close to each other, resulting in a nearly flat candle. This signifies a balance between buyers and sellers, suggesting a potential shift in the market sentiment.
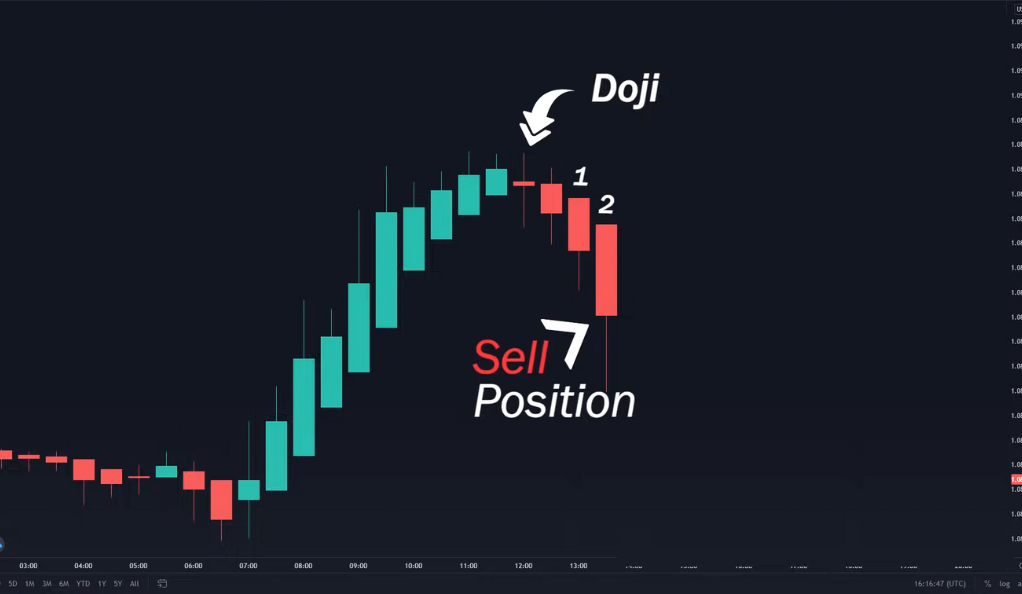
To utilize the power of the doji candle in detecting reversals, traders should pay attention to its occurrence within an established trend. When a doji appears, it signals a pause or a temporary consolidation in the ongoing trend. However, traders should exercise caution and wait for confirmation before making any trading decisions. Confirmation is achieved by observing the subsequent price action. Traders should look for two consecutive large candles of the opposite color of the prevailing trend. For example, after a series of bullish candles, the appearance of a doji followed by two consecutive bearish candles provides a strong indication of a potential trend reversal. This entry signal prompts traders to consider adjusting their positions or even initiating trades in the direction of the emerging reversal.
By leveraging the power of the doji within the Heiken Ashi chart, traders can anticipate and capitalize on potential trend reversals. This technique allows traders to stay ahead of market shifts and adjust their trading strategies accordingly. However, it is important to combine the identification of doji candles with other technical analysis tools and indicators to enhance the reliability of reversal signals and minimize false alarms.
Combining Heiken Ashi with the Stochastics Indicator
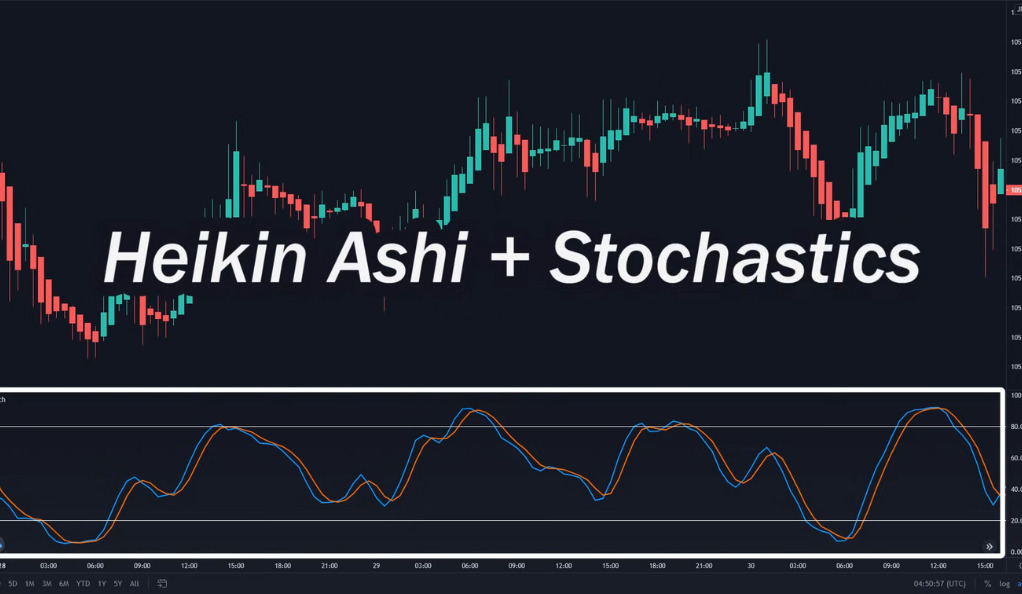
To maximize the potential of the Heiken Ashi indicator, traders often integrate it with the Stochastics indicator, adding an additional layer of confirmation to their analysis. The Stochastics indicator is commonly used to identify overbought and oversold conditions in the market, indicating when a price may be due for a reversal. By combining the insights provided by the Stochastics indicator with the visual cues of the Heiken Ashi chart, traders can make more informed and reliable trading decisions.
When utilizing this combined approach, traders should be aware that relying solely on overbought or oversold readings from the Stochastics indicator can lead to false signals. Instead, traders should use these points as a complement to the Heiken Ashi’s signals. For example, if the Heiken Ashi chart displays a series of bearish candles indicating a downtrend, traders can look for confirmation from the Stochastics indicator showing overbought levels. This convergence of signals reinforces the likelihood of a potential price reversal and increases the trader’s confidence in taking action.
By combining the Heiken Ashi chart with the Stochastics indicator, traders can gain a more comprehensive understanding of market conditions. This integrated approach helps traders filter out false signals and enhances their ability to identify high-probability trade setups. It is important, however, for traders to experiment with different parameters and test the effectiveness of this combination in their specific trading strategies and market conditions.
The Art of Trading: A Balancing Act
The art of trading goes beyond the technical aspects of using indicators and strategies. It involves developing a deep understanding of the market dynamics, mastering risk management, and continuously honing one’s skills. While the Heiken Ashi indicator provides valuable insights, it is crucial for traders to conduct thorough research and analysis to complement its signals. Market conditions can change rapidly, and traders must stay updated with relevant news, economic indicators, and other factors that can impact price movements.
Successful trading also requires a keen sense of intuition and the ability to adapt to different situations. Traders must strike a balance between following the signals provided by indicators like Heiken Ashi and trusting their own judgment based on their experience and market knowledge. They should not rely solely on a single indicator or strategy but instead incorporate multiple tools and techniques to validate their trading decisions.
Furthermore, risk management is an essential component of trading. Traders should carefully assess their risk tolerance, set appropriate stop-loss levels, and manage their positions effectively. It is crucial to remember that losses are an inherent part of trading, and no strategy can guarantee profits in every trade. Continuous learning, staying disciplined, and maintaining emotional control are key attributes of successful traders.
Conclusion
In the ever-evolving world of trading, the Heiken Ashi indicator stands out as a valuable asset for traders. Its unique representation of price data through color-coded candles and reduced market noise offers a fresh perspective on market trends. By incorporating Heiken Ashi into their trading strategy, traders gain a tool that can increase their chances of identifying profitable trades and improving market timing. However, it is important to remember that no single indicator or strategy can guarantee success in trading. Traders should approach the market with a comprehensive and well-rounded strategy, combining multiple indicators, risk management techniques, and continuous learning to adapt to changing market conditions.
To truly harness the power of the Heiken Ashi indicator, traders should strive to deepen their understanding of its intricacies and limitations. They should backtest their strategies, analyze historical data, and conduct thorough research to validate the effectiveness of using Heiken Ashi in their specific trading style. Additionally, it is essential to stay updated with the latest market trends, news, and events that may influence price movements. By maintaining a disciplined approach, managing risks effectively, and staying adaptable, traders can unlock the true potential of the Heiken Ashi indicator and improve their overall trading performance.
Ainu Token aims to offer impartial and trustworthy information on cryptocurrency, finance, trading, and shares. However, we don't provide financial advice and recommend users to conduct their own studies and thorough checks.
Comments (No)