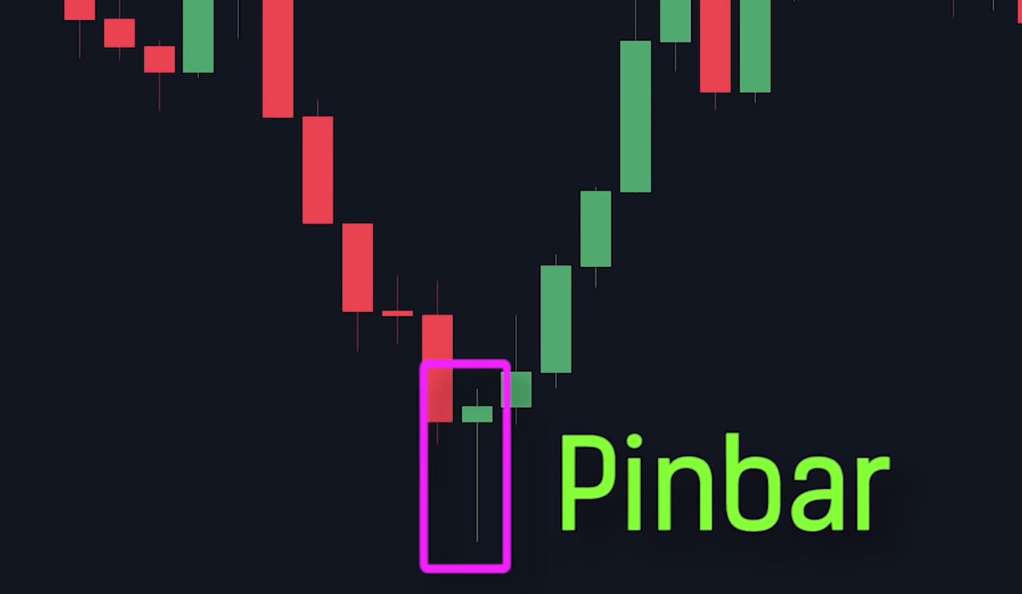
The pin bar is a significant candlestick pattern in trading that predicts price reversals. It consists of a single candlestick with a long tail or wick, indicating a rejection of certain price levels. A bullish pin bar at the bottom of a downtrend suggests a potential upward reversal, while a bearish pin bar at the top of an uptrend indicates a possible downward reversal.
Traders maximize profits by confirming pin bar signals with other indicators like support and resistance levels or trend lines. Risk management through appropriate stop-loss orders is crucial. Mastering the understanding of pin bars and practicing their identification in different market conditions can enhance trading strategies and improve performance.
Understanding the Pin Bar
The pin bar is a popular and widely used candlestick pattern in technical analysis. It is characterized by a distinctive shape that resembles a “pin” or a “hammer.” The pin bar consists of a single candlestick with a long wick or tail, which is much larger than the body of the candle. The wick extends either above or below the body, indicating a rejection of price levels and a potential reversal in the market. The pin bar is considered a strong signal of market sentiment and can provide valuable insights for traders.
When analyzing a pin bar, traders pay close attention to its location in the price chart and its relation to surrounding price action. A bullish pin bar forms at the bottom of a downtrend, signaling a potential reversal and the beginning of an upward move. Conversely, a bearish pin bar forms at the top of an uptrend, suggesting a possible reversal and a downward move. Traders often use additional indicators or confirmation signals, such as support and resistance levels or trend lines, to strengthen the validity of the pin bar signal. By understanding the pin bar and its implications, traders can make more informed decisions and enhance their trading strategies in the financial markets.
What is a Pin Bar?
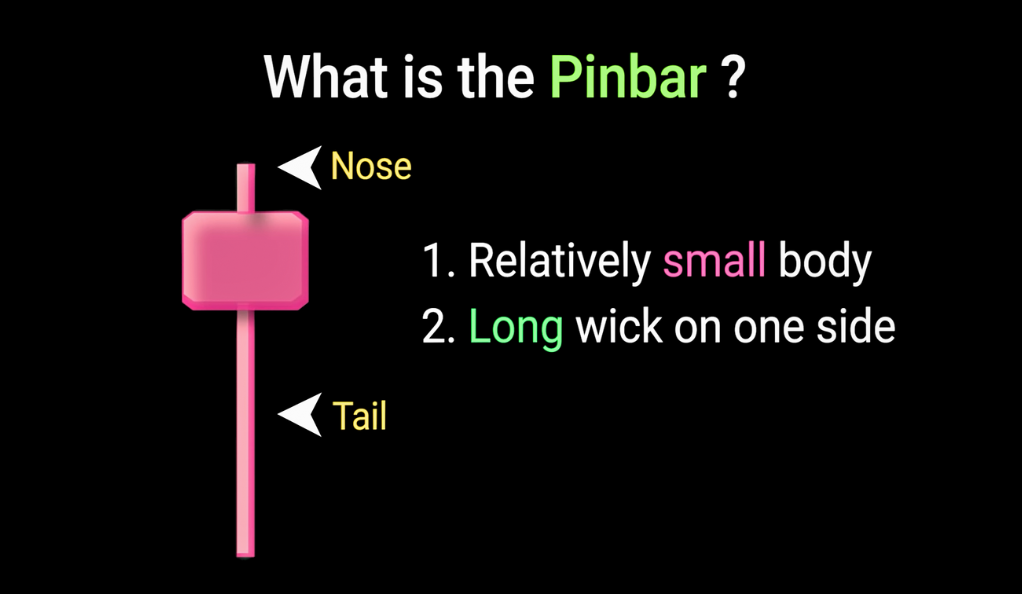
A pin bar is a candlestick pattern that holds significant importance in technical analysis. It is recognized for its ability to signal potential price reversals in the market. The distinguishing feature of a pin bar is its unique structure, consisting of a small body and a long tail or wick on one side. The length of the tail is considerably larger than the body, creating a visual representation of price rejection.
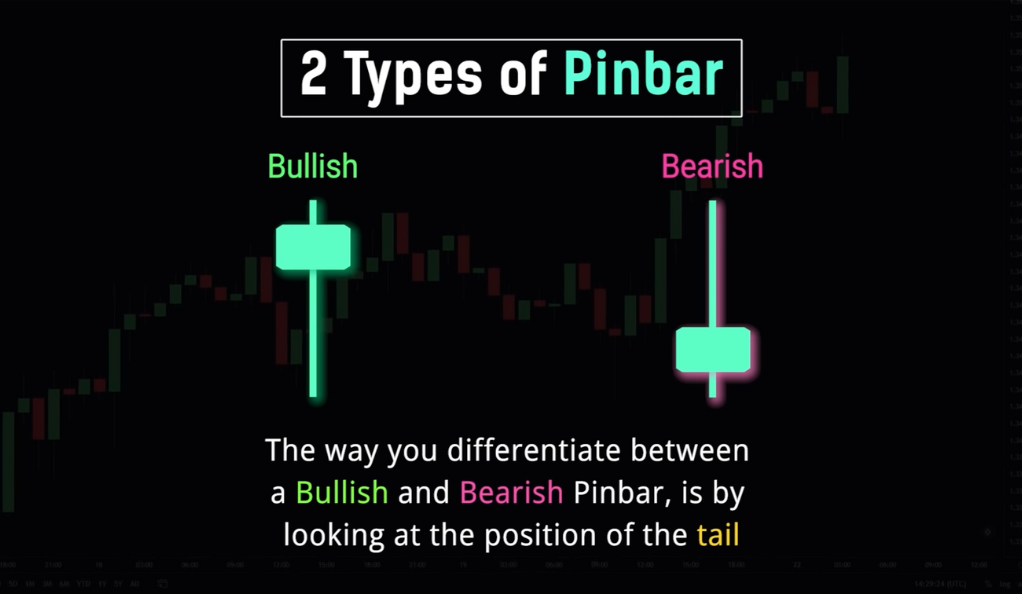
The interpretation of a pin bar depends on its positioning and direction. A bullish pin bar occurs when the long tail extends below the body, indicating a potential reversal from a downtrend to an uptrend. Conversely, a bearish pin bar forms when the long tail is positioned above the body, suggesting a potential reversal from an uptrend to a downtrend. Traders widely use pin bars as a tool to identify key turning points in the market, providing insights into shifts in market sentiment and potential opportunities for profit-taking or position entry. By recognizing and analyzing pin bars, traders can enhance their understanding of market dynamics and make informed trading decisions.
The Significance of the Pin Bar
The pin bar holds significant significance in trading as it represents more than just a pattern; it serves as a signal of market rejection. When observing a price chart, if an uptrend is in progress and a pin bar suddenly appears, it indicates a noteworthy shift in market dynamics. The formation of a pin bar suggests that sellers have entered the market, overpowering the buyers and causing a rejection of the previous upward momentum. This rejection can be interpreted as a potential reversal in the market direction or a temporary pause in the ongoing trend.
The appearance of a pin bar provides valuable insights into market sentiment and the balance of power between buyers and sellers. It signifies a battle between the forces of supply and demand, where one side emerges victorious, resulting in a notable rejection of price levels. Traders often look for confirmation signals or additional technical analysis tools to strengthen the validity of the pin bar signal. This can include examining support and resistance levels, trend lines, or other candlestick patterns that align with the pin bar’s implications. By understanding the significance of the pin bar and its message of market rejection, traders can make informed trading decisions and potentially capitalize on upcoming price reversals or corrections.
Types of Pin Bars
- Bullish Pin Bars
A bullish pin bar is a candlestick pattern that signals a potential upward price reversal in the market. It is characterized by a long tail or wick extending below a small body, indicating a rejection of lower price levels. The formation of a bullish pin bar suggests that buyers have entered the market, overpowering the sellers and potentially leading to a shift from a downtrend to an uptrend. Traders interpret this pattern as a sign of strength and view it as an opportunity to capitalize on potential upward price movements. By recognizing and analyzing bullish pin bars, traders can gain valuable insights into market dynamics and make informed trading decisions to maximize their profits. - Bearish Pin Bars
A bearish pin bar is a candlestick pattern that signifies a potential downward price reversal in the market. It is characterized by a long tail or wick extending above a small body, indicating a rejection of higher price levels. The formation of a bearish pin bar suggests that sellers have entered the market, overpowering the buyers and potentially leading to a shift from an uptrend to a downtrend. Traders interpret this pattern as a sign of weakness and view it as an opportunity to profit from potential downward price movements. By recognizing and analyzing bearish pin bars, traders can gain valuable insights into market dynamics and make informed trading decisions to enhance their profitability and risk management strategies.
The Art of Trading with Pin Bars
The art of trading with pin bars lies in understanding their significance and effectively incorporating them into trading strategies. Pin bars provide valuable insights into potential price reversals and market sentiment. Traders can utilize pin bars as powerful tools to identify key turning points, confirm trade setups, and make informed trading decisions. By mastering the art of trading with pin bars, traders can enhance their ability to spot profitable opportunities and navigate the dynamic nature of financial markets with greater confidence and precision.
- Avoiding Assumptions
As a trader, it’s crucial not to assume a reversal will occur just because a pin bar pattern has appeared. Other supporting factors should be considered. High-quality pin bar setups often occur when the pin bar is formed at a key support or resistance level.
- The Importance of Risk Management
Risk management is a non-negotiable aspect of trading. Even with high-quality setups, there’s always a risk of failure. Remember, never go all in on a single trade and always use proper risk management.
The Role of Confirmation Methods
While the pin bar pattern is highly effective in predicting price reversals, it is crucial for traders to employ additional confirmation methods to enhance the accuracy and reliability of their setups. Relying solely on pin bars can lead to false signals and increased trading risks. Incorporating confirmation methods, such as support and resistance levels, adds an extra layer of analysis that validates the potential trade setup.
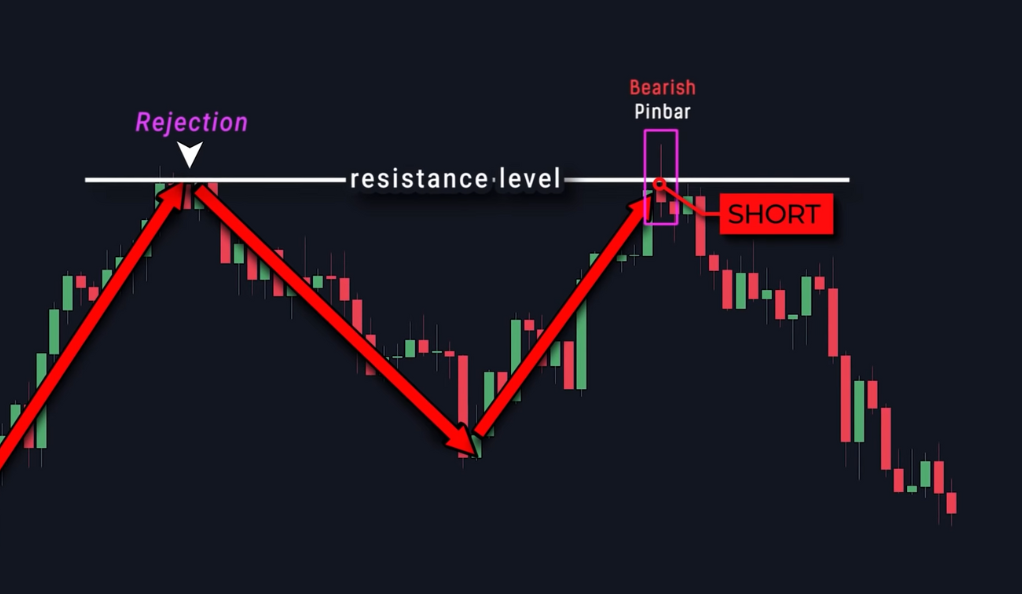
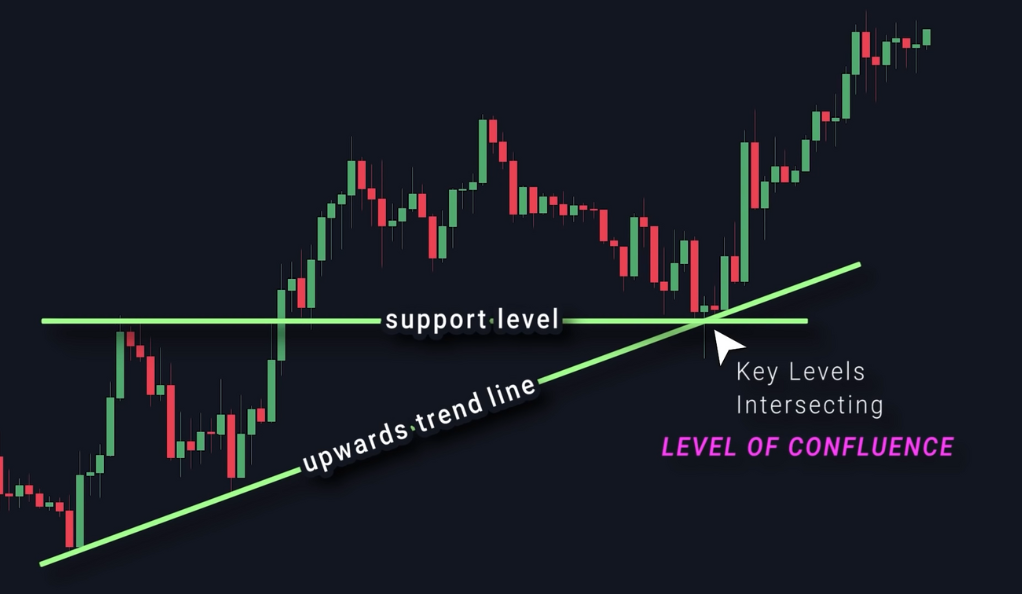
Support and resistance levels are key price levels where buyers and sellers historically converge, causing price reactions. When a pin bar forms near a significant support level, it strengthens the case for a potential reversal, as the buyers are expected to step in and push the price higher. Conversely, when a pin bar forms near a prominent resistance level, it reinforces the likelihood of a downward reversal, as sellers may overpower buyers and drive the price lower. By considering these levels in conjunction with pin bars, traders can increase their win rate by filtering out false signals and focusing on high-probability setups.
Additionally, traders can combine pin bars with other technical indicators, such as moving averages or trend lines, to further confirm the validity of a trade setup. These tools provide additional context and help traders identify the overall market direction. When a pin bar aligns with the prevailing trend or occurs at a key trend line, it strengthens the case for a successful trade. By employing confirmation methods alongside pin bars, traders can make more informed decisions, increase the accuracy of their trades, and ultimately improve their trading performance.
Conclusion
In conclusion, the pin bar pattern serves as a valuable asset in a trader’s toolkit for predicting potential price reversals. However, it is crucial to recognize that the pin bar alone is not a guaranteed solution for profitable trades. Traders should utilize the pin bar pattern in conjunction with other technical analysis tools and strategies to maximize its effectiveness and reduce the risk of false signals.
Proper risk management is paramount when trading with pin bars or any other trading technique. Traders should set appropriate stop-loss orders and manage their position sizes to protect against unfavorable market movements. It is also important to combine the pin bar pattern with other confirmation methods, such as support and resistance levels, trend lines, or additional indicators, to increase the accuracy and reliability of trade setups.
Ainu Token aims to offer impartial and trustworthy information on cryptocurrency, finance, trading, and shares. However, we don't provide financial advice and recommend users to conduct their own studies and thorough checks.
Comments (No)