In the dynamic world of trading, numerous strategies and indicators have emerged to assist traders in making informed decisions. Among these, three indicators have gained significant popularity and are known for their effectiveness: the Stochastic oscillator, the Relative Strength Index (RSI), and the Moving Average Convergence Divergence (MACD). When used in combination, these indicators can provide traders with powerful insights into market trends and potential trading opportunities.
The Stochastic oscillator is a momentum indicator that compares the current closing price of a security to its price range over a specified period. It helps identify overbought and oversold conditions, signaling potential reversals in the market. The RSI, on the other hand, measures the magnitude of recent price changes to determine whether a security is overbought or oversold. It provides traders with a numerical value between 0 and 100, indicating the strength and direction of price movements. Lastly, the MACD combines two moving averages and calculates the difference between them. It generates buy and sell signals based on the convergence and divergence of these moving averages, highlighting potential trend reversals.
Understanding the Stochastic Indicator
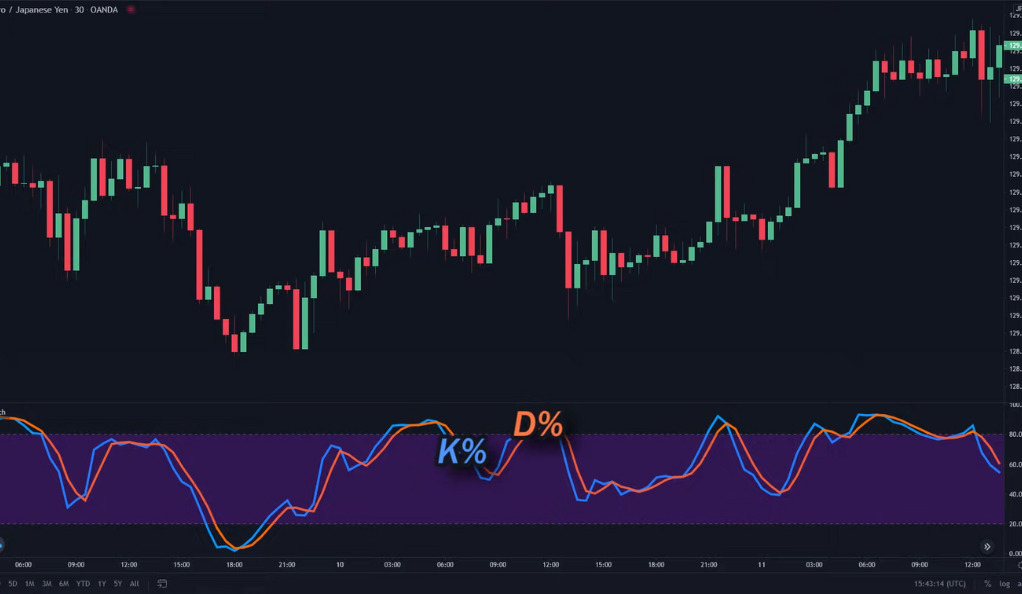
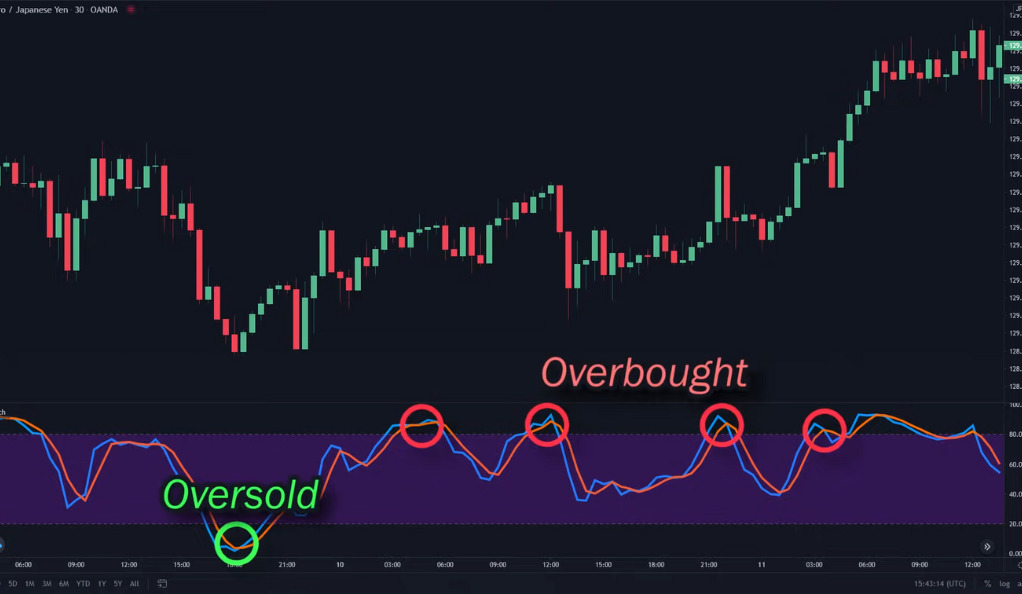
The Stochastic indicator is a widely used momentum oscillator in trading that helps identify overbought and oversold levels in the market. It consists of two lines, the K percentage (blue line) and the D percentage (orange line), which oscillate between 0 and 100. When both lines fall into the oversold region, typically below 20, it suggests that the market may be undervalued and potentially due for a price reversal. This can be seen as a possible signal to buy. On the other hand, when both lines rise into the overbought region, usually above 80, it indicates that the market may be overvalued and could potentially reverse its trend. This can be seen as a potential signal to sell or take profits.
However, relying solely on the Stochastic indicator can lead to false signals and a low win rate. The market doesn’t always reverse its trend immediately after reaching overbought or oversold levels. Therefore, it is important to use the Stochastic indicator in conjunction with other indicators or tools for a more comprehensive analysis. Traders often combine it with trend-following indicators, such as moving averages, to confirm the overall direction of the market. Additionally, using other technical analysis tools like support and resistance levels, chart patterns, or volume analysis can provide further confirmation or divergence signals to strengthen the trading decision. By combining the Stochastic indicator with other tools, traders can enhance the accuracy of their analysis and improve their trading outcomes.
The Role of the RSI
The Relative Strength Index (RSI) is a widely used momentum oscillator that measures the magnitude and speed of price movements. In our strategy, we utilize the RSI in a slightly different manner than its traditional use. Instead of solely focusing on overbought and oversold levels, we employ the RSI as a trend confirmation indicator.
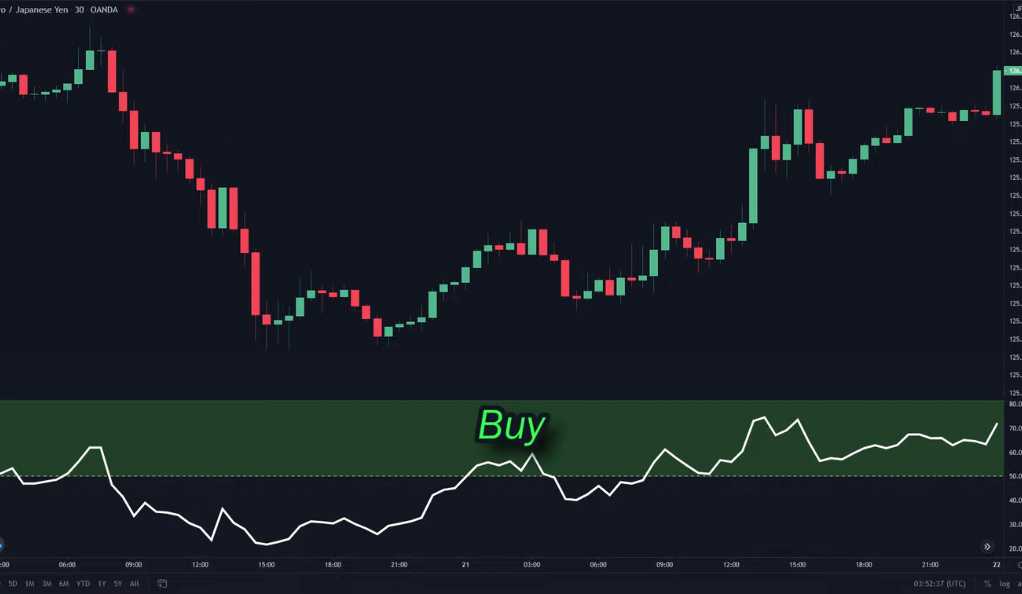
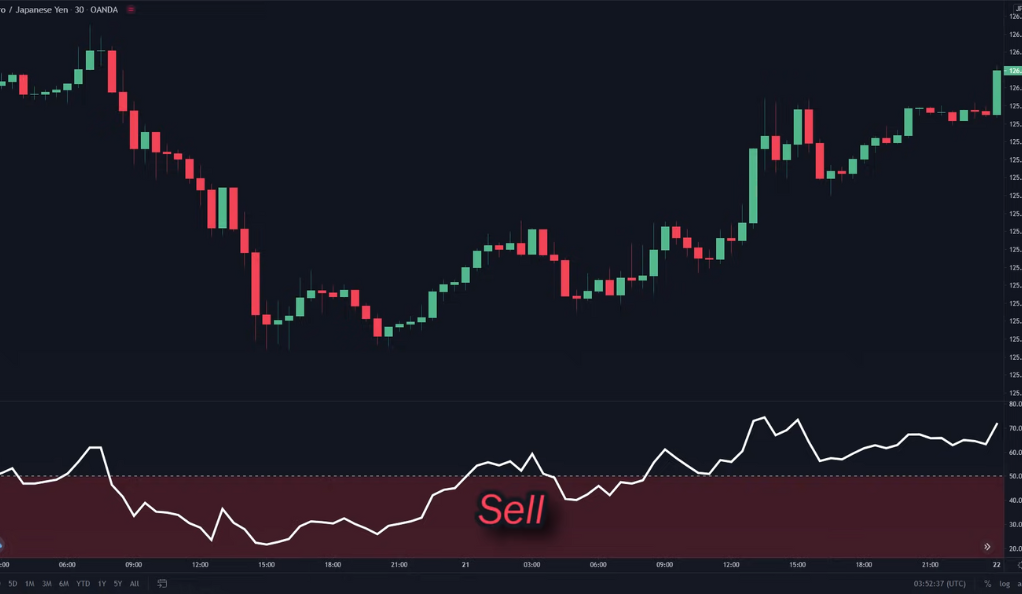
By considering the position of the RSI relative to its middle line, typically at the 50 level, we can determine the prevailing trend in the market. If the RSI is above the middle line, it suggests an uptrend, indicating that the buying pressure is dominant and the market may continue to rise. This can serve as a signal to consider buying or holding positions. Conversely, if the RSI falls below the middle line, it suggests a downtrend, indicating that selling pressure is prevalent and the market may continue to decline. This can provide a signal to consider selling or taking profits.
Incorporating the RSI in this way adds an extra layer of confirmation to our trading signals. It helps us assess the underlying strength or weakness of the trend and assists in avoiding potential false signals. However, it’s important to note that the RSI, like any indicator, is not foolproof and should be used in conjunction with other technical analysis tools and indicators to make well-informed trading decisions. By combining the RSI with other indicators such as moving averages, trendlines, or volume analysis, traders can gain a more comprehensive understanding of the market and improve the accuracy of their trading strategy.
Incorporating the MACD
The Moving Average Convergence Divergence (MACD) is a popular trend-following momentum indicator that helps traders identify potential buy and sell signals. It consists of two main components: the MACD line and the signal line. The MACD line is calculated by subtracting a longer-term exponential moving average (EMA) from a shorter-term EMA, while the signal line is a smoothed average of the MACD line.
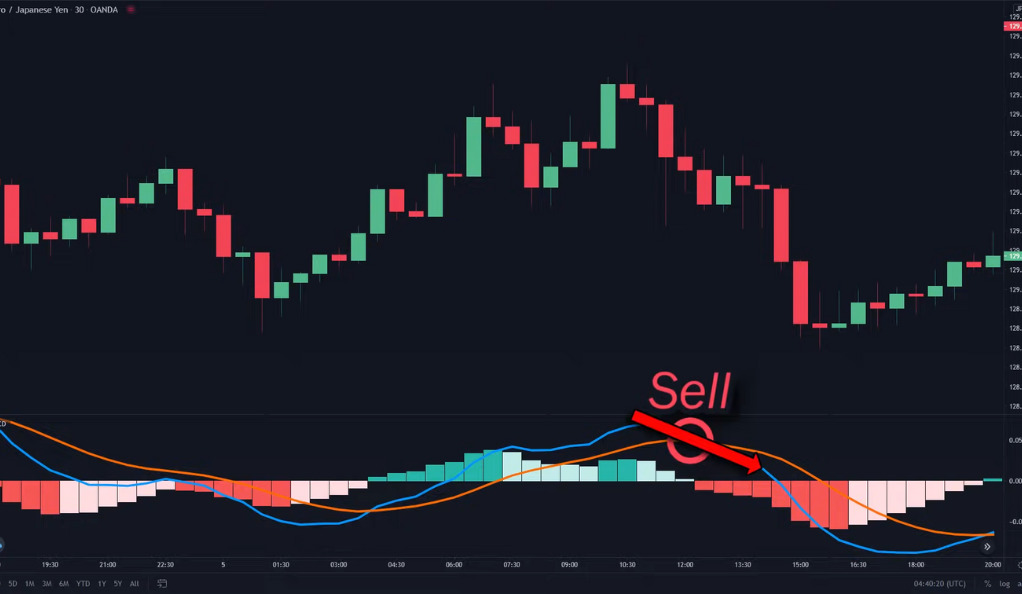
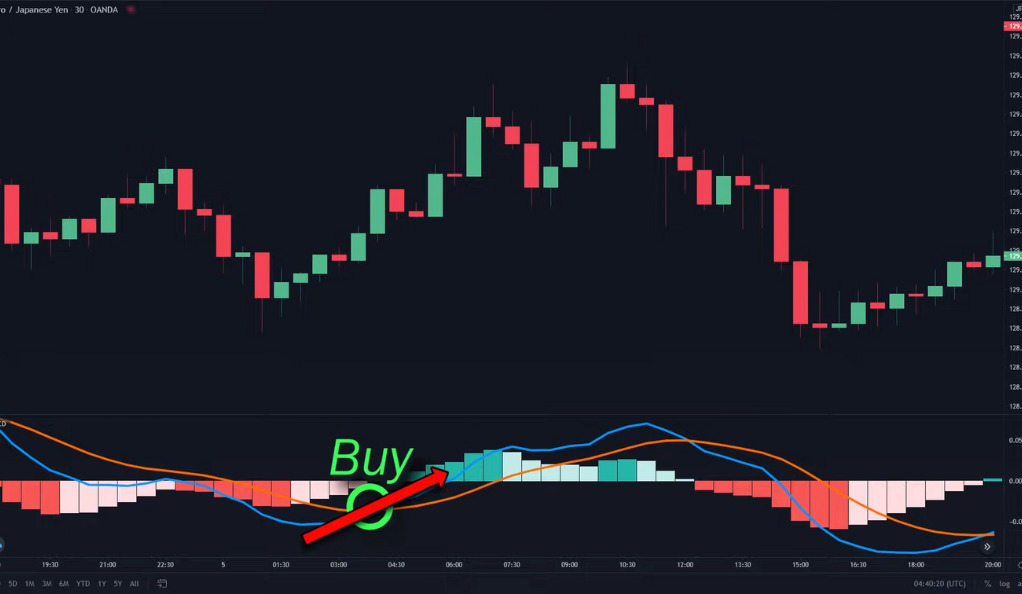
When the MACD line crosses above the signal line, it generates a bullish signal, indicating that the buying momentum is strengthening and a potential uptrend may be underway. This can serve as a signal to consider buying or holding positions. Conversely, when the MACD line crosses below the signal line, it generates a bearish signal, indicating that the selling momentum is increasing and a potential downtrend may be emerging. This can provide a signal to consider selling or taking profits.
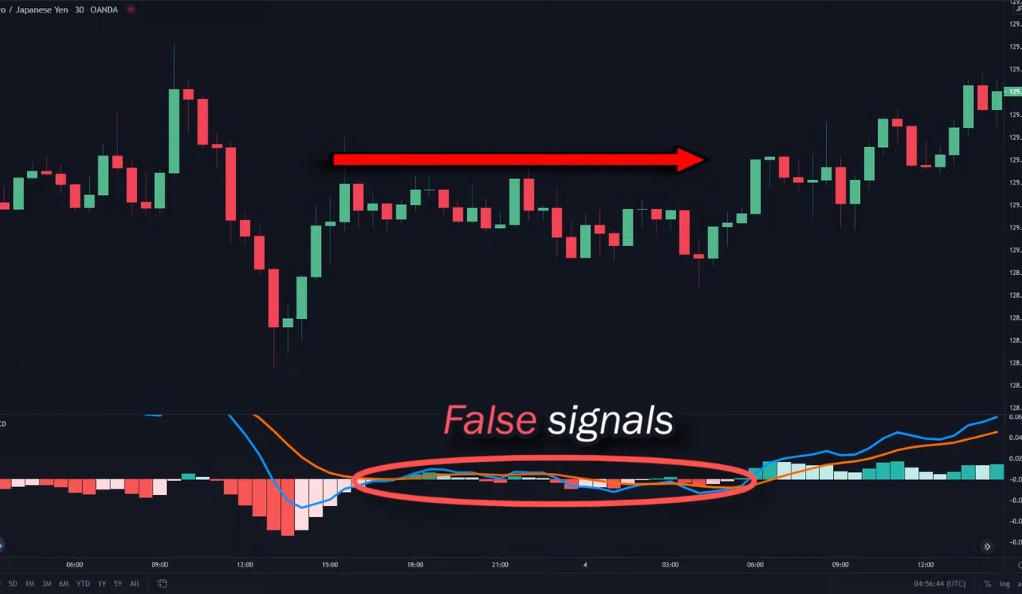
However, it’s important to note that the MACD should not be used as a standalone indicator, especially in a sideways or choppy market. During such periods, the MACD can generate false signals, leading to potential losses. To mitigate this, we incorporate the MACD as an additional confirmation tool in our trading strategy. By combining the MACD signals with other indicators, such as trendlines, support and resistance levels, or volume analysis, traders can enhance the accuracy of their trading decisions and ensure that the overall momentum aligns with their desired direction. This multi-indicator approach helps filter out false signals and increases the probability of successful trades.
Combining the Three Indicators: The Strategy
Now that we understand each indicator’s role let’s see how we can combine them for a comprehensive trading strategy.
Buy Signal
- Wait for both the K and D lines of the Stochastic to hit oversold.
- Confirm the uptrend with the RSI. It should be above the middle line.
- Confirm the upwards momentum with the MACD. The MACD line should cross above the signal line.
- Ensure that both of the Stochastic lines haven’t hit overbought yet.
- If all these conditions are met, take a buy position.
Sell Signal
- Wait for both the K and D lines of the Stochastic to hit overbought.
- Confirm the downtrend with the RSI. It should be below the middle line.
- Confirm the downwards momentum with the MACD. The MACD line should cross below the signal line.
- Ensure that both of the Stochastic lines haven’t hit oversold yet.
- If all these conditions are met, take a sell position.
Exit Strategy and Risk Management
Implementing a well-defined exit strategy and effective risk management techniques are fundamental aspects of successful trading. Once a trader enters a position, it is essential to determine appropriate exit points to both protect against potential losses and secure profits. For buy positions, it is advisable to place a stop-loss order below the nearest swing low. A swing low represents a significant low point on the price chart. By setting the stop-loss below this level, traders aim to limit potential losses in the event of an unfavorable price movement. Additionally, setting a profit target at 1.5 times the stop-loss level enables traders to capitalize on favorable price movements. Achieving this target indicates a satisfactory profit, and it prompts the trader to close the position and secure the gains.
Conversely, for sell positions, traders should place their stop-loss order above the nearest swing high. This helps safeguard against adverse price movements that may result in losses. Similarly, setting a profit target at 1.5 times the stop-loss level allows traders to take advantage of downward price trends and maximize their potential profits. If the price reaches this target, it serves as a signal to exit the position and lock in the achieved gains.
Optimizing the Strategy
To enhance the optimization of this trading strategy, it is advisable to implement a maximum stop loss limit based on a certain percentage of your trading capital. By limiting your stop loss to, for example, 0.15% of your trading capital, you ensure that your potential losses on any single trade do not exceed a predetermined threshold. This risk management technique helps protect your capital and prevents substantial losses from negatively impacting your overall trading performance. By adhering to this limit, you can maintain consistency in your risk exposure and avoid significant drawdowns.
Additionally, it is recommended to refrain from opening new positions if you have not closed your previous ones. Managing multiple trades simultaneously can be challenging and increases the complexity of monitoring and adjusting each position effectively. It also heightens the risk of potential losses if market conditions change rapidly or unexpectedly. By focusing on one trade at a time and closing it before opening a new position, you can maintain better control over your trades, reduce the likelihood of making errors, and minimize unnecessary risks.
Conclusion
The combination of the Stochastic, RSI, and MACD indicators provides a robust trading strategy that can help traders identify potential trading opportunities with a higher probability of success. However, like any trading strategy, it’s not foolproof and requires proper risk management. Always remember, the key to successful trading lies not in finding the perfect strategy but in consistent execution, discipline, and effective risk management. Happy trading!
Ainu Token aims to offer impartial and trustworthy information on cryptocurrency, finance, trading, and shares. However, we don't provide financial advice and recommend users to conduct their own studies and thorough checks.
Comments (No)