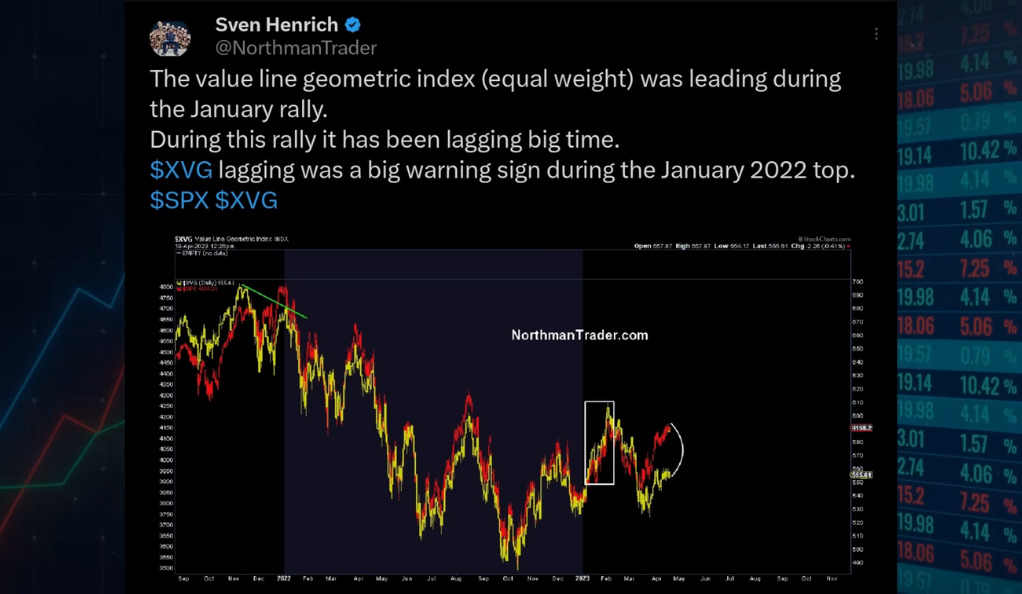
Hey there, market enthusiasts! Have you ever found yourself puzzled by the fluctuations and trends in the stock market? Specifically, the comparison between the SPX (S&P 500) and XVG (equal weight S&P 500) has been a hot topic lately. We’re diving deep into the massive gap in performance that’s been turning heads, especially during the top of 2022 and the last bear market rally. This gap is not just a statistical anomaly; it’s a sign of underlying market dynamics that can provide valuable insights for investors, traders, and market watchers alike. So, grab a cup of coffee, and let’s explore this intriguing phenomenon together!
Analysis of the Gap
The Widening Gap Post-Silicon Valley Bank Collapse
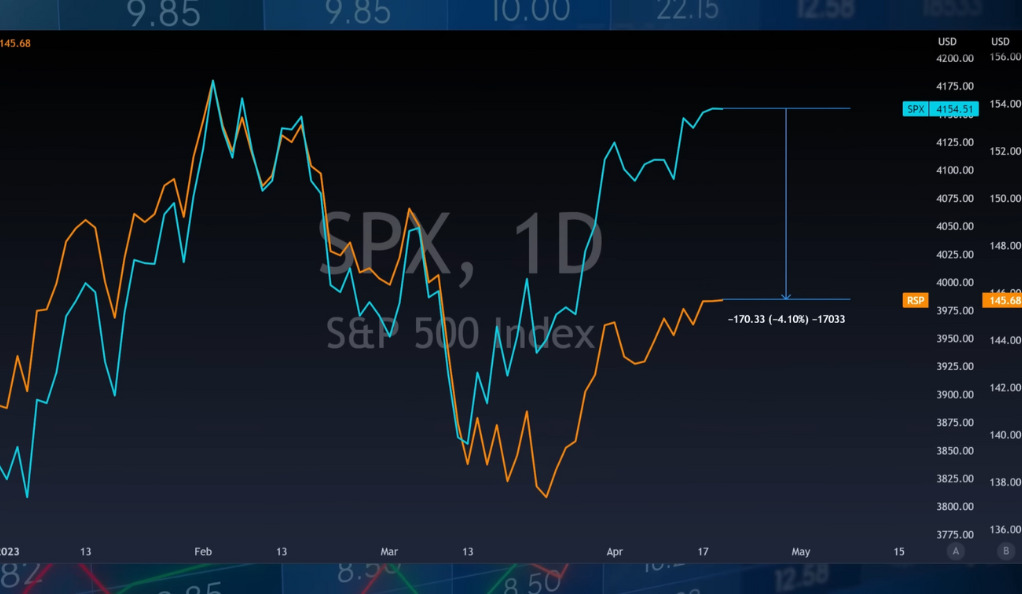
The collapse of Silicon Valley Bank was a shock to the market, and its ripples were felt far and wide. This event led to a widening gap between the SPX and XVG, like watching a race where one runner suddenly pulls ahead. But what does this mean for the market? Some experts predict that the SPX could decline by more than 4% to close this gap. It’s a significant shift that has many market watchers on edge. The implications of this gap go beyond mere numbers; they reflect underlying market sentiments and can provide valuable insights into future trends.
Qs vs. NDXE: A Similar Story
And it’s not just the SPX and XVG. The Qs (NASDAQ-100) and the NDXE (equal weight NASDAQ-100) are showing a similar trend. It’s like déjà vu in the market world! This parallel between different indices is a sign of broader market dynamics at play. Understanding these trends can help investors make informed decisions and navigate the complex landscape of the stock market. It’s like having a roadmap to guide you through the twists and turns of the financial world.
Forensic Examination of the Market
A Closer Look at Different Sectors
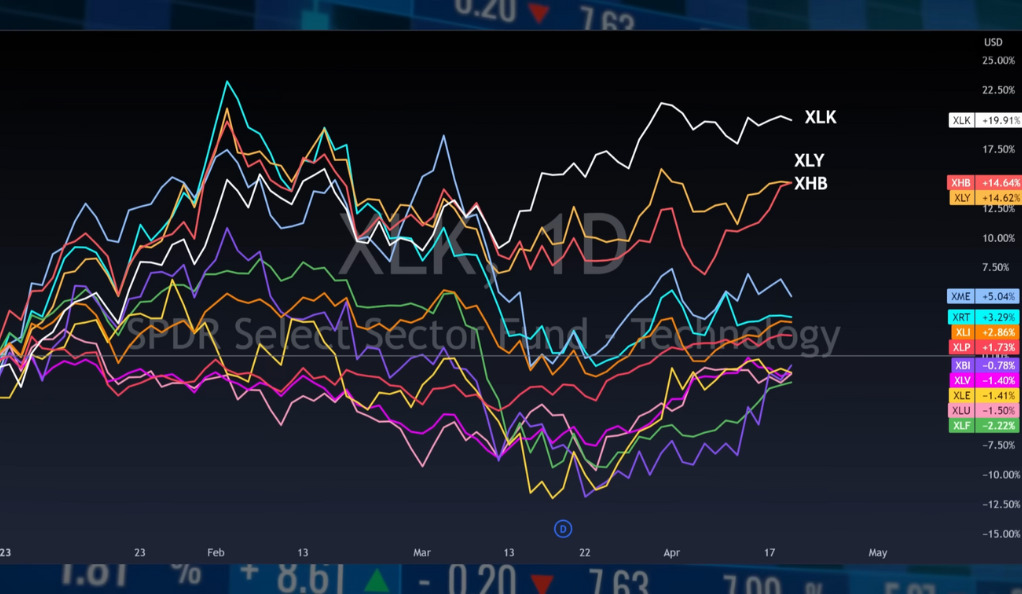
Ready to play detective? Let’s examine the different sectors of the stock market. Three culprits stand out: XLK technology, XLY consumer cyclicals, and XHB home builders. These sectors are responsible for the performance gap. Intriguing, isn’t it? By dissecting these sectors, we can uncover the forces driving the market and identify potential opportunities and risks. It’s like peeling back the layers of an onion to reveal the core of what’s really happening in the market.
The Aftermath of SVB’s Collapse
The collapse of SVB wasn’t just a headline; it accelerated the performance gap like adding fuel to a fire. It’s a plot twist that’s still unfolding! The aftermath of this collapse has reshaped the market landscape, affecting various sectors and leading to new trends and patterns. Understanding the ripple effects of such a significant event is crucial for investors and traders looking to navigate the ever-changing market terrain. It’s like understanding the aftershocks of an earthquake, allowing you to prepare and respond effectively.
Detailed Look at the Sectors
Home Builders, Technology, and Consumer Cyclicals
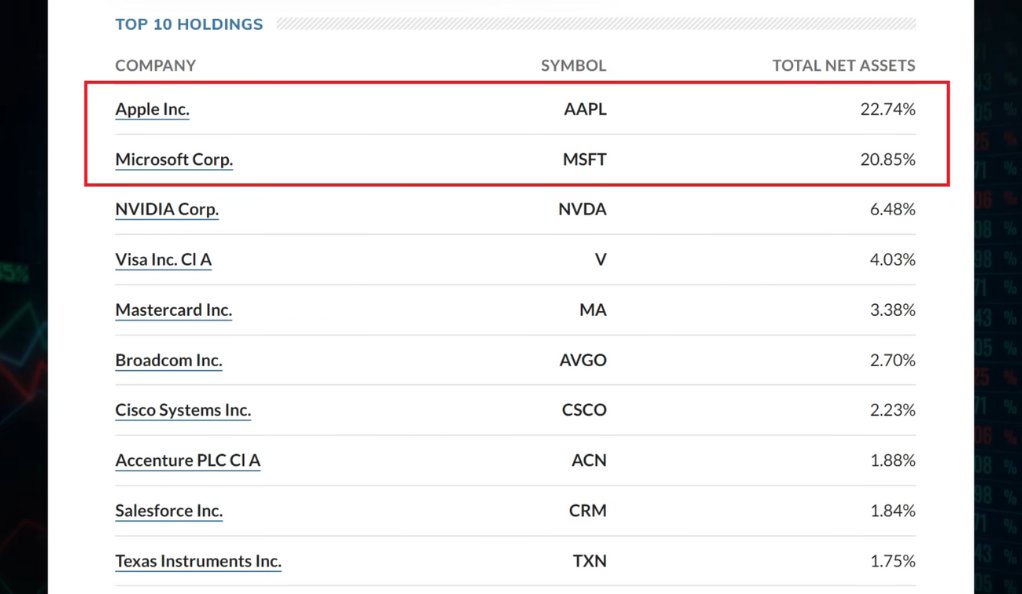
Ever wondered who’s behind the curtain? Let’s look at home builders (XHB), technology (XLK), and consumer cyclicals (XLY). These sectors are like the main characters in our market drama. The home builders have been riding a wave of optimism, while technology companies like Apple and Microsoft continue to dominate the market. Consumer cyclicals, on the other hand, reflect the ever-changing consumer behavior and economic conditions. By examining these sectors in detail, we can gain insights into the broader market dynamics and identify potential investment opportunities.
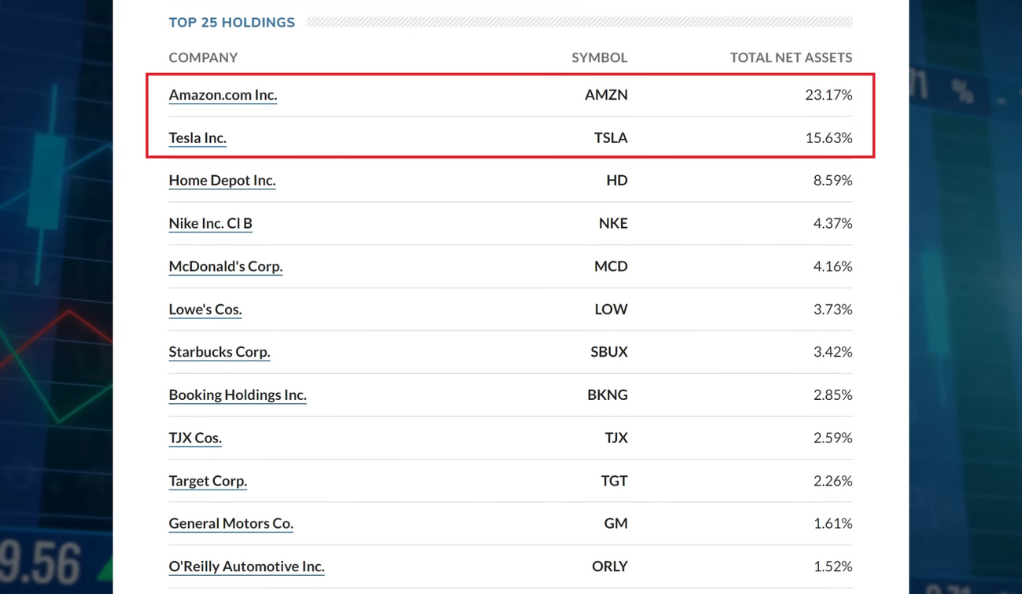
The Big Three: Apple, Microsoft, Nvidia, Amazon, and Tesla
Guess what? Apple, Amazon, and Microsoft are single-handedly behind the market rally. It’s like having three superheroes leading the charge! These giants have been driving the market, shaping trends, and influencing investor behavior. Understanding their strategies, performance, and impact on the market is essential for anyone looking to invest or trade in today’s complex financial landscape. It’s like studying the playbook of the champions to understand the game better.
Market Trends and Patterns
The Non-Inclusive Rally
This current rally is not playing fair. It’s led by a handful of names, with U.S. large caps like Apple, Microsoft, and Amazon stealing the spotlight. It’s like a party where only a few guests are dancing! This non-inclusive rally raises questions about the sustainability and stability of the market. Is it a sign of underlying weaknesses, or is it a temporary phenomenon? Understanding these trends can help investors make informed decisions and avoid potential pitfalls.
Who Will Fall First?
Speculating on which sector will go down first is like guessing the next move in a chess game. Will it be technology or consumer cyclicals? The suspense is real! This speculation is more than just a guessing game; it’s a strategic analysis of market dynamics, trends, and potential risks. Identifying the weak links and potential downturns can provide valuable insights for investors looking to protect their portfolios and capitalize on market opportunities.
Warnings and Indicators
Previous Warnings and the Potential Breakdown
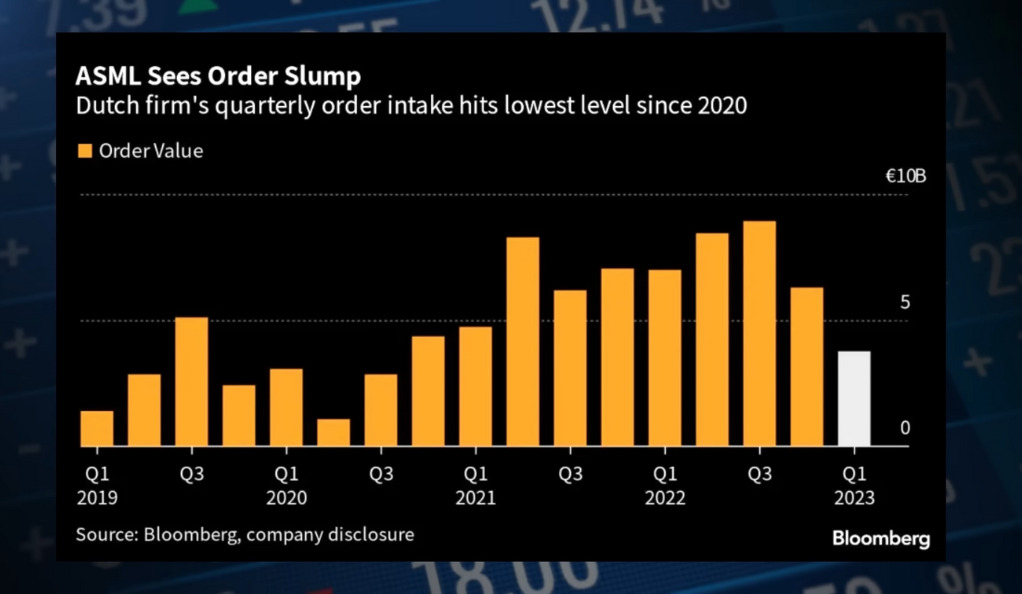
Remember those warnings about the so-called bull market? They’re back, and the focus is on the chip sector. TSM and ASML have sounded the alarm. It’s like seeing storm clouds on the horizon. These warnings are not just noise; they’re signals of potential market shifts and risks. Paying attention to these indicators can help investors navigate the turbulent waters of the stock market and make informed decisions.
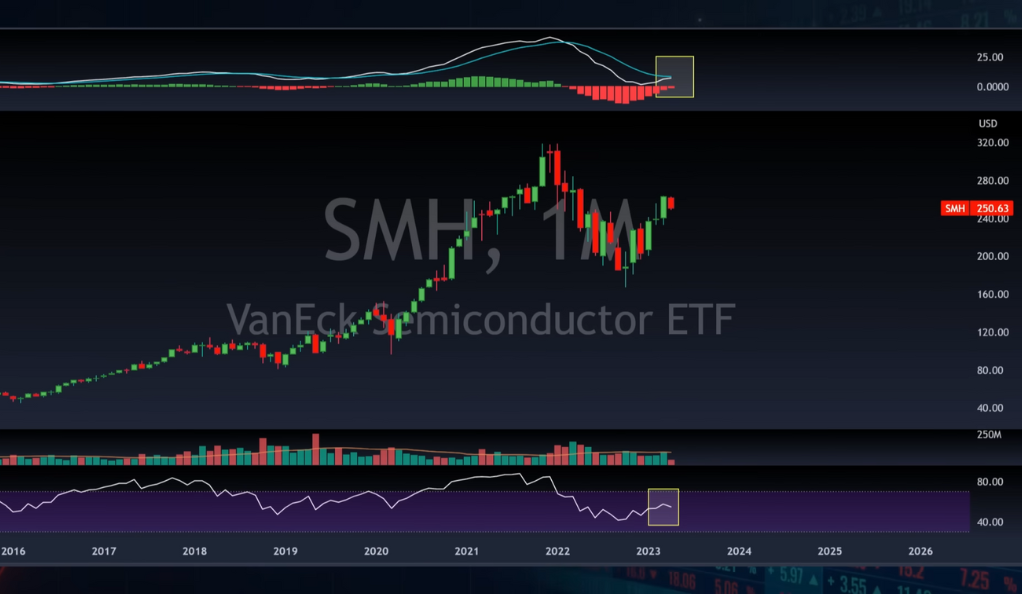
The SMH Chart: A Warning Sign
The monthly chart of the SMH (Semiconductor ETF) shows a potential reverse ABC pattern. It’s a red flag waving at us, signaling potential new lows. Technical analysis, like reading the SMH chart, provides valuable insights into market trends and potential reversals. It’s like having a weather forecast to guide your investment decisions, allowing you to prepare for potential storms and capitalize on sunny days.
Sentiment and Expectations
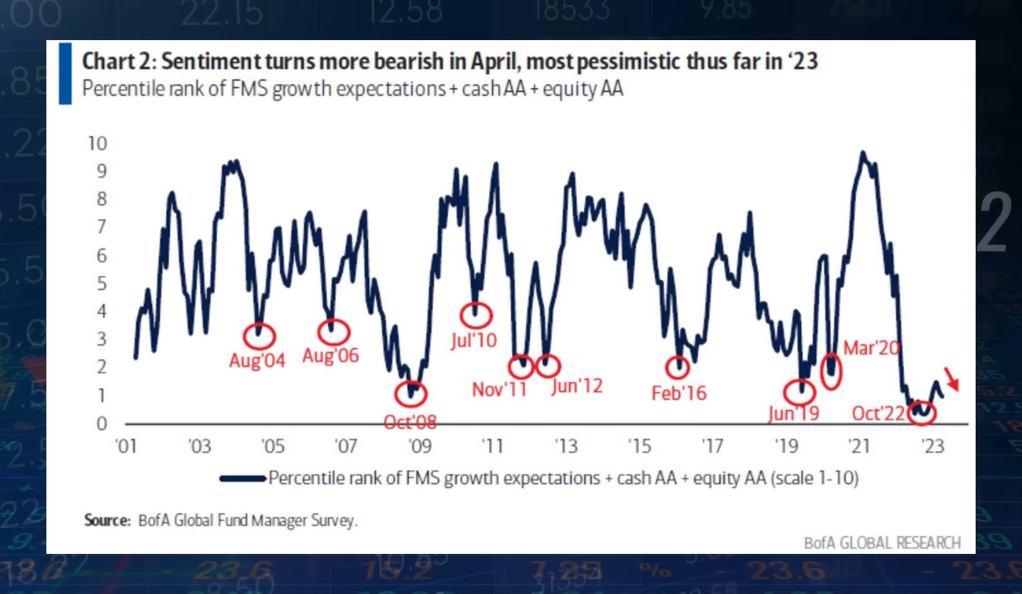
Growth Expectations and Bonds
The B of A Global fund manager survey paints a picture of growth expectations and the highest overweight positioning in bonds since ’09. It’s like reading the market’s mood ring! This survey reflects the collective sentiment of fund managers, providing insights into market expectations, investment strategies, and potential trends. Understanding these sentiments can help investors align their portfolios with market dynamics and capitalize on emerging opportunities.
The Bottom Is Not Yet Reached
Hold your horses! The conclusion that the bottom is not yet reached is like a plot twist in a thriller. More allocation toward bonds? It’s still in the cards! This ongoing uncertainty about the market bottom reflects the complex and ever-changing nature of the financial landscape. It’s a reminder that the market is not a static entity but a dynamic ecosystem that requires constant monitoring, analysis, and adaptation.
Final Thoughts
The Uncertainty and Complexity of the Market
Navigating the market is like sailing through uncharted waters. If the outlook is right, chips will break first, followed by big caps and Amazon, ending the rally. It’s a sequence of dominoes waiting to fall. The market is a complex and unpredictable entity, filled with opportunities and risks. Understanding its intricacies requires diligence, analysis, and a willingness to adapt to changing conditions.
It’s Not Over Yet
The situation is not over yet, and further shifts in the market are possible. It’s like a movie with a sequel in the making. Stay tuned! The market is a living, breathing entity that continues to evolve, surprise, and challenge us. Staying informed, adaptable, and responsive is key to navigating its twists and turns successfully.
Conclusion
So, there you have it, folks! From the SPX and XVG to the intricate dance of sectors and key companies, we’ve unraveled the mysteries of the market. It’s a world full of surprises, twists, and turns. Will the gap close? Will the big caps fall? Only time will tell. But one thing’s for sure: the market’s story is far from over. Keep watching, keep learning, and most importantly, keep enjoying the ride! Whether you’re an investor, trader, or just a curious observer, the market offers a thrilling adventure that never ceases to amaze. Happy investing!
Ainu Token aims to offer impartial and trustworthy information on cryptocurrency, finance, trading, and shares. However, we don't provide financial advice and recommend users to conduct their own studies and thorough checks.
Comments (No)